Tamadoge (TAMA/USD) Continues to Soar After Recent Dip

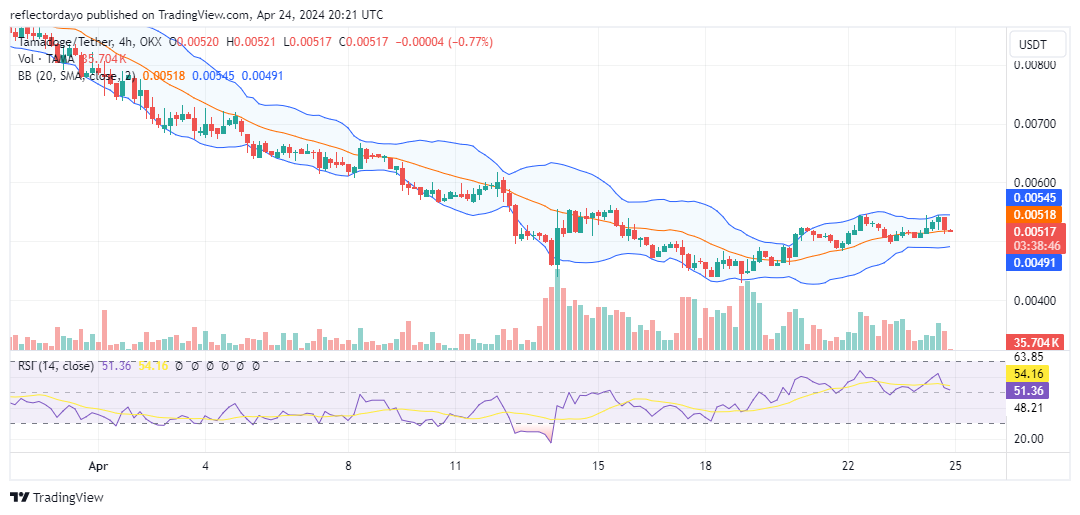
Following a bullish intervention at the $0.0045 price level, the تاما / دولار market has continued its upward trajectory, consistently forming higher lows and surpassing the $0.005 price threshold. Despite breaching this pivotal level, the market has encountered a minor support level above $0.005. However, new concerns have emerged as we observe resistance around the $0.0055 price mark. The TAMA/USD market has experienced rejection from this level on two occasions, with the most recent instance occurring in the current trading session. Consequently, the market is now seeking to establish another higher support level, targeting the 20-day moving average at $0.00518.

مستويات رئيسية

  • المقاومة: 0.013 دولار ، 0.014 دولار ، 0.015 دولار.
  • الدعم: 0.0045 دولار ، 0.0040 دولار ، 0.0035 دولار.

Tamadoge (TAMA) Continues to Soar After Recent Dip

تحليل أسعار TAMA / USD: وجهة نظر المؤشرات

The market indicator suggests the potential for consolidation around the $0.00518 price level. Upon examination of the Bollinger Bands indicator, it is evident that the bands have transitioned from an upward trend to a horizontal movement. Additionally, traders appear to be establishing support around the 20-day moving average, indicating a minor deviation from the previous low of $0.00509. The Relative Strength Index (RSI) line has retraced to the midpoint of the indicator, reflecting a balanced market characterized by equilibrium between demand and supply.

Tamadoge (TAMA) Continues to Soar After Recent Dip

توقعات Tamadoge قصيرة المدى: مخطط ساعة واحدة

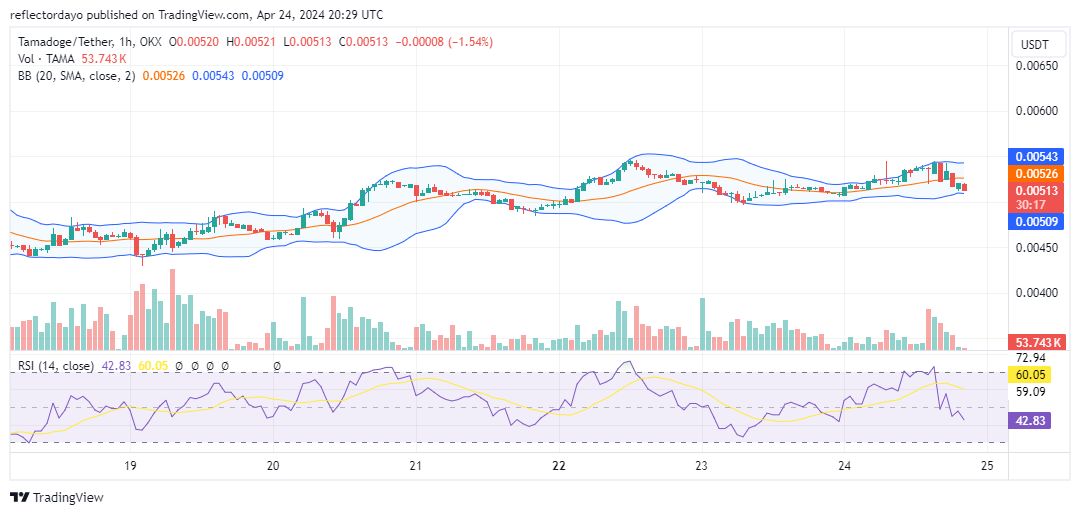
As the market seeks support at $0.00518, there is a notable decrease in trading volume. This decrease suggests that the market is entering a consolidation phase. Should the bulls establish a strong foothold at this level, it could pave the way for a breakout above the critical resistance point of $0.0054 in due course.

شراء تامادوغي!

هل تريد عملة ستكون أكثر قيمة بمئة مرة في الأشهر القليلة القادمة؟ هذا هو تامادوجي. اشترِ TAMA اليوم!

Jupiter Project: A Guide to JUP

Jupiter (JUP) is an advanced swap aggregation engine built on the Solana blockchain. It facilitates essential liquidity infrastructure for the Solana ecosystem and offers a comprehensive suite of DeFi products. Some of the features of Jupiter include Limit Order, DCA/TWAP, Bridge Comparator, and Perpetuals Trading.

The Jupiter token (JUP): Fueling the Fires of the Jupiter DEX

The JUP token is the lifeblood of the Jupiter DEX. Imagine it as the key that unlocks the كوكب المشتري vault, granting holders a say in the platform’s future through voting rights. But the power doesn’t stop there. JUP fosters a thriving community by rewarding members with scheduled airdrops, a welcome rainmaker in the cryptoverse.

There’s a finite number of JUP tokens in existence—10 billion, to be exact. These are meticulously distributed to fuel the core team, strategic reserves, and liquidity, ensuring the smooth operation of the exchange. But worry not, the community isn’t left out. A portion is specifically allocated for those who make Jupiter tick!

Holders become galactic governors, shaping the platform’s destiny through the Jupiter DAO. We shower the community with 4 billion JUP tokens through regular airdrops, a crypto rainmaker that nourishes active users. A portion fuels the core team and strategic reserves, ensuring our longevity and forging powerful partnerships. The best part? JUP empowers community-driven initiatives through DAO-managed grants. JUP’s value isn’t just about utility; it ripples outward, fostering a vibrant community within Jupiter and the wider cryptosphere.

Welcome to the Jupiter Exchange: Your Stellar Cryptocurrency Oasis

Forget the crowded exchanges; Jupiter Exchange is your celestial haven in the vast crypto cosmos. Jupiter offers a universe of features, from comprehensive services to an unparalleled user experience. The platform is said to be a constellation of advantages, setting us light years ahead of the competition.

Holocryptic Defense:

Imagine your assets guarded by celestial sentinels. That’s the power of Jupiter’s cutting-edge holocryptic encryption. Jupiter Exchange erects an impenetrable barrier against cyber threats, keeping your digital treasures safe and sound.

Guardian of Access: Vigilance at its Finest

Multi-factor authentication becomes a multi-layered guardian in Jupiter Exchange. Jupiter employs a phalanx of security measures to repel unauthorized access, ensuring your account remains firmly within your grasp.

Intuitive Exploration: Charting the Course with Ease

Jupiter’s user-friendly interface is your launchpad into the crypto market. Whether you’re a seasoned trader or a curious newcomer, navigating Jupiter Exchange is effortless. It’s like setting sail on a user-friendly spacecraft, allowing you to explore the cosmic market with grace and confidence.

Jupiter Project: A Guide to JUP

Unlock the Celestial Codex: Knowledge is Power

At Jupiter Exchange, powerful charting tools become celestial maps in your hands. Decipher the market’s movements with ease, make informed decisions with confidence, and wield the power of comprehensive analysis at your fingertips.

Diverse Asset Galaxy: A Universe of Opportunities

Jupiter offers a sprawling expanse of cryptocurrencies, creating a vast celestial canvas for your exploration. Trade a diverse array of digital assets, each representing a unique opportunity in the ever-evolving DeFi landscape. Jupiter Exchange is your gateway to a universe of possibilities.

Velocity in Trading: Lightspeed Execution

Jupiter has a lightning-fast trading engine, propelling trades at unimaginable speeds. Experience prompt and seamless execution, letting you navigate the market with unparalleled velocity and reach uncharted territories faster than ever before.

Jupiter (JUP) Market Metric Data

  • JUP/USD Price Now: $1.2
  • JUP/USD Market Cap: $1.6 billion
  • JUP/USD Circulating Supply: 1.4 billion
  • JUP/USD Total Supply: 10 billion
  • JUP/USD CoinMarketCap Ranking: #62

تأملات ختامية

In the vast galaxy of cryptocurrency platforms, Jupiter Exchange shines brightly as a paragon of quality. Its unwavering commitment to robust security measures, user-friendly interface, diverse selection of assets, and responsive customer service combine harmoniously, forming a constellation of qualities that positions it as a prime choice for your trading endeavors.

تداول العملات المشفرة على BYBIT!

Changpeng Zhao vs. DOJ: DOJ Pushes for 36-Month Jailtime

In a landmark case that has gripped the cryptocurrency world, Changpeng "CZZhao, the founder of the renowned digital currency exchange Binance, faces a potential three-year prison sentence. The U.S. Department of Justice (DOJ) has aggressively pursued a 36-month incarceration term for Zhao, who has confessed to violating the Bank Secrecy Act.Changpeng Zhao vs. DOJ: DOJ Pushes for 36-Month Jailtime

شدة تشاو transgressions has caused the DOJ to seek a sentence exceeding the initial 18-month plea deal. The prosecution’s argument rests on the substantial impact of تشاو failure to implement an effective anti-money laundering (AML) program at Binance. This lapse enabled the platform to serve as a conduit for various illicit activities, including transactions from darknet markets and proceeds from ransomware attacks.

Changpeng Zhao Should Only Get Probation: المدعى عليه المحامين

فى المقابل، تشاو فريق الدفاع argues against imprisonment, citing his significant نهاية payment and acknowledgment of responsibility. They propose probation with خيار home confinement in Abu Dhabi as an alternative to incarceration.

• وزارة العدل filing underscores the broader implications of تشاو sentencing, portraying it as a cautionary message to the global community regarding the consequences of disregarding U.S. laws. The case يشدد على ضرورة stringent compliance within the rapidly expanding crypto industry, often likened to the "الغرب المتوحشdue to its lack of regulation.

As the legal proceedings progress, the DOJ highlights the unprecedented magnitude of تشاو misconduct. The filing outlines how وBinance lax AML measures facilitated the obfuscation of cryptocurrency origins and ownership, enabling a range of financial crimes.

Furthermore, the sentencing memo criticizes the current Sentencing Guidelines for Bank Secrecy Act violations, arguing that they fail to address the severity of crimes that pose a threat to الأمن القومي. هذه reflects a growing sentiment that the cryptocurrency sector must be held to higher standards of accountability to protect both consumers and financial system integrity.

With a $50 million fine already agreed upon, attention now turns to the المحكمة قرار بشأن تشاو fate. The outcome of this case is poised to establish a precedent for handling legal breaches in the crypto space, signaling a new era of enforcement and accountability.

As the crypto community awaits the final sentencing on April 30, the question lingers: will تشاو case serve as a cautionary tale that reshapes the الصناعة approach to legal compliance? Only time will tell.

عند التداول في سوق العملات المشفرة، ليس من الضروري أن يكون الأمر كذلك "اضرب أو أخطأ." قم بحماية محفظتك الاستثمارية من خلال الصفقات التي تحقق نتائج فعلية، تمامًا مثل قسط التأمين الخاص بنا إشارات التشفير على برقية.


هل أنت مهتم بتعلم كيفية تداول العملات المشفرة يوميًا؟ احصل على جميع المعلومات التي تحتاجها هنا

Compound Experiences Bearish Breakout From Symmetrical Triangle

تحليل السوق - السعر يضرب منطقة المقاومة الرئيسية

Compound has just experienced a bearish breakout from a symmetrical triangle on the daily chart. Prior to the breakout, the Hull butterfly indicator signalled a price decline with its red hue. Compound (COMPUSD) has been locked in an enduring struggle with resistance levels, particularly evident around the $74.460 threshold, spanning nearly two years. Despite concerted efforts, the price has found it challenging to breach this pivotal barrier, with indications of resistance dating back to May 2022.

المستويات الرئيسية المركبة

مستويات الطلب: 106.000 دولار أمريكي، 87.540 دولار أمريكي، 74.460 دولار أمريكي
مستويات العرض: $ 30.270 ، $ 26.000 ، $ 25.000

Compound Experiences Bearish Breakout From Symmetrical TriangleThe demand zone at $30.270 has emerged as a stalwart bastion against further price depreciation. With each interaction, this level has spurred bullish reversals, contributing to a sustained period of price consolidation within the confines of $74.470 and $30.270.

However, March brought a paradigm shift as bullish sentiment surged amidst the crypto community. The subsequent formation of a symmetrical triangle following the March ascent above $74.470 signaled heightened market volatility, culminating in a bearish breakout that breached the supporting trendline on the daily chart.

Prior to the formation of the Symmetrical triangle, Compound’s price propelled above the resistance zone at $74.400. Nonetheless, this bullish fervor was short-lived, as the price encountered immediate resistance at $97.540, precipitating a swift downturn.

The subsequent formation of a symmetrical triangle following the March ascent signaled heightened market volatility, culminating in a bearish breakout that breached the supporting trendline on the daily chart.

Compound Experiences Bearish Breakout From Symmetrical Triangle

توقعات السوق

Looking forward, market sentiment remains cautiously optimistic, despite indications of a downward trend from the Hull Butterfly Indicator. While recent bullish activity has injected optimism, there is speculation regarding a potential pullback phase, with market participants eyeing a selloff targeting the last swing low of $43.000.

يمكنك شراء Lucky Block من هنا. شراء LBLOCK

ملاحظاتcryptosignals.org  ليس مستشار مالي. قم بالبحث قبل استثمار أموالك في أي أصل مالي أو منتج أو حدث مقدم. نحن لسنا مسؤولين عن نتائج الاستثمار الخاصة بك.

Shiba Inu Bulls Face Obstacle with Sellers Likely to Take Turn

Market Analysis – Sellers Are Ready to Take Charge

Shiba Inu bulls face obstacles, with sellers likely to take turns. Shiba Inu has captured the interest of many investors. However, like any other cryptocurrency, Shiba Inu is not immune to تقلبات السوق. The recent weeks have witnessed a fierce battle between the bulls and the sellers in the Shiba Inu market.

The buyers have shown strong resilience, putting up a serious fight against the sellers. Shiba Inu is currently trading at the significant level of $0.0000270, desperately looking for a way to escape the downward pressure. The bulls are currently tilted down in a descending flag channel, indicating a consolidation phase after a period of bullish expansion.

مستويات مفتاح شبعا اينو

مستويات المقاومة: 0.00003700 دولار ، 0.00002900 دولار
مستويات الدعم: 0.00001500 دولار ، 0.00000600 دولار

Shiba Inu Bulls Face Obstacle with Sellers Likely to Take Turn

The journey of the bulls began from the significant level of $0.00000900. They were fortunate enough to gain strength and pull through with a significant liquidity purge. The crypto market witnessed a surge in buying activity, pushing the price of Shiba Inu higher. However, as the buyers reached their limits, they were unable to push the price any further. This led to a gradual response to selling pressure, resulting in a descending channel formation.

Shiba Inu Bulls Face Obstacle with Sellers Likely to Take Turn

توقعات السوق

The stochastic oscillator suggests that the buyers are currently staying close to the overbought area. This indicates that they may be losing momentum and could potentially exit the market. Additionally, the Moving Averages Convergence and Divergence (MACD) have crossed out, signaling a potential reversal in the price trend.

Considering these indicators, it is likely that the buyers will pull out of the scene after trading close to the significant zone of $0.0000028000. If this scenario unfolds, it is plausible to see the price of SHIBUSD returning to the lower side of the descending channel. This would present an opportunity for sellers to regain control and potentially push the price further down.

يمكنك شراء Lucky Block من هنا.  شراء LBLOCK

ملحوظة: cryptosignals.org ليس مستشار مالي. قم بالبحث قبل استثمار أموالك في أي أصل مالي أو منتج أو حدث مقدم. نحن لسنا مسؤولين عن نتائج الاستثمار الخاصة بك.

Bitcoin (BTC/USD) Market Wallows Upward, Putting in Slows

توقع سعر البيتكوين - 24 أبريل

The kind of price actions that have been showcasing in the BTC/USD عمليات السوق as of this analysis, demonstrates that the price wallows upward, putting in slows.

The market’s rebound to the upward has been firmly adhering to a trade zone where long-position movers must exert significant effort to secure additional recovery motions. If the price would still remain in the middle of the Bollinger Band, the current trading movement velocity suggests that the advances to the north may not be receiving the timely positive push needed to sustain them.

سوق BTC / USD
مستويات رئيسية هي:
مستويات المقاومة: $ 70,000 و $ 72,500 و $ 75,000
مستويات الدعم: $ 62,500 و $ 60,000 و $ 57,500

BTC / USD - الرسم البياني اليومي
The BTC/USD daily chart presents a show that the market is wallowing upward, putting in slows.

The lower Bollinger Band trend lines have held, providing a strong crypto signal that points to $60,000 as the next critical level at which the price should find support. The stochastic oscillators are being tentatively veering to the north while feigning a descent entry for bulls.
Bitcoin (BTC/USD) Market Wallows Upward, Putting in Slows

Will the current positive momentum speculation in the BTC/USD trade continue?

The positivity pace on the crypto signal on the BTC / USD operations may tend to prolong for a while, especially if the price doesn’t give back to a sudden fall-off, as the crypto economy wallows upward, putting in slows.

The blue part of the stochastic oscillators has traversed northward to a notable higher spot nearing the line of 80 to denote that further pushes to the upside seem not to build on stable moves soon. Investors may still hold to the way back to $70,000 and even a bit above before tending to returning to a correction.

Bears may still need to be extra cautious in the area of the middle Bollinger Band. To open up some areas of entry for sellers, a series of rejections must occur below the $70,000 resistance line for a considerable amount of time.
Bitcoin (BTC/USD) Market Wallows Upward, Putting in Slows
مخطط 4 ساعات BTC / USD
BTC / USD 4-hour chart showcases the crypto-economic market wallows upward, putting in slows

The upward trend lines of the Bollinger Bands have continued to lead towards the $70,000 resistance line. At the 40-point, the stochastic oscillators are prone to repositioning and the potential for further building up. Points between the middle and he lower Bollinger Bands are liable to form the zones for the market to move to the north


ملاحظات: Cryptosignals.org ليس مستشارًا ماليًا. قم ببحثك قبل استثمار أموالك في أي أصل مالي أو منتج أو حدث معروض. نحن لسنا مسؤولين عن نتائج الاستثمار الخاصة بك.


يمكنك شراء Lucky Block من هنا. شراء LBLOCK


Hedera Hashgraph (HBAR/USD) يصحح بعد الارتفاع القوي في الأسعار

الهاديرا هاشغراف ظل السوق ضمن نطاق محدود نسبيًا لفترة طويلة، على الرغم من أنه شهد تحولًا صعوديًا هامشيًا مع زيادة التقلبات بشكل طفيف. من خلال الاستفادة من هذا التقلب، دفع المضاربون على الارتفاع السوق من مستوى السعر 0.07 دولار إلى 0.10 دولار. منذ 20 فبراير، حدثت تقلبات الأسعار في الغالب حول علامة 0.10 دولار، مما يفضل في الغالب الحركة الصعودية، مما يدل على القوة الصعودية.

ومع ذلك، في 13 أبريل، وجد السوق دعمًا عند 0.08 دولار. من إشارة التشفير على الرسم البياني اليومي، اكتشفنا أن مستوى الدعم هذا أصبح مستوى محوريًا لتحفيز ارتفاع آخر في السعر إلى منطقة سعر 0.15 دولار.

بيانات السوق Hedera Hashgraph

  • سعر HBAR / USD الآن: 0.12 دولار
  • القيمة السوقية لـ HBAR/USD: 4.4 مليار دولار
  • HBAR/USD العرض المتداول: 35.7 مليار
  • HBAR/USD إجمالي العرض: 50 مليار
  • HBAR / USD ترتيب CoinMarketCap: # 24

Hedera Hashgraph (HBAR/USD) يصحح بعد الارتفاع القوي في الأسعار

مستويات رئيسية

  • المقاومة: 0.16 دولار و 0.17 دولار و 0.18 دولار.
  • الدعم: 0.10 دولار و 0.09 دولار و 0.08 دولار.

Hedera Hashgraph من خلال عدسة المؤشرات

تشير الشمعة الهبوطية الحالية إلى زخم هبوطي قوي في السوق. وصل السوق إلى ذروته عند 0.18 دولار. بعد فترة من التماسك مع تحولات طفيفة في الاتجاه التصاعدي، ينتهز العديد من المستثمرين القدامى الفرصة للاستفادة من أعلى مستويات السوق عن طريق جني الأرباح. نظرًا للزخم الهبوطي السائد، هناك احتمال أن يؤدي ذلك إلى تآكل مكاسب السوق الصعودية، مما يؤدي إلى الانحدار إلى مستوى سعر 0.10 دولار تقريبًا.

ومع ذلك، فإن ميل السوق إلى إظهار المزيد من التقلبات الصعودية فوق مستوى سعر 0.10 دولار مقارنة بما دونه منذ 20 فبراير يؤكد القوة المستمرة للمضاربين على الارتفاع. في حين أن تحركات الأسعار المفاجئة والقوية مثل هذه تؤدي عادةً إلى عمليات جني الأرباح، فإن الشعور الصعودي الأساسي يشير إلى أن المضاربين على الارتفاع قد يجدون الدعم عند مستوى أعلى، ربما حول مستوى السعر 0.12 دولار.

Hedera Hashgraph (HBAR/USD) يصحح بعد الارتفاع القوي في الأسعار

توقعات سعر HBAR/USD: تحليل الرسم البياني لمدة 4 ساعات 

تاريخيا، عتبة السعر 0.12 دولار يحمل أهمية لـ Hedera Hashgraph كمستوى ذي صلة حيث يمكن أن يحدث تدخل صعودي. ومع ذلك، ونظرًا للزخم الهبوطي السائد حاليًا، فقد يستقر السوق عند هذا المستوى مع وصول العرض والطلب إلى التوازن. من المحتمل أن تؤدي مرحلة التماسك هذه إلى تقليل الزخم الهبوطي، مما يمهد الطريق لعودة الحركة الصعودية، بهدف استعادة عتبة السعر البالغة 0.18 دولار.

تداول العملات المشفرة على BYBIT!

Chainlink Halts Slide Above $12.75 But Remains Range-bound 

تحليل طويل المدى Chainlink (LINK): هبوطي
سعر Chainlink (الرابط) has slipped to the bearish trend zone but remains range-bound. The crypto has been recovering from its prior downturn. The altcoin rallied to a high of $22.83 before falling to a low of $11.96. Bulls bought the dips, halting the slide above the $12.75 support. The selling pressure has decreased over the past week and above the current $12.75 support level.

The altcoin is trading in a narrow range between $12.75 and the moving average lines, which serve as resistance at $16. Currently, the rising trend is encountering resistance at the moving average lines. If the LINK price is rejected at the recent high, it will continue to trade below the moving average lines. On the other side, the altcoin will resume a bullish trend if buyers keep the price above the moving average lines. سلسلة ربط will return to the prior high of $22.83.  

Chainlink Halts Slide Above $12.75 But Remains Range-bound
LINK / USD - الرسم البياني اليومي

المؤشرات الفنية:  
مستويات المقاومة الرئيسية - 8.00 دولار ، 10.00 دولار ، 12.00 دولار
مستويات الدعم الرئيسية - 6.00 دولار ، 4.00 دولار ، 2.00 دولار
 
 تحليل مؤشر Chainlink (LINK) 
Given the current price rally, LINK price bars are now above the moving average lines on the 4-hour chart. The altcoin’s surge was short-lived since it was rejected at its peak of $16. Furthermore, it is still limited to the range below the moving average lines.
 
ما هو الاتجاه التالي لـ Chainlink (LINK)؟ 
Chainlink’s price has recovered from its recent fall but remains range-bound. The 4-hour chart shows that it is consolidating above the $12.80 support but below the $16.00 resistance level. The bulls bought declines from the previous low, but they found support at $12.75. The altcoin has surged but failed to break over the $16 resistance level.

The altcoin will be compelled to move in a range below its recent high. In other words, إشارة التشفير will remain range-bound as the altcoin declines and consolidates.  

Chainlink Halts Slide Above $12.75 But Remains Range-bound
الرابط/الدولار الأمريكي – رسم بياني لمدة 4 ساعات


يمكنك شراء Lucky Block من هنا. شراء LBLOCK
 
ملاحظات: Cryptosignals.org ليس مستشارًا ماليًا. قم ببحثك قبل استثمار أموالك في أي أصل مالي أو منتج أو حدث معروض. نحن لسنا مسؤولين عن نتيجة الاستثمار الخاص بك

سوق بيبي (PEPE/USD) يرتفع؛ يعالج الآن المقاومة 0.000008 دولار

The bullish momentum witnessed in late February propelled the market to reach a notable peak at the $0.00001 price level. This surge in bullish activity was robust, contributing to heightened volatility across the market. Despite attempts by bears to capitalize on this volatility, they contended with the prevailing bullish sentiment. Consequently, the market traded sideways within a broad price channel, fluctuating between approximately $0.000001 and $0.0000047.

However, in recent days, following the market’s establishment of support around $0.0000048, the price of the Pepe market has experienced an upward trajectory. Nevertheless, the pertinent question remains: can the bulls sustain this upward momentum in the market?

The Pepe Market Data

  • PEPE/USD Price Now: $0.0000084
  • PEPE/USD Market Cap: $3,354,099,527
  • PEPE/USD Circulating Supply: 420.7 Trillion PEPE
  • PEPE/USD Total Supply: 420.7 Trillion PEPE
  • PEPE/USD CoinMarketCap Ranking: #37

The Pepe Market (PEPE/USD) Soars; Now Tackle Resistance $0.000008

مستويات رئيسية

  • المقاومة: 0.000009 دولار و 0.00001 دولار و 0.000011 دولار.
  • الدعم: 0.0000048 دولار و 0.0000040 دولار و 0.0000038 دولار.

 The Pepe Market Through the Lens of Indicators

Despite the current bullish momentum in the Pepe market outlook, resistance has emerged at the $0.000008 level. This price point has held significant importance since March, with market prices consistently hovering around this threshold. Notably, a pattern of descending peaks has emerged, with notable peaks observed at $0.000010, $0.0000092, and currently approaching the $0.000008 mark. These descending peaks indicate a buildup of bearish momentum, signaling a shift towards a bearish trend. The support level has consequently shifted to $0.0000048.

ينبغي لل Pepe market encounter rejection once again at the $0.000008 price level, it could signify preparation for a sustained bearish trajectory.

The Pepe Market (PEPE/USD) Soars; Now Tackle Resistance $0.000008

PEPE/USD Price Prediction: 4-Hour Chart Analysis 

تحليل السوق من خلال العدسة of the 4-hour chart, it’s evident that bears are exerting notable influence at the $0.000008 price level, as evidenced by the market’s failure to breach this threshold over the past three sessions. Adding to the potential buildup of bearish momentum is the increasing market volatility, as indicated by the expanding Bollinger Bands. Furthermore, the Relative Strength Index (RSI) signals a correction from overbought territory. This confluence of factors suggests a potential for price reversal, as traders may leverage these إشارات التشفير to inform their decision-making processes.

تداول العملات المشفرة على BYBIT!