Dash 2 Trade Price Forecast: D2TUSD Price Pump Imminent above $0.00851 Supply Level (July 15)
The Dash 2 Trade continues to tiptoe above the $0.00711 resistance value, with many market watchers believing brighter days lie ahead. The coin has a potential for a bullish continuation as the coin trades above the supply trend levels approaching the upper resistance point. In case the bulls’ pressure breaks up the resistance level of $0.00851, the coin price may increase further to a $0.1000 high trend line which indeed will be a turnaround for the coin holders.
Key Levels:
Resistance levels: $0.01500, $0.01600, $0.01700
Support levels: $0.00900, $0.00800, $0.00700
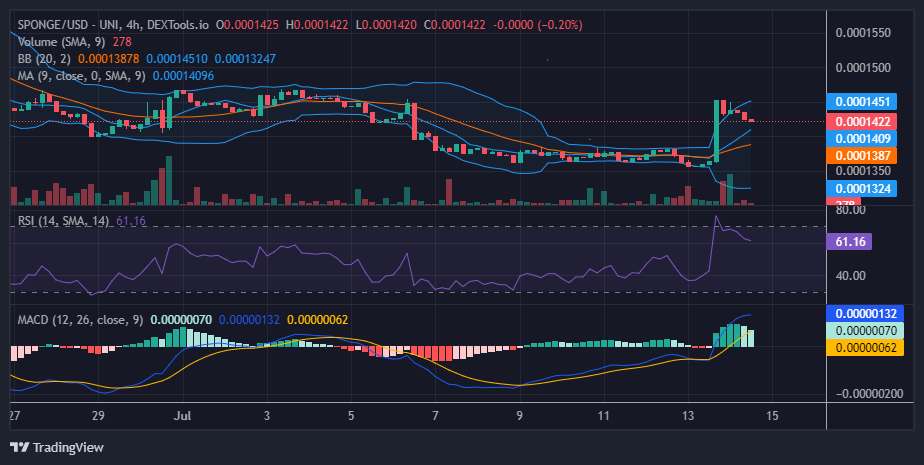
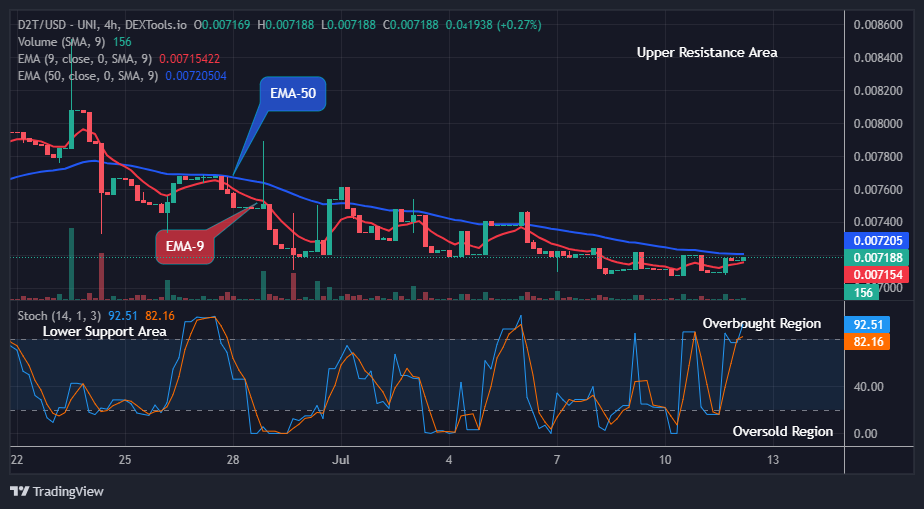
D2T (USD) Long-term Trend: Bullish (4H)
Amidst the rise and fall in the cryptocurrency market, D2TUSD remains bullish on the higher time frames. This is clear as we can see the prices trading above the EMA-9 moving the recovery pattern to the potential upper resistance lines indicating an uptrend.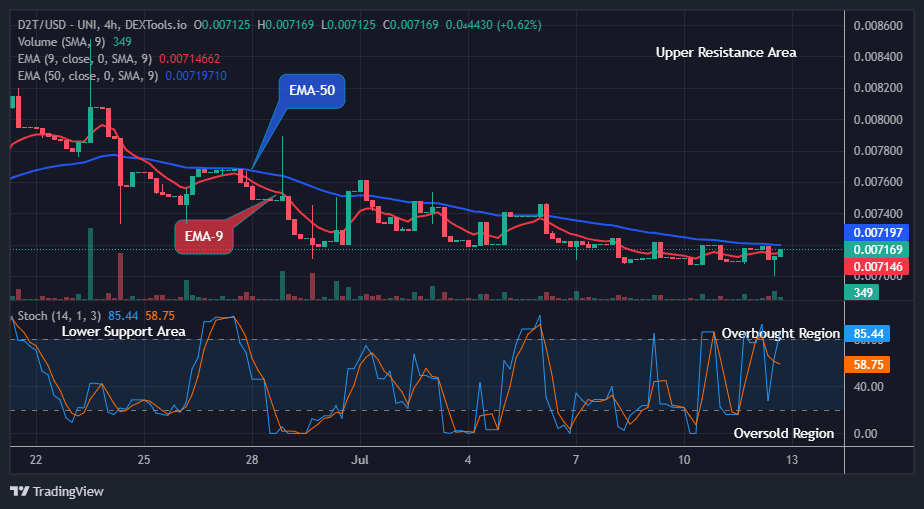
However, the previous action at the $0.00712 high level in the past few days has really sustained the coin price to remain above the trend line in its recent high.
The bulls’ action increases the price up to the $0.00716 resistance level above the EMA-9 even as the 4-hourly session opens today.
Hence, with sustained buying pressure, a breakout above this barrier, with a 4-hourly candle closing could signify a shift in the market dynamics. Such a breakthrough would provide an opportunity for buyers to regain control and potentially drive the price of Dash 2 Trade toward the $0.00851 mark.
Having said that, the momentum indicator shows that the price of D2TUSD will still bounce up, so the price pump above the $0.00851 previous high is imminent, in this case, the price distribution is expected to reach the $0.1000 upper resistance level and beyond in the coming days in its higher time frame.
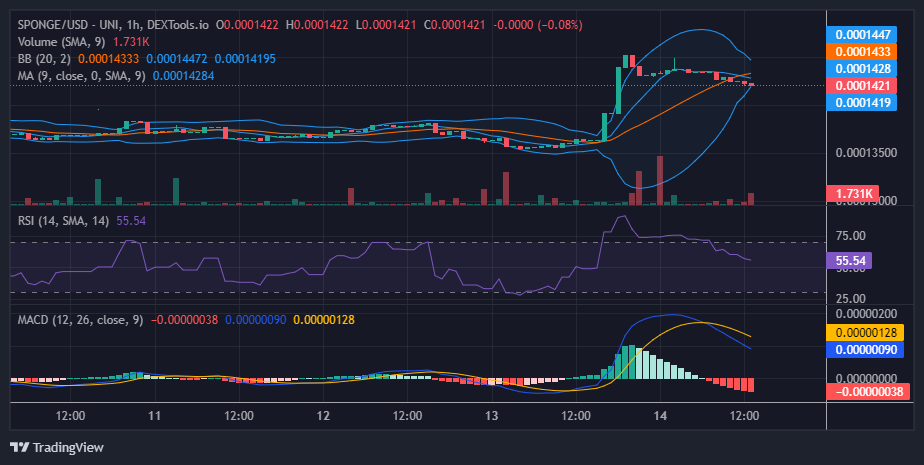
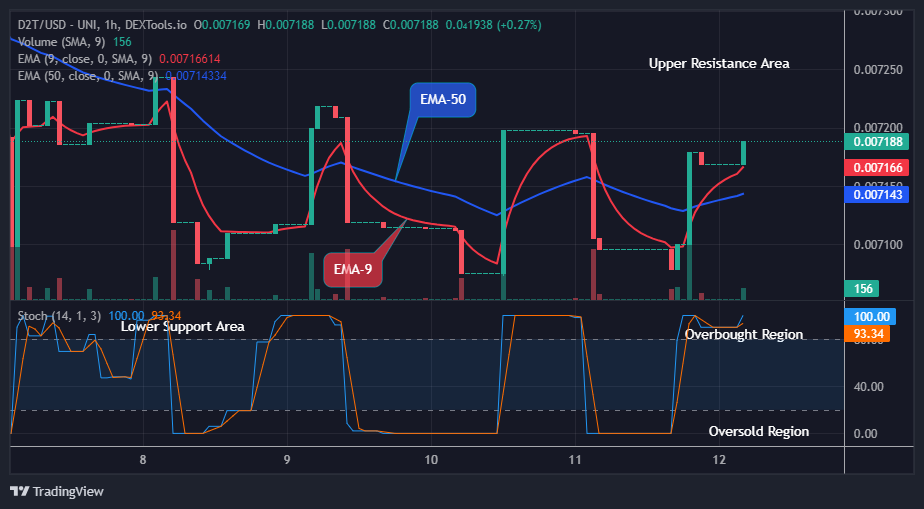
D2T (USD) Medium-term Trend: Bullish (1H)
Despite the interference of short-term traders in the price flow, the medium-term time frame market shows a bullish race. The price of D2TUSD can now be seen progressing upward above the moving averages. This shows that buyers are currently gaining more strength in the market.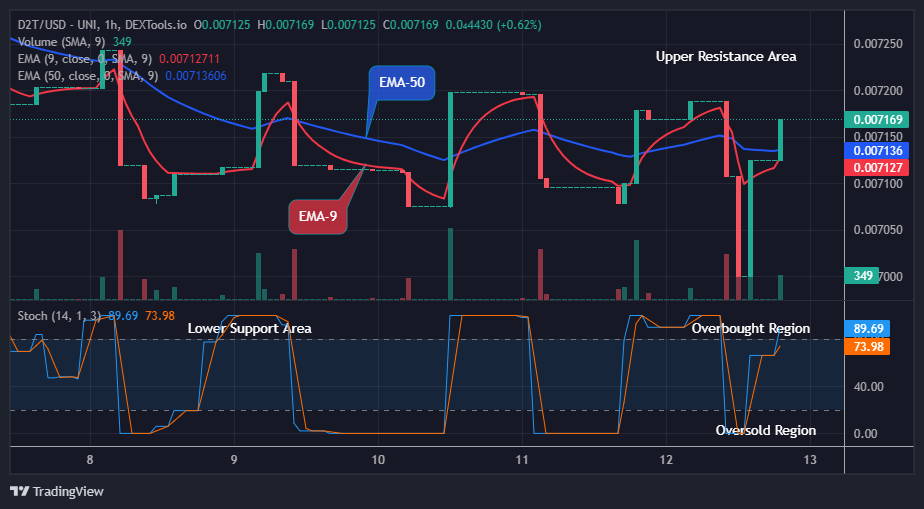
The bulls have sustained the crypto market at the $0.00712 supply value in the previous action, this has made it possible for the coin to stay above the trend line and remain stronger in its recent high.
On the 4-hourly time frame chart, the Dash 2 Trade market showed a noisy recovery under the influence of a rising trend line. Pressure from the bulls pushed the coin price up to the $0.00716 supply value above the moving averages.
This will however give the buy traders the tendency to further ladder up the trend. Thus, to push the price above the supply zone more buyers’ participation is a prerequisite.
If Dash 2 Trade continues to uphold supply, a bullish breakout above $0.00721 to $0.00724 and possibly $0.00851 would be imminent.
However, there is a possibility of a further increase in the price of D2TUSD if the buy traders should increase their price actions and all the current support level holds, a psychologically key level at the $0.1000 upper resistance level might be reached in the day ahead in its medium-term time frame.
Do you know that at D2T you can use the data on the presale dashboard to educate yourself on the most recent coin releases?
Do you know at $D2T you can leverage the information contained on the Presale Dashboard to get yourself up to speed on the current new tokens releases?
— Dash 2 Trade (@dash2_trade) July 11, 2023
Experience the future of crypto trading and give yourself the market edge!🦾✨
#FutureOfTrading #Innovation pic.twitter.com/J23dAgwOLp
Want a coin that has a huge potential for massive returns? That coin is Dash 2 Trade. Buy D2T now.