$SPONGE (SPONGE/USD) Bulls Hold Ground at the Key Support Level at $0.000047

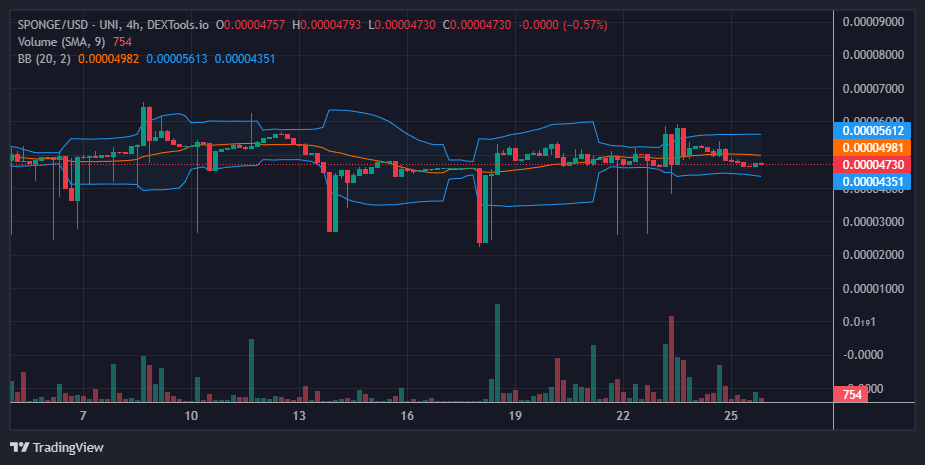
$SPONGE Buyers and sellers have shown equilibrium near the $0.00005 price level. In recent trading sessions, we have observed the emergence of a volatility squeeze, typically preceding a decisive directional price movement. Despite persistent bullish activity maintaining stability around the $0.00005 price threshold in previous sessions, the market experienced a temporary upside breakout, reaching a peak of $0.00006, followed by a subsequent bearish response as demand and supply balanced once more. Presently, substantial selling pressure has led to a consolidation of bullish positions around the $0.000045 price level.

Key Market Dynamics:

  • Resistance Levels: $0.0010, $0.0011, and $0.0012.
  • Support Levels: $0.000035, $0.000030, and $0.000025.

$SPONGE (SPONGE/USD) Bulls Hold Ground at the Key Support Level at $0.000047

Delving into Technical Analysis for $SPONGE (SPONGE/USD):

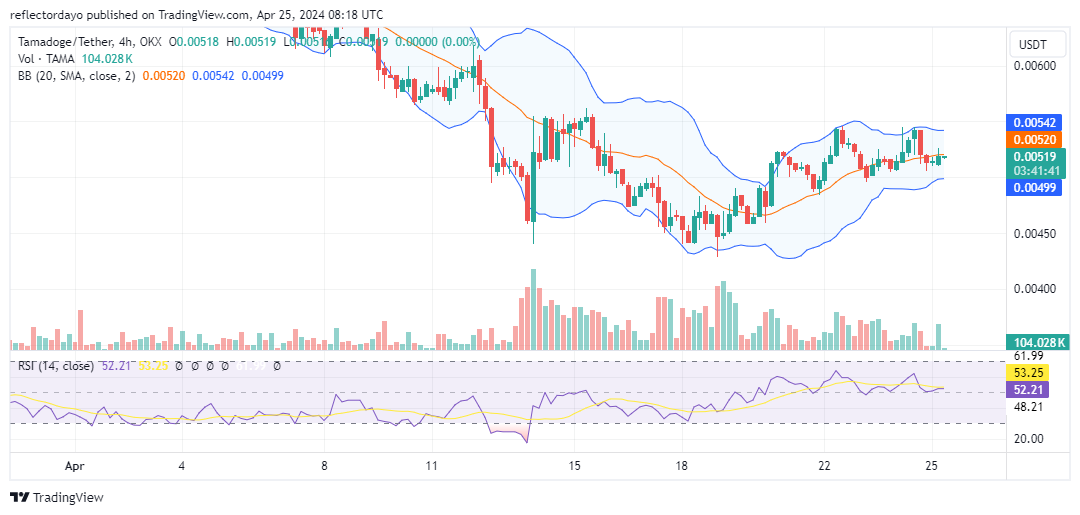
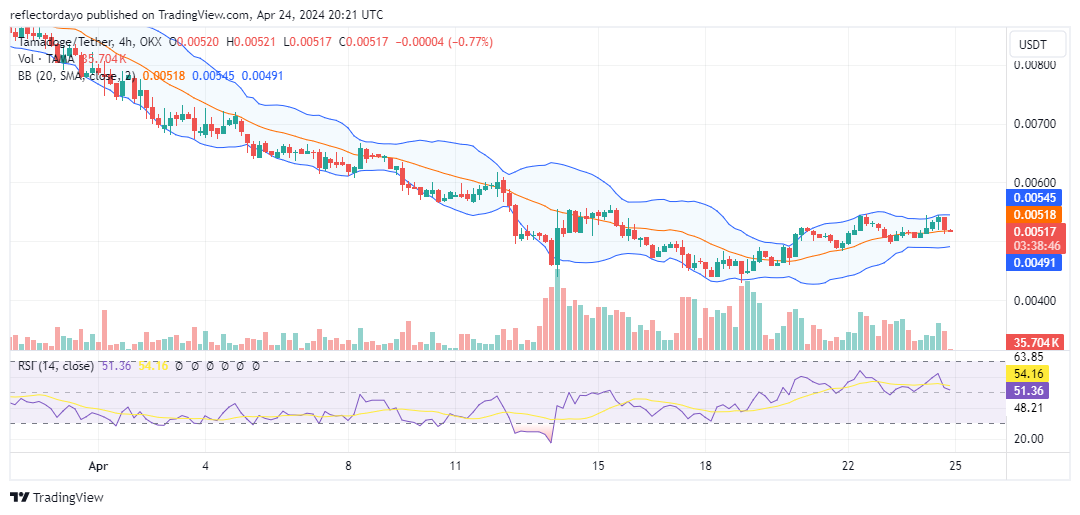
The $0.000047 price level has consistently served as a robust support level since mid-April in the $SPONGE market. Its resilience has been evident, and the crypto signals are indicating that bearish pressures are subsiding around this threshold, possibly leading to the emergence of another volatility squeeze. The recent surge in volatility during the past four-hour trading sessions has resulted in a slight widening of the Bollinger Bands, which is anticipated to contract soon. Following this contraction, there is a likelihood of an upward price rebound, potentially culminating in a breach of the resistance at $0.00006.

$SPONGE (SPONGE/USD) Bulls Hold Ground at the Key Support Level at $0.000047

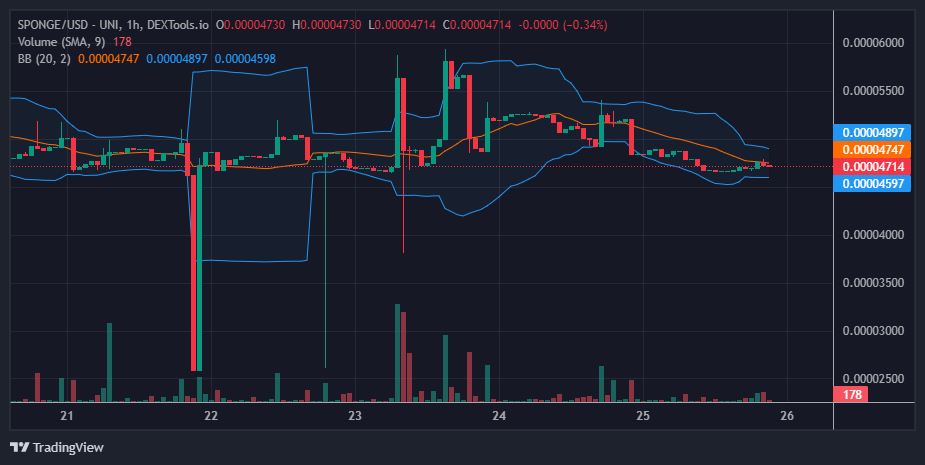
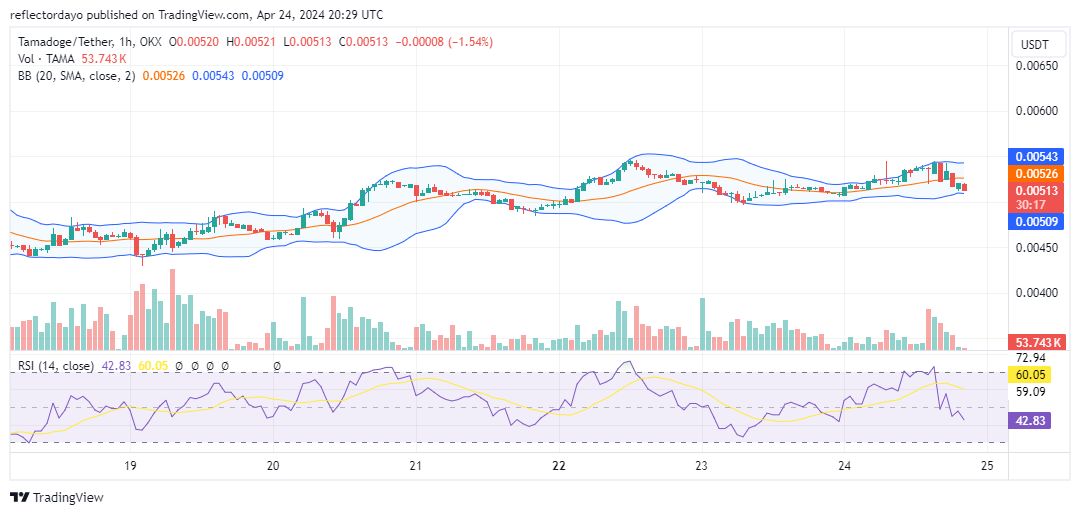
Insights from the 1-Hour Perspective:

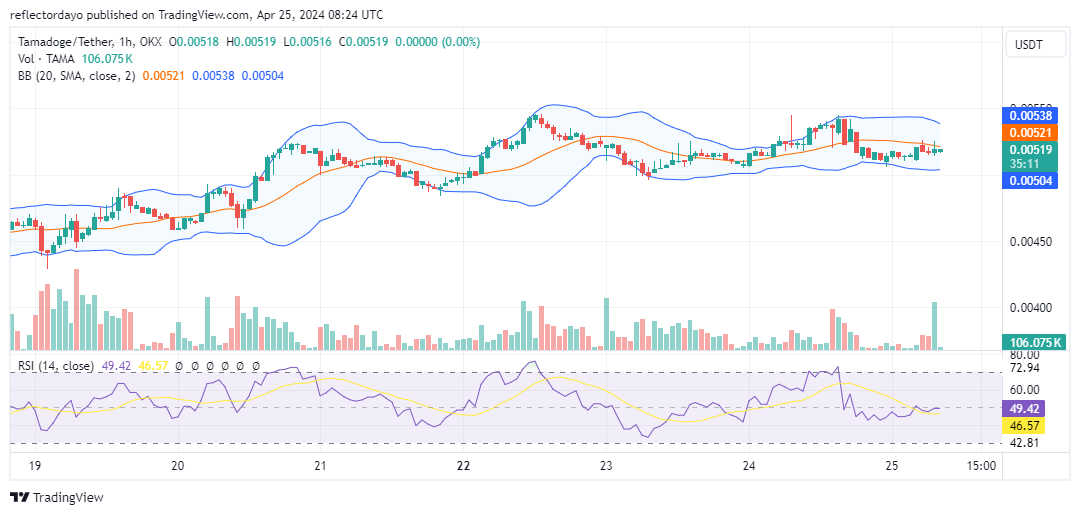
In a focused analysis of the market, it’s apparent that the Bollinger Bands are contracting, indicating a tight bandwidth around the stagnant price action. This volatility squeeze suggests that the market could imminently experience a notable directional movement. Considering this crypto signal, it could be an opportune moment to consider buying, as bullish momentum appears robust at this level, suggesting a potential upward trajectory for the market.

Currently, there are approximately 9,866,820,272 $SPONGE tokens staked, worth over $17.6 million!

Invest in the hottest and best meme coin. Buy Sponge ($SPONGE) today!

Bitcoin ETF Inflows Stall as BlackRock’s IBIT Faces Investor Exodus

BlackRock’s spot bitcoin exchange-traded fund (ETF), known as IBIT, hit a roadblock on Wednesday as it failed to attract any new investor capital for the first time since its launch on January 11. The fund’s unexpected stagnation ended a 71-day streak of inflows, surprising many in the crypto investment community.

Bitcoin ETF Inflows Stall as BlackRock's IBIT Faces Investor Exodus
Image via Farside Investors

In contrast, Fidelity’s FBTC and the ARK 21Shares Bitcoin ETF (ARKB) saw healthy inflows of $5.6 million and $4.2 million, respectively. However, the popular Grayscale Bitcoin Trust (GBTC) experienced significant outflows, losing $130.4 million. This downturn led to a cumulative net outflow of $120.6 million, the highest since April 17 ($165 million).

BlackRock’s Bitcoin ETF Records $15 Billion in Net Inflows

Spot ETFs made their much-anticipated debut in the U.S. on January 11, aiming to attract institutional money and revolutionize the crypto investment landscape. BlackRock’s IBIT, in particular, has been a standout performer, amassing over $15 billion in assets. Collectively, the eleven ETFs have seen a net inflow exceeding $12 billion.

Despite the initial enthusiasm, inflows have slowed considerably this month, with most of the activity occurring in the first quarter. The once-unstoppable Bitcoin bull run now faces headwinds, leaving investors pondering the next phase of the crypto market’s evolution.

Bitcoin Dip Sparks Massive Liquidation

In other news, Bitcoin’s price surged above $66,000 for several days, briefly touching the $67,000 mark earlier this week. However, the cryptocurrency faced a sharp rejection, dashing bulls’ aspirations. Over 83,000 traders with long positions were liquidated, highlighting the market’s volatile nature. The total value of liquidations reached a staggering $225 million on the CoinGlass platform.

Bitcoin ETF Inflows Stall as BlackRock's IBIT Faces Investor Exodus
Image via Coinglass

As the crypto landscape continues to evolve, investors and enthusiasts remain vigilant, closely monitoring developments in ETFs, prices, and market sentiment. With change on the horizon, the crypto community braces for what lies ahead.

When trading the crypto market, it doesn’t have to be “hit or miss.” Safeguard your portfolio with trades that actually yield results, just like our premium crypto signals on Telegram.


Interested in learning how to day trade crypto? Get all the information you need here

Hedera Hashgraph (HBAR/USD) Price Correction: Bulls Aim to Rally at $0.12

In yesterday’s market, we observed a significant surge in bullish momentum that propelled the price of Hedera Hashgraph to an impressive height of $0.18, marking a substantial increase from its previous level around $0.097 before undergoing a correction. Initially, this bullish movement was substantial and characterized by heightened activity. However, such pronounced market movements often trigger equally strong bearish responses as traders seek to capitalize on profit-taking opportunities.

During yesterday’s analysis of Hedera Hashgraph, it was noted that bulls were likely to intervene around the $0.12 price level, aiming to establish a pivotal support zone to sustain the bullish stance at a considerably higher level than before. Nevertheless, the bullish camp encountered significant selling pressure, resulting in the market slipping slightly below the $0.12 mark.

Hedera Hashgraph Market Data

  • HBAR/USD Price Now: $0.114
  • HBAR/USD Market Cap: $4 billion
  • HBAR/USD Circulating Supply: 35.7 billion
  • HBAR/USD Total Supply: 50 billion
  • HBAR/USD CoinMarketCap Ranking: #25

Hedera Hashgraph (HBAR/USD) Price Correction: Bulls Aim to Rally at $0.12

Key Levels

  • Resistance: $0.16, $0.17, and $0.18.
  • Support: $0.10, $0.09, and $0.08.

Hedera Hashgraph Through the Lens of Indicators

As the market approaches the $0.12 price threshold, analysis of yesterday’s daily trading session reveals a notable bounce, indicated by the lower shadow on the candlestick chart. Today’s bearish candlesticks also exhibit lower shadows, signaling the presence of bullish activity around this critical price level. Despite the apparent strength of bearish pressure, stemming from increased volatility sparked by previous bullish sessions, the crypto signals are currently indicating stabilization as bulls appear to be stepping in at $0.12.

Both the Bollinger Bands indicator and the Relative Strength Index (RSI) depict the current market dynamics as a corrective phase following overbought conditions. Additionally, the volume of trade indicator shows a sharp decline in the height of the histogram, suggesting a potential consolidation phase near the $0.12 price level.

Hedera Hashgraph (HBAR/USD) Price Correction: Bulls Aim to Rally at $0.12

HBAR/USD Price Prediction: 4-Hour Chart Analysis 

From a shorter-term perspective, focusing on the 4-hour chart timeframe for Hedera Hashgraph, we observe a pronounced consolidation phase, particularly evident around the $0.114 price point. Supply and demand appear to have reached equilibrium at this level, suggesting a potential stalling of further price fluctuations. The current price of $0.114 may be regarded as the prevailing equilibrium level within the market. Following this period of consolidation, there is a possibility of witnessing a notable directional movement in the market in the near future.

Trade crypto coins on BYBIT!

Cardano Pauses at $0.43 as Bulls Halt the Fall

Cardano (ADA) Price Long-Term Forecast: Bearish
The price of Cardano (ADA) stabilizes after falling to a low of $0.40 as bulls halt the fall. The bulls halted the drop above the $0.43 support and resumed consolidation. In the meantime, the altcoin is trading above the $0.43 support but below the moving average lines or the $0.55 resistance level. Currently, the ADA price has corrected upward but has been repelled by the 21-day SMA.

Cardano is sliding to retest its current support level of $0.43. The altcoin will revert to its previous low of $0.40 if the current support breaks. Otherwise, the price will remain in the $0.43 to $0.55 range. On the upside, if the ADA price rebounds and breaks above the moving average lines, the altcoin will resume its positive trend. The altcoin will return to its prior high of $0.80.

Cardano Pauses at $0.43 as Bulls Halt the Fall
ADA/USD – Daily Chart

Technical Indicators:  
Major supply zones: $1.0, $1.05, $1.10
Major demand zones: $0.25, $0.20, $0.15

Cardano (ADA) Indicator Analysis
The price bars are below the moving average lines, implying a further decrease in the cryptocurrency. The moving average lines are sloping downward with a bearish crossover. The bearish signal has eased as the altcoin consolidates above $0.43.

What Is the Next Move for Cardano (ADA)?
Cardano is now trading inside a range above the $0.43 support level as bulls halt the fall. The price ranges from $0.43 to $0.53. The altcoin is trading modestly due to the presence of Doji candlesticks. Doji candlesticks symbolize traders who are unsure about the direction of the market. Meanwhile, the crypto signal is ranging as the altcoin keeps within a specific range.

Cardano Pauses at $0.43 as Bulls Halt the Fall
ADA/USD – 4 – Hour Chart


You can purchase Lucky Block here. Buy LBLOCK

 Note: Cryptosignals.org is not a financial advisor. Do your research before investing your funds in any financial asset or presented product or event. We are not responsible for your investing results

Tamadoge (TAMA/USD) Charts New Territory After Price Correction: Eyes $0.0054

In preceding analyses, we observed the Tamadoge market initiating upward momentum subsequent to finding support near $0.0045. This trend persists, characterized by a succession of higher lows and the breach of the $0.005 threshold. However, this ascent encountered resistance at $0.0054, resulting in dual rejections, notably during a recent four-hour trading session. In reaction, buyers have established firm support around $0.00511, establishing a pivotal level to potentially steer the market towards the $0.0054 mark once again.

Key Levels

  • Resistance: $0.013, $0.014, and $0.015.
  • Support: $0.0045, $0.0040, and $0.0035.

Tamadoge (TAMA/USD) Charts New Territory After Price Correction: Eyes $0.0054

TAMA/USD Price Analysis: The Indicators’ Point of View

Indicators suggest a potential consolidation phase around the $0.00518 mark. Bollinger Bands shifted from an upward trajectory to a horizontal pattern subsequent to the market’s rejection at the $0.0054 price level, signaling a temporary pause. In our previous analysis, we anticipated traders might establish support at the 20-day moving average, positioned at $0.0052. However, the Tamadoge bulls failed to maintain this level amid bearish pressure, prompting a slight adjustment in support just below this threshold. The Relative Strength Index (RSI) currently hovers slightly above the midpoint, indicating a minor deviation from yesterday’s RSI crypto signal, with bulls making a marginal adjustment of approximately 2 points. Nonetheless, they have yet to exit the equilibrium range.

Tamadoge (TAMA/USD) Charts New Territory After Price Correction: Eyes $0.0054

Tamadoge Short-Term Outlook: 1-Hour Chart

Trading volume is declining as the market seeks support at $0.00518, indicating a potential consolidation phase. A breakout above the critical resistance point of $0.0054 could be on the horizon if bulls gain momentum at this level. However, currently, the bulls appear to encounter resistance nearby, approximately around $0.0052. Should demand persistently match supply at this threshold, trading volume may decrease, potentially resulting in a volatility squeeze and paving the way for a robust bullish price movement.

Buy Tamadoge!

Do you want a coin that will be 100 times more valuable in the next few months? That is Tamadoge. Buy TAMA today!

Chiliz Buyers Trigger More Buys As Price Leaves Discount Zone

CHZUSD Analysis – Chiliz Resumes Bullish Trend

Chiliz buyers trigger more buys as the price leaves the discount zone. The current direction of the price is bullish, as it aligns with the overall market trend. The resumption of the bullish trend follows the bounce off the major trendline, acting as a diagonal support for CHZUSD. The ongoing bullish trend is likely to continue beyond the $0.1680 resistance.

CHZUSD Market Zones

Resistance Zones: $0.1430, $0.1680 
Support Zones: $0.0840, $0.0540

Chiliz Buyers Trigger More Buys As Price Leaves Discount Zone

For about four months, the price of Chiliz ranged between the support at $0.0540 and the previous resistance at $0840. The major bullish trend began after the retraction of the price towards the $0.0540 support. The subsequent influx of buying pressure from the $0.0540 support caused a notable rise in the value of Chiliz. With the price forming higher highs and high lows, CHZUSD became completely dominated by the bulls until price peaked at $0.1680.
 
Until April 2024, the MACD (Moving Average Convergence Divergence) did not make a successful cross below the zero line. This indicates the presence of bears in the market. The current trading range of the market lies between the $0.0700 swing low and the $0.1680 swing high. The ongoing bullish trend seems to be respecting the major trendline, as the price recently bounced off it. After the sell-side liquidity grab at the $0.1130 low, the bulls returned to the market, leading to the resumption of the bullish trend.

Chiliz Buyers Trigger More Buys As Price Leaves Discount Zone

Market Expectation 

Following a tap into the liquidity void, CHZUSD returns downward. The price appears to be heading into the bullish order block in the discount zone. The uptrend is expected to continue afterward until the $0.1630 swing high is invalidated.

You can purchase Lucky Block here.  Buy LBLOCK

Note: Cryptosignals.org is not a financial advisor. Do your research before investing your funds in any financial asset or presented product or event. We are not responsible for your investing results

Dash 2 Trade Price Predictions for Today, April 25: D2TUSD Attempting the Next Big Bounce

Dash 2 Trade Price Forecast: D2TUSD Attempting the Next Big Bounce (April 25)
D2TUSD is now attempting the next major increase following the completion of the fourth Bitcoin Halving last Friday. The coin is set for the next bull cycle and a quick rise is expected to follow soon. The renewed recovery pushed the crypto price to a $0.00361 high mark, suggesting buyers are making a recovery attempt. Hence, amid renewed buying momentum, if the sell traders reduce their tension in the market the coin price might head towards the $0.01000 upper resistance point and beyond, setting the asset for a higher rally.

Key Levels:
Resistance levels: $0.00500, $0.00600, $0.00700
Support levels: $0.00400, $0.00300, $0.00200

D2T (USD) Long-term Trend: Bearish (4H)
The D2TUSD pair is now on its way to the crucial supply level in its long-term outlook. The price bar can be seen slightly below the moving averages and has confirmed its bearishness.
Dash 2 Trade Price Predictions for Today, April 25: D2TUSD Attempting the Next Big Bounce
Activities of the short-term traders to a $0.00356 low level in the previous action have contributed to its bearish momentum lately.

Earlier today, a breakout and the start of a bullish wave to the $0.00361 high level below the supply level with an intraday gain has been noted. Such lower price rejection indicates that buyers are defending this level and attempting to push the Dash 2 Trade price higher. Meanwhile, traders can now buy the token at a lower rate for more gains.

Hence, the coin price could swing up further if additional bearish sentiment is pulled down by the bulls and the price shows sustainability above the $0.00454 high level. This would increase the buying interest of the investors in the crypto.

Notably, the momentum indicator which is pointing up indicates that the price of D2TUSD is in an uptrend and may remain in that direction to hit the $0.01000 supply level and beyond soon in the higher time frame.

D2T (USD) Medium-term Trend: Bullish (1H)
D2TUSD rebounded after its downside moves. The coin is now reaching the overhead resistance level in its medium-term time frame.
Dash 2 Trade Price Predictions for Today, April 25: D2TUSD Attempting the Next Big Bounce
The market shows that the price may now be trading in a new ascending channel as the price now moves steadily above the EMA-9 approaching the overhead resistance.

Action from the bulls on the crypto at the $0.00358 supply value during the past session has made it possible for the coin price to stay above the trend line and remain stronger in its recent high.

The bulls made a corrective rally up to a $0.00361 high level above the moving average shortly after the 1-hourly session opened today. This will enable buyers to influence the price tendency and dominate the market.

Adding to that, the daily stochastic suggests that the price of Dash 2 Trade will continue rising, so we expect the price distribution to reach the $0.01000 supply level and beyond in the coming days in its medium-term outlook.

We’ve added a new feature to your Dash 2 Trade account: two-factor authentication (2FA)!


Want a coin that has a huge potential for massive returns? That coin is Dash 2 Trade. Buy D2T now.

Tamadoge (TAMA/USD) Continues to Soar After Recent Dip

Following a bullish intervention at the $0.0045 price level, the TAMA/USD market has continued its upward trajectory, consistently forming higher lows and surpassing the $0.005 price threshold. Despite breaching this pivotal level, the market has encountered a minor support level above $0.005. However, new concerns have emerged as we observe resistance around the $0.0055 price mark. The TAMA/USD market has experienced rejection from this level on two occasions, with the most recent instance occurring in the current trading session. Consequently, the market is now seeking to establish another higher support level, targeting the 20-day moving average at $0.00518.

Key Levels

  • Resistance: $0.013, $0.014, and $0.015.
  • Support: $0.0045, $0.0040, and $0.0035.

Tamadoge (TAMA) Continues to Soar After Recent Dip

TAMA/USD Price Analysis: The Indicators’ Point of View

The market indicator suggests the potential for consolidation around the $0.00518 price level. Upon examination of the Bollinger Bands indicator, it is evident that the bands have transitioned from an upward trend to a horizontal movement. Additionally, traders appear to be establishing support around the 20-day moving average, indicating a minor deviation from the previous low of $0.00509. The Relative Strength Index (RSI) line has retraced to the midpoint of the indicator, reflecting a balanced market characterized by equilibrium between demand and supply.

Tamadoge (TAMA) Continues to Soar After Recent Dip

Tamadoge Short-Term Outlook: 1-Hour Chart

As the market seeks support at $0.00518, there is a notable decrease in trading volume. This decrease suggests that the market is entering a consolidation phase. Should the bulls establish a strong foothold at this level, it could pave the way for a breakout above the critical resistance point of $0.0054 in due course.

Buy Tamadoge!

Do you want a coin that will be 100 times more valuable in the next few months? That is Tamadoge. Buy TAMA today!

Jupiter Project: A Guide to JUP

Jupiter (JUP) is an advanced swap aggregation engine built on the Solana blockchain. It facilitates essential liquidity infrastructure for the Solana ecosystem and offers a comprehensive suite of DeFi products. Some of the features of Jupiter include Limit Order, DCA/TWAP, Bridge Comparator, and Perpetuals Trading.

The Jupiter token (JUP): Fueling the Fires of the Jupiter DEX

The JUP token is the lifeblood of the Jupiter DEX. Imagine it as the key that unlocks the Jupiter vault, granting holders a say in the platform’s future through voting rights. But the power doesn’t stop there. JUP fosters a thriving community by rewarding members with scheduled airdrops, a welcome rainmaker in the cryptoverse.

There’s a finite number of JUP tokens in existence—10 billion, to be exact. These are meticulously distributed to fuel the core team, strategic reserves, and liquidity, ensuring the smooth operation of the exchange. But worry not, the community isn’t left out. A portion is specifically allocated for those who make Jupiter tick!

Holders become galactic governors, shaping the platform’s destiny through the Jupiter DAO. We shower the community with 4 billion JUP tokens through regular airdrops, a crypto rainmaker that nourishes active users. A portion fuels the core team and strategic reserves, ensuring our longevity and forging powerful partnerships. The best part? JUP empowers community-driven initiatives through DAO-managed grants. JUP’s value isn’t just about utility; it ripples outward, fostering a vibrant community within Jupiter and the wider cryptosphere.

Welcome to the Jupiter Exchange: Your Stellar Cryptocurrency Oasis

Forget the crowded exchanges; Jupiter Exchange is your celestial haven in the vast crypto cosmos. Jupiter offers a universe of features, from comprehensive services to an unparalleled user experience. The platform is said to be a constellation of advantages, setting us light years ahead of the competition.

Holocryptic Defense:

Imagine your assets guarded by celestial sentinels. That’s the power of Jupiter’s cutting-edge holocryptic encryption. Jupiter Exchange erects an impenetrable barrier against cyber threats, keeping your digital treasures safe and sound.

Guardian of Access: Vigilance at its Finest

Multi-factor authentication becomes a multi-layered guardian in Jupiter Exchange. Jupiter employs a phalanx of security measures to repel unauthorized access, ensuring your account remains firmly within your grasp.

Intuitive Exploration: Charting the Course with Ease

Jupiter’s user-friendly interface is your launchpad into the crypto market. Whether you’re a seasoned trader or a curious newcomer, navigating Jupiter Exchange is effortless. It’s like setting sail on a user-friendly spacecraft, allowing you to explore the cosmic market with grace and confidence.

Jupiter Project: A Guide to JUP

Unlock the Celestial Codex: Knowledge is Power

At Jupiter Exchange, powerful charting tools become celestial maps in your hands. Decipher the market’s movements with ease, make informed decisions with confidence, and wield the power of comprehensive analysis at your fingertips.

Diverse Asset Galaxy: A Universe of Opportunities

Jupiter offers a sprawling expanse of cryptocurrencies, creating a vast celestial canvas for your exploration. Trade a diverse array of digital assets, each representing a unique opportunity in the ever-evolving DeFi landscape. Jupiter Exchange is your gateway to a universe of possibilities.

Velocity in Trading: Lightspeed Execution

Jupiter has a lightning-fast trading engine, propelling trades at unimaginable speeds. Experience prompt and seamless execution, letting you navigate the market with unparalleled velocity and reach uncharted territories faster than ever before.

Jupiter (JUP) Market Metric Data

  • JUP/USD Price Now: $1.2
  • JUP/USD Market Cap: $1.6 billion
  • JUP/USD Circulating Supply: 1.4 billion
  • JUP/USD Total Supply: 10 billion
  • JUP/USD CoinMarketCap Ranking: #62

Closing Reflections

In the vast galaxy of cryptocurrency platforms, Jupiter Exchange shines brightly as a paragon of quality. Its unwavering commitment to robust security measures, user-friendly interface, diverse selection of assets, and responsive customer service combine harmoniously, forming a constellation of qualities that positions it as a prime choice for your trading endeavors.

Trade crypto coins on BYBIT!