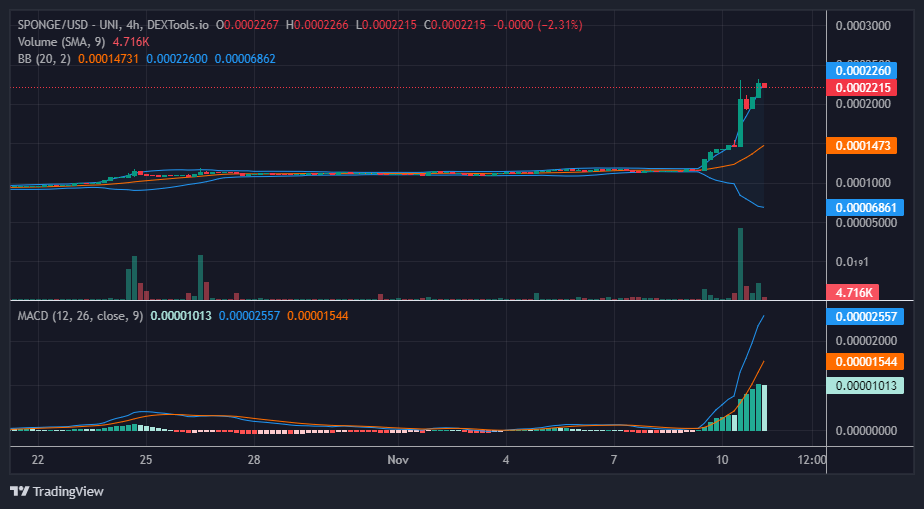
The resilient $SPONGE bullish trend seems to have encountered resistance at the $0.0002318 level. A concentration of sell orders around this threshold appears to be initiating a bearish market dynamic at the $0.0002318 price level. Despite this, the bearish momentum does not exhibit considerable strength, as indicated by the most recent bearish candle on the chart.
Typically, a robust bullish movement of this nature would be anticipated to prompt a significant bearish response; however, the current bear market has not manifested as aggressively as initially expected. The prevailing sentiment remains predominantly bullish. Nevertheless, it is noteworthy that the ongoing market downturn may find potential support at the $0.0002 price level.
The $0.0002 price level is potentially a support level; however, the decrease in trade volume, as evidenced by the diminishing histogram height of the Volume of Trade indicator, suggests that any retracement to the $0.0002 level may unfold gradually. Concurrently, the Bollinger Bands exhibit a wide divergence in the standard deviation curves, indicating heightened volatility. Despite the potential for a strong bearish response, the $SPONGE market continues to signal a high level of volatility, as per the Bollinger Bands.
Should the $0.0002 price level fail to provide support, there is a possibility that the $0.00014 level could act as a supportive barrier to maintain the bullish market stance. This is particularly plausible considering the brief sideways price range observed at the $0.00014 level.
Short-Term Outlook: 1-Hour Chart
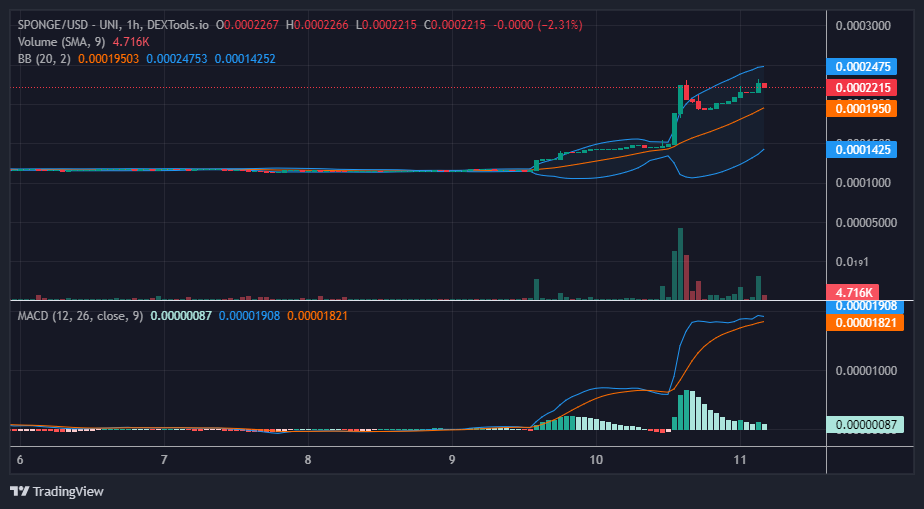
Upon analysis of the 1-hour chart, it is evident that bullish sentiment may still be prevailing in the market. In this shorter time frame, the bulls intervened decisively, mitigating the bearish response to the robust bullish market. Notably, bullish traders entered the market at the $0.0001935 price level, successfully rallying the price back towards the $0.0002318 resistance level.
However, this upward momentum faced resistance at the $0.0002318 level, resulting in the formation of a narrow price channel indicative of a consolidation trend between the $0.0001935 and $0.0002318 price levels. During this consolidation phase, a robust support level is likely to materialize within this price zone, contributing to the overall upward trajectory of the market.
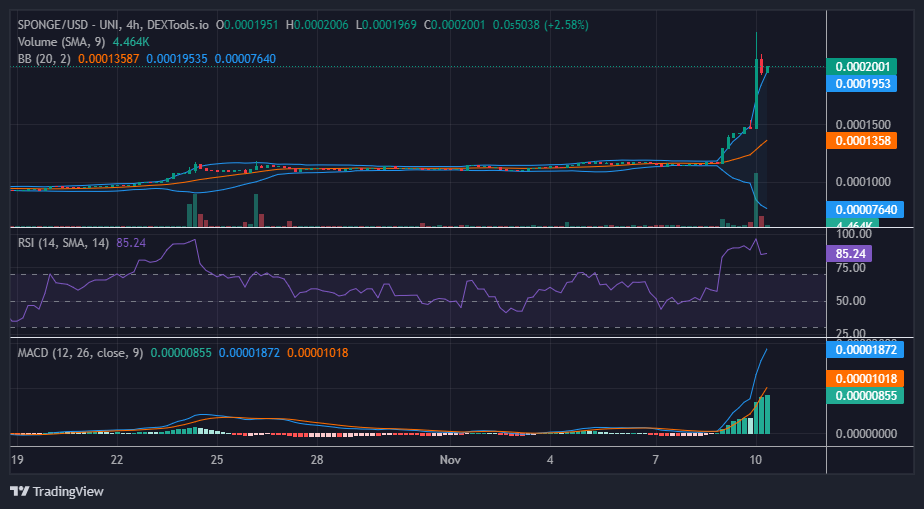
The SPONGE/USD market has exceeded our expectations, defying anticipated bearish sentiment upon entering the $0.00014 price zone. Despite initial concerns, the bull market experienced a substantial surge in liquidity, propelling it to the $0.0002 price level. This robust bullish movement triggered a significant retracement, with the hope that it will not fully negate the progress made by the bulls.
The current bullish price momentum is robust, potentially triggering substantial bearish sentiment. SPONGE/USD bullish traders are actively seeking a support level to serve as a pivot for the bull market, enabling them to establish a higher position and sustain the upward price trend. Analysis of the Bollinger Bands suggests that in the event of a bearish response, the impact could be significant. The ongoing bull run has led to a wide divergence of the Bollinger Bands, indicating a condition of heightened volatility that bears may exploit to undermine the bull market position.
However, an examination of the volume of trade indicator reveals a notable decline in histograms. This decline signals a reduction in volatility, hinting at the possibility of market consolidation at the $0.0002 price level.
Short-Term Outlook: 1-Hour Chart
Upon examination of the 1-hour chart, it is evident that buyers are coalescing around the $0.0002 price level, actively working to mitigate the potential for a sharp decline in the market. The prevailing market sentiment appears to be bullish, suggesting a likelihood of the trend’s continuation. Analysis of the Bollinger Bands indicator reveals a pronounced bandwidth, yet both the two standard deviation curves and the 20-day moving average curve are exhibiting an upward trajectory. This aligns with a bullish market outlook, albeit one characterized by a notably high level of volatility.
Ethereum, the native cryptocurrency of the Ethereum blockchain, experienced a notable surge, reaching a seven-month high on Thursday. This ascent was attributed to the confirmation from BlackRock, the world’s largest asset manager, regarding its plans to launch an exchange-traded fund (ETF) tracking the spot price of Ethereum.
In a filing revealed by Nasdaq, BlackRock outlined its intention to seek regulatory approval from the Securities and Exchange Commission (SEC) for the ETF, which will be listed on the U.S. exchange.
That said, Coinbase, a prominent U.S.-based crypto exchange, is slated to serve as the custodian for the Ethereum held within the ETF, while an undisclosed third party will manage its cash holdings. The strategic market surveillance agreement between BlackRock and Coinbase is considered pivotal in enhancing the ETF’s prospects for SEC approval. As a result of this development, the price of Ethereum surpassed $2,100, marking a 2% increase within 24 hours.
BlackRock’s foray into the cryptocurrency ETF space is indicative of the growing interest in and acceptance of digital assets among institutional investors. The asset manager, overseeing a staggering $9 trillion in assets, previously filed an application for a spot bitcoin ETF in June, pending SEC approval. Despite the SEC’s historical reluctance, industry observers speculate that BlackRock’s substantial reputation and influence could sway the regulatory decision.
If approved, BlackRock’s ETFs could potentially catalyze mainstream adoption of cryptocurrencies. These investment products offer a regulated and convenient avenue for investors to gain exposure to the evolving asset class. The move signifies bullish sentiment in the crypto space, portraying a broader shift towards embracing digital assets on a larger scale.
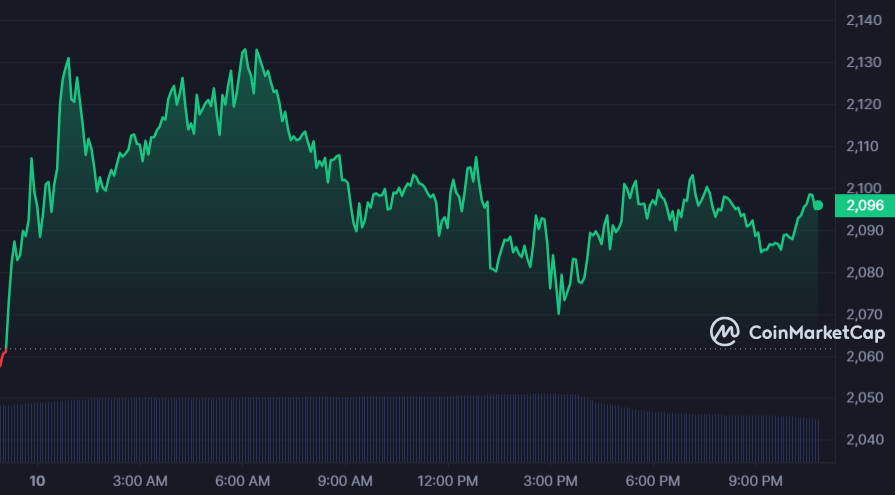
Incoming Pullback for Ethereum?
Source: CoinMarketCap
At the time of writing, Ethereum trades at $2,090, down 1.9% from its intraday peak of $2,136. As we head into the weekend, we can expect to see some bearish pullbacks as the cryptocurrency eases out of overbought conditions.
Interested In Learning How To Use Leverage While Trading? Find Out Here
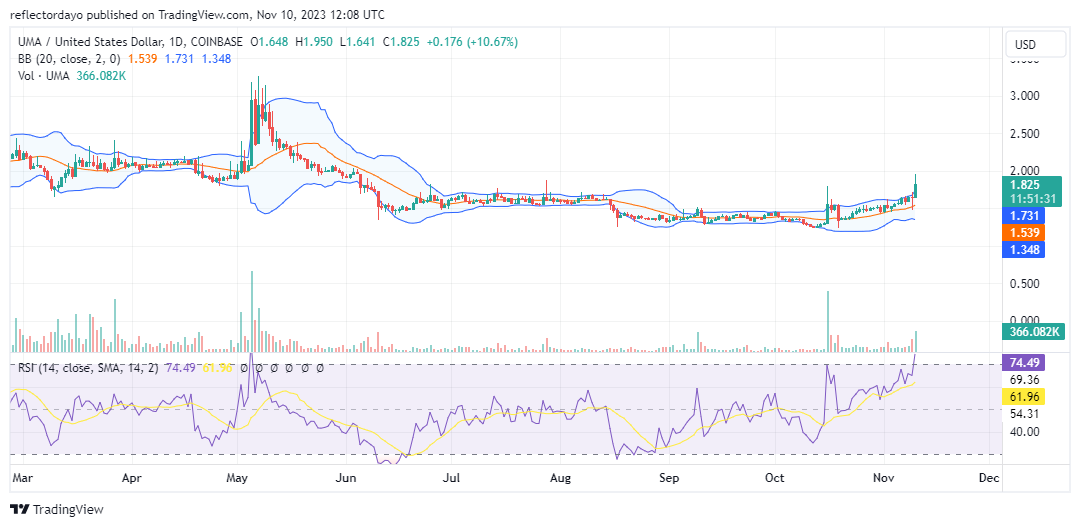
In the initial months of this year, Universal Market Access experienced a dynamic market environment marked by heightened volatility. Price fluctuations occurred within a broad price channel, driven by prevailing bullish sentiment. The momentum from bullish traders propelled the market to achieve a yearly high of $3.249. Subsequently, bearish traders seized the opportunity presented by this peak and the increased volatility to instigate a substantial bearish downturn, causing the price to retreat to the support level observed at the beginning of January.
While expectations suggested a potential rebound from this support level, the market, instead, entered a phase of sideways consolidation for an extended period.
The Universal Market Access Data
UMA/USD Price Now: $0.5913
UMA/USD Market Cap: $135,446,785
UMA/USD Circulating Supply: 74,975,657 UMA
UMA/USD Total Supply: 115,869,045 UMA
UMA/USD CoinMarketCap Ranking: #200
Key Levels
Resistance: $2.00, $2.50, and $3.00.
Support: $1.00, $0.90, and $0.80.
The Universal Market Access Price Forecast: Analyzing the Indicators
The Universal Market Access commenced its bullish trend for the year from the $1.50 price level. As bearish pressure retraced the market to this initial point, traders congregated with optimism, anticipating a renewed rally. Despite their hopes, persistent selling pressure endured for approximately two months, resulting in a consolidation phase.
During this period, the relentless selling pressure compelled a shift in support to $1.28, where consolidation persisted for an additional two months. In the latter half of October, a surge in trading volume catalyzed a notable upward movement in prices. This positive development is reflected in the Relative Strength Index (RSI), which exhibits rapid oscillations with a trend of higher lows, signifying an increasing momentum.
Nevertheless, caution is warranted as the market may encounter formidable bearish resistance, particularly around the $2.00 price level.
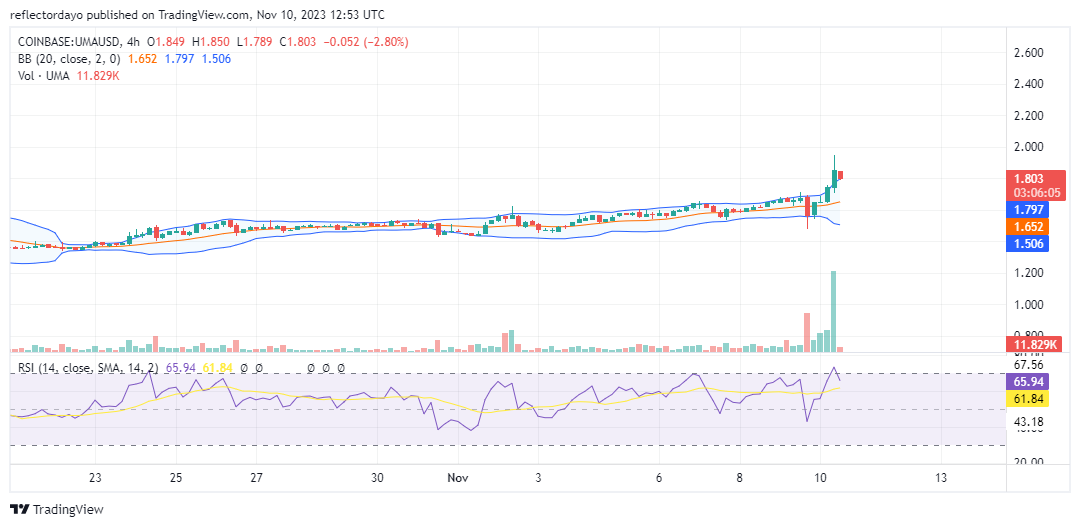
UMA/USD 4-Hour Chart Outlook
As the market approaches the $2.00 price level, traders have initiated profit-taking, leading to a retracement in price. Additionally, a thorough analysis of the Relative Strength Index (RSI) on the 4-hour chart indicates that the recent price recovery coincides with the market entering overbought territory as it approaches a critical resistance level. This overbought condition has contributed to a bearish sentiment, prompting the price to retract.
It is noteworthy that the $1.80 price level is anticipated to serve as a potential support level, playing a crucial role in sustaining the market’s momentum.
The concept of the 52-week high/low reflects the peak and bottom stock values observed within a year-long period. The 52-week High signifies a stock’s highest price achieved over the previous year, whereas the 52-week Low represents its lowest price during that period. Traders and investors often leverage this measure to assess a stock’s performance across extended timeframes.
How to Obtain the 52-Week High/Low
Deriving the 52-week high/low involves a straightforward process: observing a stock’s highest and lowest prices within the last year. This entails tracking the stock’s price movements by monitoring daily closing prices, enabling the identification of both the highest and lowest prices witnessed over 52 weeks. This process can be facilitated through various tools like spreadsheets or dedicated tracking software, enabling investors to conveniently scrutinize a stock’s price fluctuations.
Beyond monitoring the peak and trough prices, investors often account for additional elements when computing the 52-week high/low. Considering factors beyond solely the price includes evaluating any dividends or distributions dispensed by the stock in the preceding year. This broader assessment is crucial, as these payouts can significantly influence the stock’s comprehensive performance analysis.
The Usefulness of 52-Week High/Low in Investment Analysis
The 52-week high/low holds significance as it offers investors a broader view of a stock’s performance over an extended period. In contrast to metrics confined to shorter time frames, the 52-week high/low encompasses a stock’s performance throughout the past year. This comprehensive view contributes to a more accurate assessment of the stock’s overall performance, aiding investors in making more insightful investment choices.
Investors closely monitor the 52-week high/low for various purposes, primarily to detect stocks exhibiting upward or downward trends. When a stock achieves its recent 52-week High, it signals a period of strong performance that might persist. Conversely, a recent attainment of the 52-week Low by a stock indicates underperformance, potentially persisting in the near term.
Advantages and Limitations of Employing a 52-Week High/Low as an Indicator
Employing the 52-week high/low as an indicator offers benefits by providing investors with an extensive view of a stock’s performance, aiding in trend identification and informed investment decisions.
Additionally, this approach helps recognize overvalued or undervalued stocks, assisting investors in spotting potential opportunities. However, a downside to relying solely on the 52-week high/low is its potential limitation in accurately predicting short-term price movements.
Utilizing 52-Week High/Low to Assess Stocks
Investors leverage the 52-week high/low in diverse ways, primarily by identifying stocks that have recently hit their 52-week High or Low. If a stock has recently achieved its 52-week High, investors may contemplate purchasing it, anticipating continued positive performance.
When a stock recently hits its 52-week Low, investors might contemplate selling it or avoiding it altogether due to its potential for continued underperformance. Beyond spotting stocks reaching their 52-week High or Low, investors also utilize the 52-week high/low to gauge a stock’s current price against its historical performance.
Influential Factors Impacting a Stock’s 52-Week High/Low
Several factors play a role in shaping a stock’s 52-week high/low. A primary factor includes the company’s financial performance. Strong financial performance may prompt an increase in a company’s stock price, leading to a higher 52-week High. Conversely, poor financial performance might result in a decline in the stock price, leading to a lower 52-week Low. Various external elements play a role in shaping a stock’s 52-week high/low. For instance, shifts in the overall market dynamics or alterations in interest rates have the potential to affect a stock’s value, influencing its 52-week high/low.
News-related occurrences, such as mergers, leadership changes, or significant acquisitions, can also impact a stock’s value, ultimately influencing its 52-week high/low.
Leveraging 52-Week High/Low with Other Metrics
To address certain limitations of the 52-week high/low approach, investors might combine it with other metrics. For instance, investors may analyze a stock’s price-to-earnings (P/E) ratio or dividend yield in conjunction with its 52-week high/low assessment for a more comprehensive understanding.
In Conclusion
The 52-week high/low metric provides investors with a comprehensive view of a stock’s long-term performance, serving as a crucial tool in trend identification and guiding well-informed investment choices. Although the 52-week high/low approach possesses certain constraints, integrating it with other metrics can offer a more nuanced understanding of a stock’s performance and potentially enhance decision-making.
Navigating the complexities of the stock market and making wise decisions to meet financial objectives can be a daunting task. For those feeling overwhelmed by the investment process, engaging a specialized financial advisor in wealth management can be beneficial.
Seeking assistance from a financial advisor who specializes in wealth management services can aid in confidently navigating the market. Leveraging their expertise and experience, financial advisors can assist in making informed investment choices and structuring a tailored investment strategy aligned with individual financial aspirations.
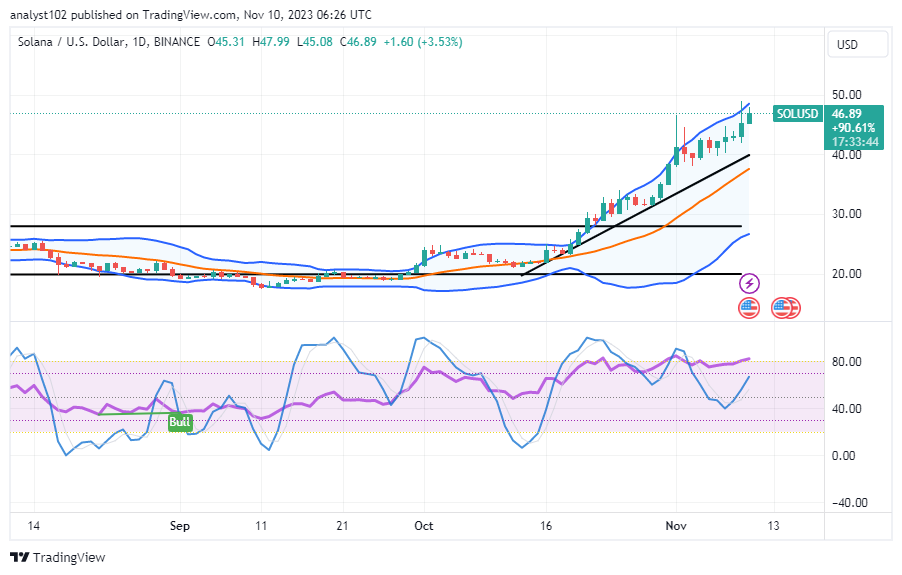
Solana Price Prediction – November 10 In the process of prolonging the degrees of valuation appreciation in the SOL/USD trade, as the financial record now has it, the crypto-economic market widens, attempting sustainability.
At $46.89, bulls are clearly outpacing bears in the market, maintaining a positive percentage rate of 3.53. If the rising pressure continues, a decline from the current trading position shouldn’t be taken too seriously, even if it means a further decline against the $40 support zone. Investors ought to continue expanding their holdings.
SOL/USD – Daily Chart The SOL/USD daily chart reveals that the crypto-economic market widens through the pathway of the upper Bollinger Band trend line, attempting sustainability.
The stochastic oscillators have been maintaining a consolidation moving pattern from 40 points and above to affirm that buyers are in top shape in the market. The Bollinger band trend lines have bent northbound to showcase that sellers are on the path of losing. The formation of different types of candlesticks has been bullishly featured. What circumstances could turn the SOL/USD market operation’s present favorable trend around? There has been a systemically upward running of forces in the SOL/USD market operations alongside the upper Bollinger Band, given that the crypto market widens toward the point of $50, attempting sustainability.
new intentions Even while the price is still pushing values through the overhead resistances over $50, long-position placers should use caution to avoid overleveraging their position orders. Before initiating positional entries, traders should become familiar with active price movement.
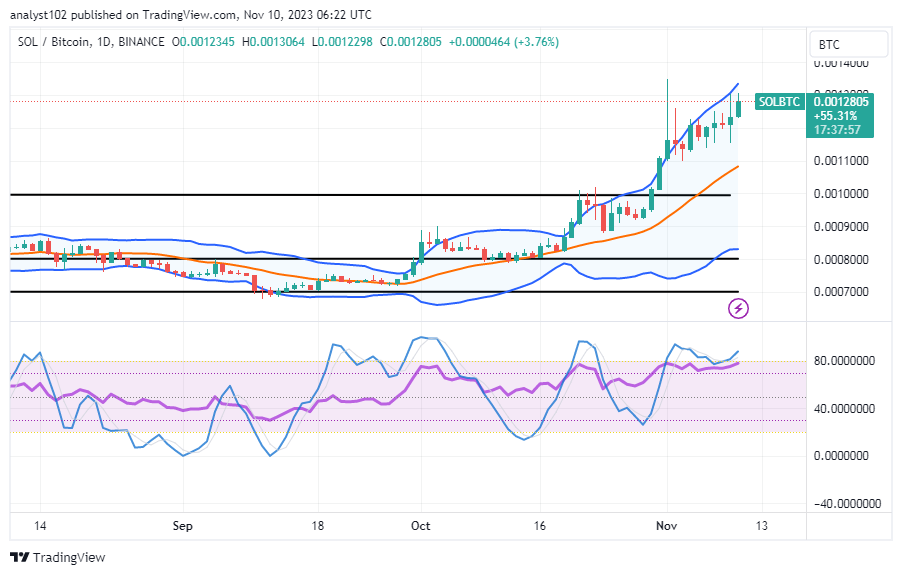
Given the present pace of northward pushing velocity, short-position placers should exercise caution when executing orders, as no good confirmation trade pattern has emerged to trigger an immediate shorting order. Sellers may place a sell limit order for a duration between $55 and $60, depending on the time, with a reasonable stop-loss order placed a little bit above the higher value. SOL/BTC Price Analysis In contrast, the Solana market widens points against Bitcoin, attempting sustainability as it pushes alongside the upper Bollinger Band trend line.
The Bollinger Bands’ indicators have diverged to the north, indicating that buyers are feeling in control. A series of andlesticks that have been featured show that the base cryptocurrency economy has been growing relative to the counter cryptocurrency, and stochastic oscillators are consolidating at higher ranges.
Note:Cryptosignals.org is not a financial advisor. Do your research before investing your funds in any financial asset or presented product or event. We are not responsible for your investing results.
Enjin Coin buyers lose momentum, thereby giving sellers a chance to penetrate. This week, Enjin Coin’s buyers faced a setback as the bears took control of the market. Their attempt to push the price higher was halted, with a notable resistance at the $0.337600 level.
This key level hasn’t been tested since July of this year, and back then, the bulls had also lost their momentum. Sellers saw an opportunity and drove the market lower.
Enjin Coin Market Levels
Resistance Levels: $0.337600, $0.288100 Support Levels: $0.242700, $0.204000
Buyer interest had been steadily building since the middle of October, with the bulls putting in significant effort from the $0.204000 level. However, their progress came to a halt at the $0.337600 key level. If the buyers can’t regain their strength, we might see more selling pressure on the Enjin coin. This will potentially push the price back down to the $0.288100 key zone.
The bullish momentum has declined, evident from the weakening strength of the momentum indicator. The Money Flow Index, which is currently around the 80.00 level, implies that the market is in overbought territory. This could mean that buyers have pushed the price to an unsustainable level, and a correction or pullback might be in store.
Market Expectation
In the shorter time frame, the buyers are struggling to regain control while the sellers maintain dominance. It is expected that buyers will make an effort to challenge the sellers. However, for now, sellers are focused on the $0.288100 price level, ready to defend their position.
Note:Cryptosignals.org is not a financial advisor. Do your research before investing your funds in any financial asset or presented product or event. We are not responsible for your investing results.
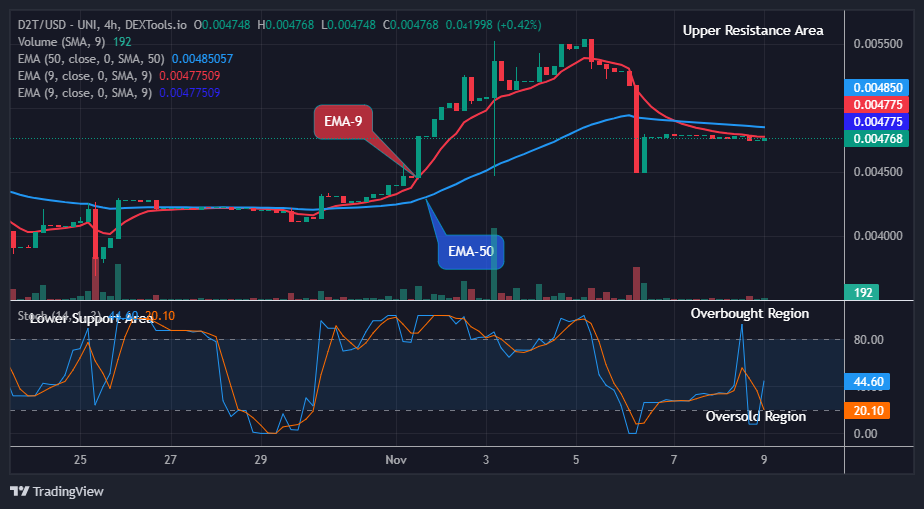
Dash 2 Trade Price Forecast: D2TUSD Price Aims to Breach the $0.00553 Resistance Level (November 10) Dash 2 Trade market is growing again, the coin is now making its way towards the overhead resistance trend levels at the moment. The coin price is likely to grow further and also aims to breach the $0.00553 resistance level if the current support at $0.00474 value holds. Hence, with strong buying pressure and positive market sentiment, the coin price could increase and extend to a $0.01000 upper resistance value and beyond resulting in an intraday gain for the coin traders.
D2T (USD) Long-term Trend: Bearish (4H) In the long-term outlook, the D2TUSD pair trades in a bearish trend due to low bullish momentum. One can observe that the price bar is trading below both moving averages. This is due to the high impact of short-term traders on the price flow. However, the bulls are now set to increase the trend and may likely breach the 0.00553 resistance mark soon. The bearish pressure at the $0.00474 support level in the past few hours has made the coin stay below the supply trend levels in its recent price level.
As new buying appears close to the supply level after the recent correction, the coin is beginning to recover. After making its correction, the altcoin is now poised for growth.
Shortly after the opening of the 4-hour chart for today, the bulls decided to turn the trend upward after a string of lows.
With the positive sentiment, the Dash 2 Trade price rallied up to the $0.00476 resistance value below the moving averages as a pullback and breached the $0.00474 barrier as the 4-hour chart opens today.
Thus, a bullish breakout past the $0.00549 high mark may set eyes on the next resistance level at $0.00553; this will bolster more buying pressure on the crypto to the upper resistance levels.
Notably, the market is now pointing up on the daily stochastic. This means that the bulls may continue with the rally at this crucial moment.
Hence, the bulls are expected to turn around the price of D2TUSD and this might breach the $0.00553 previous high and extend to a $0.01000 high value in the nearby days amidst a market surge in its higher time frame.
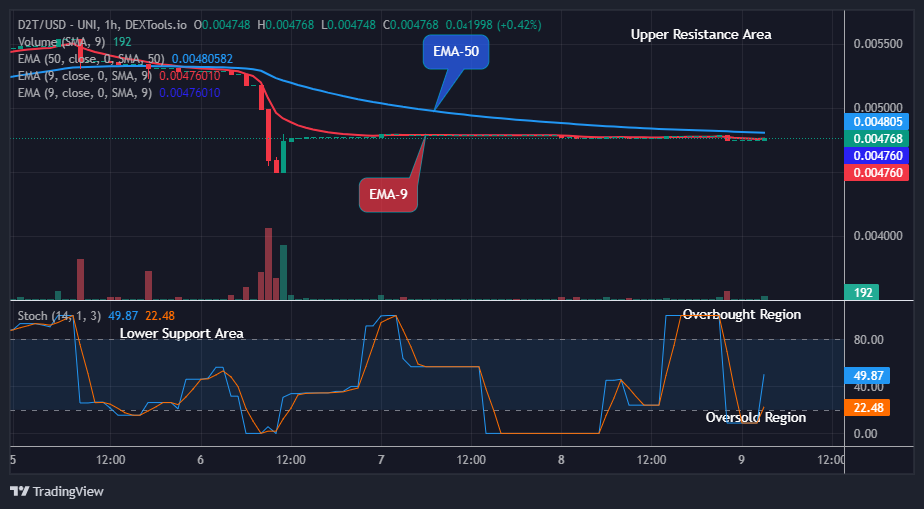
D2T (USD) Medium-term Trend: Bullish (1H) Analyzing the chart above, we can clearly see that D2TUSD is in a bullish market zone. The price is trading slightly above the EMA-9. This indicates an uptrend for the coin. The pair made it to the $0.00474 resistance level during the previous action and has sustained the coin price above the supply trend lines in its recent high.
Right now, Dash 2 Trade is trading above the EMA-9 at the $0.00476 supply level. Considering the strength of the market, this is a sign of upward momentum.
Therefore, a potential breakout from the neckline of $0.00518 will strengthen the buying momentum and drive prices higher, approaching the previous resistance levels of 0.00553.
Meanwhile, the pair has a target price of $0.01000 supply level amidst the market surge as it continues its uptrend movement to the upper resistance as indicated by the daily stochastic pointing upwards. Hence, the mentioned target might be reached in the coming days from a medium-term perspective.
Smart Money Insights: Even though the price action hasn’t been as volatile as it was a few weeks ago, the general sentiment is still positive after another week. In the last two months, we have seen a nearly 40% increase in Bitcoin with little regression.
🚀 Smart Money Insights📊
Another week has passed, and the overall sentiment remains high, even though the price action hasn't been as explosive as a few weeks ago. We're almost 40% up on Bitcoin over the past two months, with minimal retracement.
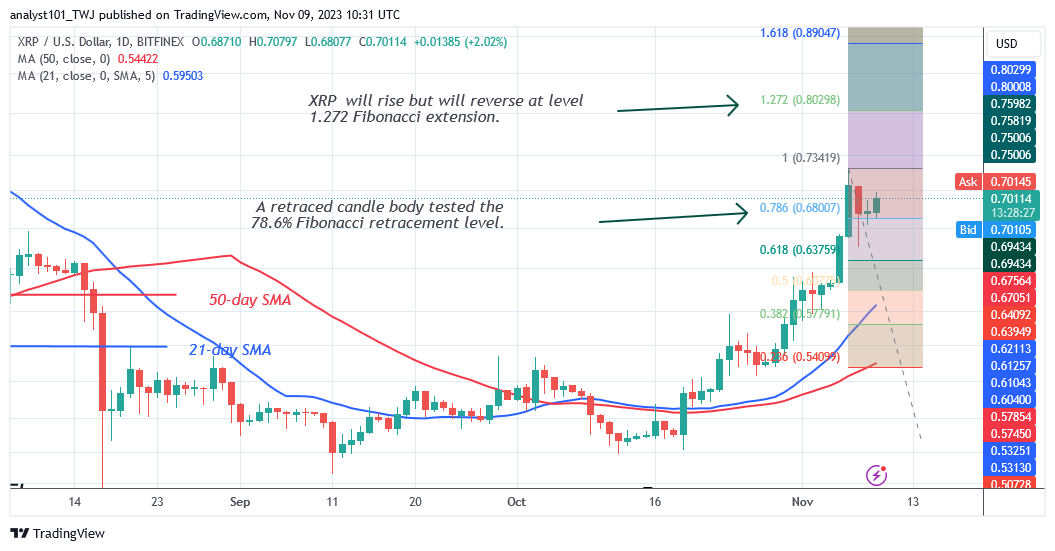
XRP (XRP) Long-Term Analysis: Bullish XRP’s (XRP) price has risen impressively but is stuck in a range. On November 6, the bulls were repulsed at the $0.74 resistance level. The cryptocurrency asset has retraced to a low of $0.65 and is now moving sideways below the resistance zone. The cryptocurrency asset is currently trading at $0.69 at the time of writing.
On the plus side, the price indicator indicates that the crypto will continue to rise. Meanwhile, a retraced candle body tested the 78.6% Fibonacci retracement line on November 6. The retracement suggests that XRP/USD would increase but then reverse at the 1.272 Fibonacci extension or $0.80 level.
On the downside, if buyers fail to break through the current high, the altcoin will oscillate between $0.65 and $0.74.
XRP/USD – Daily Chart
Technical Indicators: Major Resistance Levels – $1.00, $1.50, $2.00 Major Support Levels – $0.50, $0.30, $0.10
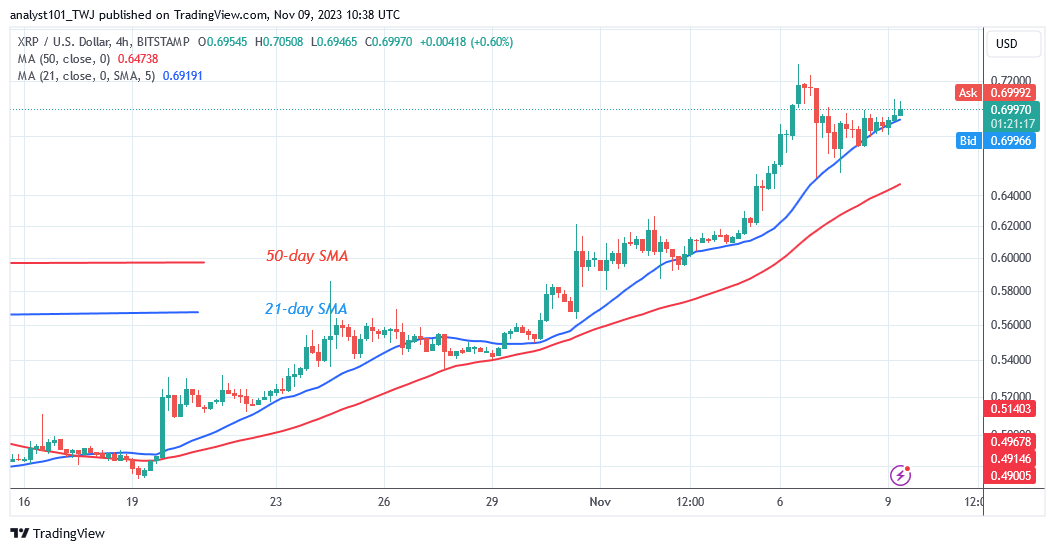
XRP (XRP) Indicator Analysis On the 4-hour chart, XRP has retraced and broken below the 21-day SMA but above the 50-day SMA. The crypto asset will be compelled to move in a range for a few days. However, if the bears break below the moving average lines, the decline will resume.
What Is the Next Direction for XRP (XRP)? The crypto asset is facing rejection at $0.73 but is stuck in a range. $0.73. The altcoin is now trading between $0.65 and $0.74. The uptrend will resume until the resistance level of $0.74 is breached. XRP will fall to $0.58 if the $0.65 support level is breached. Meanwhile, XRP is still trading in a bullish trend zone.
Note: Cryptosignals.org is not a financial advisor. Do your research before investing your funds in any financial asset or presented product or event. We are not responsible for your investing results