Bitcoin (BTC/USD) Market Waves in Falls, Finding Supports

Bitcoin Price Prediction – August 23
A chain of price actions that followed a significant decline recently in the business activities of Bitcoin paired with the valuation of the US economy has led to an outlook that signifies that the crypto market currently waves in falls imputed that are leftover, finding supports even in the process toward the line of $25,000.

After noticing that supporting trade area, several impulse indications are still active, showing no discernible revival of gains over the course of a few days since the bears’ influence started to take effect. As things stand, it appears that a line of downward consolidation movements will continue above or near the value described in the previous paragraph for some time. However, we advise traders to watch for any signals of a northward spring before placing a purchase order.

BTC/USD Market
Key Levels:
Resistance levels: $28,000, $29,000, $30,000
Support levels: $25,000, $24,000, $23,000

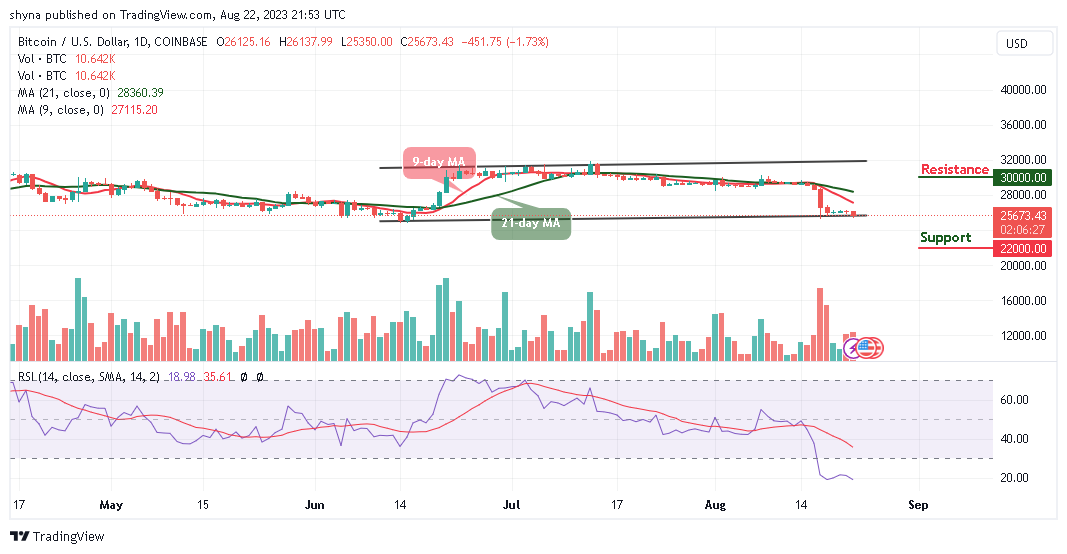
BTC/USD – Daily Chart
The BTC/USD daily chart reveals that the crypto-economic market waves in a falling manner, finding supports and averaging the psychological line of $25,000 underneath the lines of the moving averages.

The 14-day SMA indicator has curved southward in an attempt to break the 50-day SMA indicator to the downside. And they are closely positioned over the resistance line of $28,000. The stochastic oscillators are in the oversold region, featuring in a conjoint style to affirm a consolidation movement.
Bitcoin (BTC/USD) Market Waves in Falls, Finding Supports
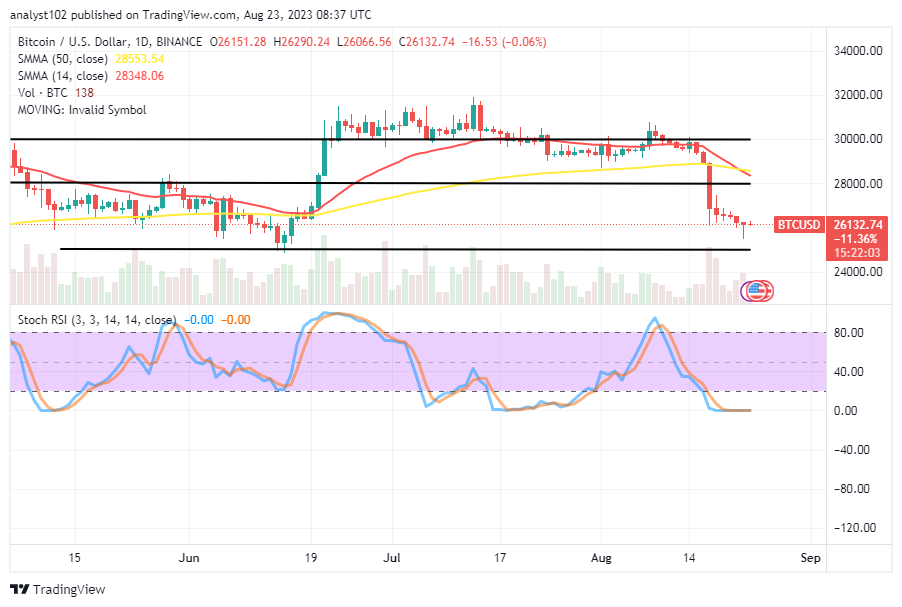
What is the BTC/USD market’s maximum bearish touching point before the bulls’ regaining catalyst?
The last abrupt free drop in the valuation of the BTC/USD trade witnessed a lower trading point of around $25,500, given that the crypto economy now waves in falls characterized by traits of leftover, finding supports as well in the course.

A trade recuperation process has to begin below the trend lines of the moving averages, using points around $25,000 as a yardstick to observe the area of baseline formation. Therefore, long-position pushers are expected to start making a comeback ahead of the next volatile operation.

Even though the price will still decline as a result of a negative consolidation motion that is anticipated to last for a while in the market, selling position orders may be getting entries at a greater risk. However, a rapid rally could be seen with a strong push to the south through positions at or below the $25,000 level.
Bitcoin (BTC/USD) Market Waves in Falls, Finding Supports
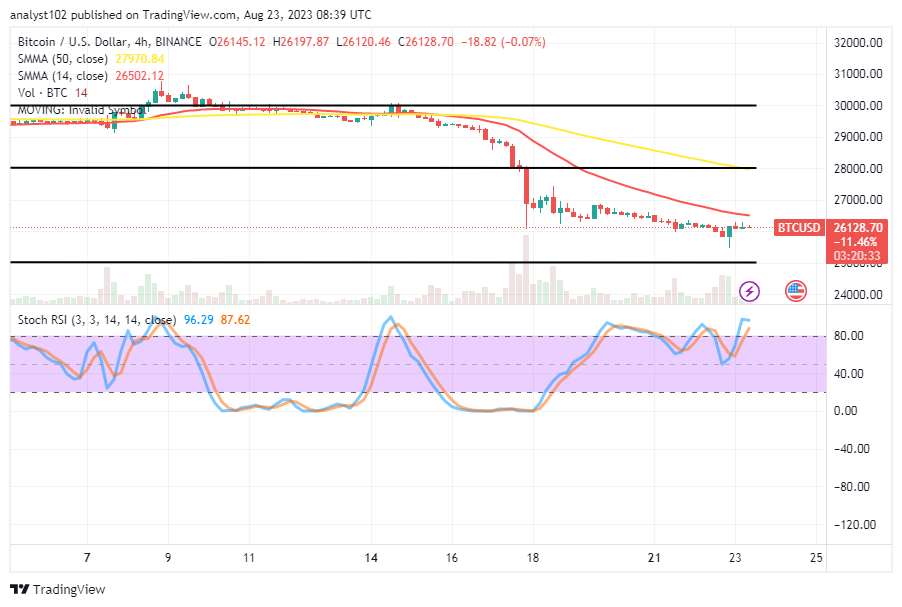
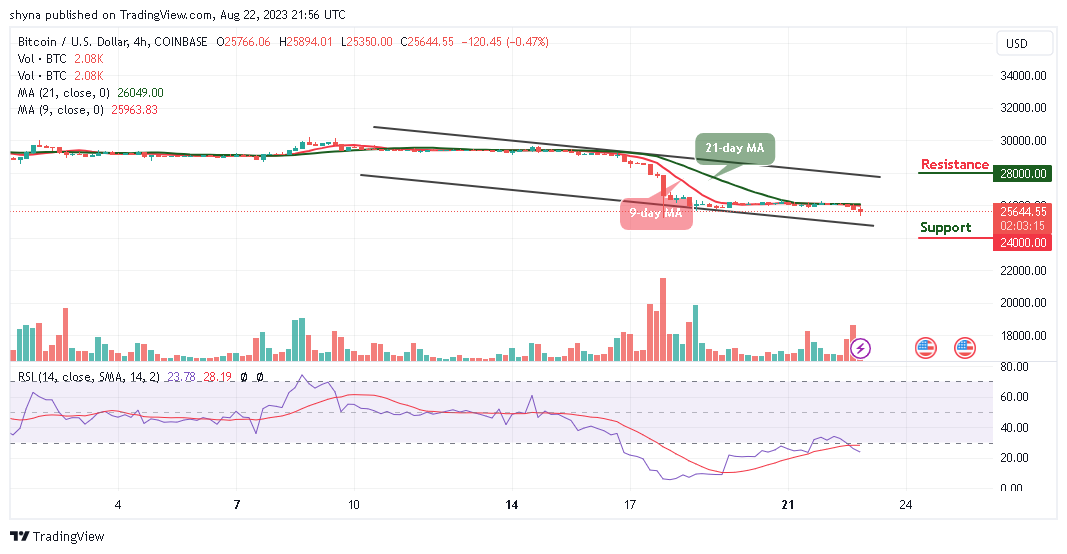
BTC/USD 4-hour Chart
The BTC/USD 4-hour chart showcases the crypto-economic market waves as they fall underneath the trend lines of the SMAs, finding supports.

The 50-day SMA indication is at $27,970.84, and the 14-day SMA indicator is at $26,502.12. The overbought region is where the stochastic oscillators are. Right now, the transaction outlook, which is based on the medium-term myth, predicts that, before the northward push resumes, it’s possible to observe decimations in lower forms.

Note: Cryptosignals.org is not a financial advisor. Do your research before investing your funds in any financial asset or presented product or event. We are not responsible for your investing results.

You can purchase Lucky Block here. Buy LBLOCK

Sponge/USD ($Sponge) Bulls Build Momentum Towards a Significant Price Surge

Over the past day, the SPONGE/USD market has exhibited little change, resulting in a continued state of stagnation. This has led to a narrow price range between $0.0001050 and $0.0001063, indicating a lack of decisive movement in either direction.

Since yesterday, the market has experienced a lack of significant price movements. The price has remained stagnant within a confined range of $0.0001050 and $0.0001063. This consolidation suggests a period of uncertainty and indecision among traders, as neither bears nor bulls have managed to gain a strong foothold.

Key Levels

  • Resistance: $0.0004, $0.0045, and $0.0005.
  • Support: $0.00011, $0.00010, and $0.00009.

Sponge/USD ($Sponge) Bulls Build Momentum Towards a Significant Price Surge

Sponge (SPONGE/USD) Price Analysis: The Indicators’ Point of View

The Bollinger Bands, widely used for measuring price volatility, have exhibited a notable convergence. This convergence visually emphasizes the tight price range. As the bands tighten around the SPONGE/USD price action, it signifies a decreased level of market volatility. This reduction in volatility is often indicative of an impending breakout, as periods of low volatility are often followed by notable price movements.

The RSI is a key oscillator used to measure the strength of recent price changes. Currently, the RSI line is hovering sideways, slightly above the 30 level. This placement indicates that the market might have recently moved away from extreme oversold conditions. However, the RSI’s horizontal movement also suggests a degree of indecision and a lack of significant buying or selling pressure.

Sponge/USD ($Sponge) Bulls Build Momentum Towards a Significant Price Surge

$SPONGE Short-Term Outlook: 1-Hour Chart

During market analysis, the SPONGE/USD experienced a sudden and significant bearish breakout characterized by a marubozu candlestick pattern, resulting in a price drop to $0.0001033. This type of movement has the potential to break the prevailing deadlock, presenting an opportunity for buyers to regain control of the market. Notably, the Bollinger Band is displaying signs of divergence, signaling the potential resolution of the deadlock.

Buy the dip!

Invest in the hottest and best meme coin. Buy Sponge ($SPONGE) today! 

Dash 2 Trade Price Predictions for Today, August 23: D2TUSD Looks Promising at the $0.00797 Resistance Value, Invest Now!

Dash 2 Trade Price Forecast: D2TUSD Looks Promising at the $0.00797 Resistance Value, Invest Now! (August 23)
Amid the recent upsurge in the crypto market, the Dash 2 Trade price gave a massive breakout from the 4-hour resistance of $0.00666 level. The coin is making positive moves at the moment. Hence, the crypto can swing up further and cross over the current price level at $0.00797. Should the long traders increase their pressure, the current price level may not hold and it may extend to a $0.10000 high level and beyond. Thus a clear buy signal for interested traders.

Key Levels:
Resistance levels: $0.01000, $0.01100, $0.01200
Support levels: $0.00700, $0.00600, $0.00500

D2T (USD) Long-term Trend: Bullish (4H)
The D2TUSD pair is in an uptrend on the higher time frame. The coin price is now strongly trading above the moving averages with huge volumes from the bulls. Thus, the recent market structure has favored the bulls.
Dash 2 Trade Price Predictions for Today, August 23: D2TUSD Looks Promising at the $0.00797 Resistance Value, Invest Now!
However, the bulls’ pressure to a $0.00669 high value in the previous action has sustained the coin price above the resistance trend levels in its recent high.

Today’s 4-hour bullish candle at the $0.00715 value which further rises to a $0.00797 supply mark above the moving averages confirms the bulls’ dominance in the market.

Thus, a sharp breakout and closure above the current correction phase at a $0.00797 high value will invalidate any bearish thesis.

Furthermore, Dash 2 Trade pair looks promising and indicates an upward momentum on the daily signal, this indicates that the coin price will continue to increase to the upsides and this may get to the $0.10000 upper resistance trend mark soon in its long-term outlook.

D2T (USD) Medium-term Trend: Bullish (1H)
On the medium-term outlook, the D2TUSD pair looks promising and trades above the resistance zone, indicating an uptrend. The crypto has broken above the moving averages which indicates a possible rise of the pair.
Dash 2 Trade Price Predictions for Today, August 23: D2TUSD Looks Promising at the $0.00797 Resistance Value, Invest Now!
Pressure from the buying traders at a $0.00668 high value in the previous action has sustained its upward stability in its recent high.

The Dash 2 Trade price earlier today, gave a bullish impulse move to the $0.00715 resistance mark above the two EMAs, which gave the coin the tendency to rise further.

However, if the bullish momentum persists, a breakout above the high resistance zone of $0.00797 price level with candle closing will signal a strong buy signal for interested traders.

Notably, there is likely to be a potential increase in D2TUSD soon as the market has reached the oversold region of the daily stochastic. If that occurs, the first upside target could be $0.010000 followed by $0.10000 soon in its medium-term time frame.

No more sloping! Not as desired, the market changed. Growing open interest a few weeks ago warned against taking too many leveraged positions without additional funding.


Want a coin that has a huge potential for massive returns? That coin is Dash 2 Trade. Buy D2T now.

Bitcoin Price Prediction: BTC/USD Bears May Slide Below $25,000 Support

Bitcoin Price Prediction – August 22

The Bitcoin price prediction shows that BTC is likely to cross below the lower boundary of the channel as the coin touches $25,350 support.

BTC/USD Long-term Trend: Ranging (Daily Chart)

Key levels:

Resistance Levels: $30,000, $32,000 $34,000

Support Levels: $22,000, $20,000, $18,000

Bitcoin Price Prediction: BTC/USD Bears May Slide Below $25,000 Support
BTCUSD – Daily Chart

BTC/USD may continue to face a setback that could drag the coin below the lower boundary of the channel, and the king coin is likely to have an additional bearish run. Currently, Bitcoin (BTC) is trading around the $25,673 level after a free fall from the opening price of $26,126.

Bitcoin Price Prediction: Bitcoin (BTC) Heads to the Downside

The Bitcoin price is currently nose-diving below the moving averages. If the price should slump below the support level of $25,000, it is likely to face a downward trend. Moreover, the further bearish movement could locate the supports at $22,000, $20,000, and $18,000, making room for BTC to fall even further.

In the meantime, the technical indicator Relative Strength Index (14) remains within the oversold region as the trading volume is in support of the bears. On the contrary, if bulls decide to move the price back above the 9-day and 21-day moving averages, BTC/USD may head toward the upper boundary of the channel to locate the resistance levels at $30,000, $32,000, and $34,000.

BTC/USD Medium-term Trend: Bearish (4H Chart)

On the 4-hour chart, the Bitcoin price remains below the 9-day and 21-day moving averages and the immediate support is likely to come at the $25,000 level. The price may likely fall below this level if the bears continue to dominate the market.

Bitcoin Price Prediction: BTC/USD Bears May Slide Below $25,000 Support
BTCUSD – 4-Hour Chart

However, a further bearish movement could hit the critical support at the $24,000 level and below, while the resistance is located above the moving averages at the resistance level of $28,000 and above. Meanwhile, the Bitcoin price is currently moving on the negative side as the technical indicator Relative Strength Index (14) stays within the oversold region, suggesting more bearish signals.

You can purchase Bitcoin here. Buy BTC

Lucky Block Price Prediction: LBLOCK/USD Begins the Upward Movement as Price Hits $0.000097

Lucky Block Price Prediction – August 22

The Lucky Block price prediction reveals that the bulls will begin to increase their entries as the price gets ready for the north.

LBLOCK/USD Medium-term Trend: Ranging (1D Chart)

Key Levels:

Resistance levels: $0.000130, $0.00140, $0.000150

Support levels: $0.000065, $0.000055, $0.000045

Lucky Block Price Prediction: LBLOCK/USD Begins the Upward Movement as Price Hits $0.000097
LBLOCKUSD – Daily Chart

LBLOCK/USD is beginning to move bullishly as the coin trades above the 9-day and 21-day moving averages. However, the bullish momentum is coming to play in the market, and the bullish pressure could break the $0.000100 level if the increased pressure. Meanwhile, if the bulls fail to drive the price higher, the Lucky Block price may continue to consolidate before gaining additional profit.

Lucky Block Price Prediction: LBLOCK/USD Heads to the Upside

The Lucky Block price is changing hands at $0.000096 where it will head toward the upper boundary of the channel. Moreover, if the coin crosses above the channel, LBLOCK/USD would locate the potential resistance levels at $0.000130, $0.000140, and $0.000150 while the support levels could be found at $0.000065, $0.000055, and $0.000045 respectively. This is because new buyers can come into the market as the technical indicator Relative Strength Index (14) moves to cross above the 50-level.

LBLOCK/USD Medium-term Trend: Ranging (4H Chart)

After crossing above the 9-day and 21-day moving averages, the Lucky Block retreats below the daily high of $0.000097 level. Meanwhile, the technical indicator Relative Strength Index (14) will confirm the bullish movement if the signal line crosses above the 60-level. Therefore, any possible cross above the upper boundary of the channel could reach the resistance level at $0.000103 and above.

LBLOCKUSD – 4 Hour Chart

Nevertheless, LBLOCK/USD will begin to display some bullish signals as the bearish movement fades out, but if the price drops and slides and face the lower boundary of the channel, it could touch the nearest support at $0.000090 and below.

You can purchase Lucky Block here. Buy LBLOCK

Tamadoge (TAMAUSD) Finds a Higher Support level at the $0.00800 Price Level

Initially, we observed the Tamadoge market exhibiting a ranging behavior. However, over time, the price gradually gravitated towards lower levels. Eventually, the bear market encountered significant bearish support at the $0.00600 price level, which acted as a formidable barrier. This specific price level served as a crucial pivot point for the impending bull market surge, as an intense influx of buying activity emanated from the $0.00600 price mark.

The bear market was initiated above the $0.010 price level, yet the bulls effectively defended the market’s integrity by establishing a robust support level at $0.00800. This higher support level became instrumental in preventing further decline. Given this context, the potential for the bull market to resume at this juncture remains viable.

Key Levels     

  • Resistance: $0.015, $0.016, and $0.017
  • Support: $0.0080, $0.0070, and $0.0065

Tamadoge (TAMAUSD) Finds a Higher Support level at the $0.00800 Price Level

TAMAUSD Price Analysis: The Indicators’ Point of View

During the prior daily trading session, the Tamadoge bulls endeavored to push the price towards their target; however, sellers adjusted their positions slightly downward. Presently, in reaction to this, buyers are aiming to secure an elevated support level beyond the 20-day moving average. This evolving situation has led to the convergence of the Bollinger Bands.

The convergence of support and resistance entails three potential outcomes. Yet, given that this convergence is transpiring above the 20-day moving average and within the buy zone of the Relative Strength Index, the advantage may lean towards the bulls.

Tamadoge (TAMAUSD) Finds a Higher Support level at the $0.00800 Price Level

Tamadoge Short-Term Outlook: 1-Hour Chart

On a shorter timeframe, the market signals seem to be converging towards equilibrium. As per the Relative Strength Index, the RSI line has retreated to approximately the midpoint of the indicator, specifically at a level of 48. At the price level of $0.00837, a potential support zone emerges. As the bear market nears this level, its momentum diminishes. Traders might congregate around this price point in an effort to initiate a market reversal.

Tamadoge games are available on both Android and iOS.

Do you want a coin that will be 100 times more valuable in the next few months? That is Tamadoge. Buy TAMA today!

Shiba Inu’s Shibarium Set for Relaunch Following Initial Setbacks

In an exciting turn of events, Shiba Inu’s much-anticipated blockchain project, Shibarium, is on the brink of a fresh launch attempt after facing initial technical challenges. Renowned as a meme coin sensation, Shiba Inu aims to rebound with its upgraded network designed to bring faster transactions and enhanced functionalities to its growing community.

Shibarium, a promising layer-2 solution, seeks to streamline transactions for Shiba Inu and its affiliated tokens like LEASH and BONE. The platform’s ambitious roadmap includes the integration of smart contracts, non-fungible tokens (NFTs), and decentralized applications, cementing its place in the wider Shiba Inu ecosystem.

Initial enthusiasm for Shibarium’s launch on August 16 was dampened by technical glitches and security vulnerabilities. The network experienced congestion due to a barrage of “spam transactions,” resulting in delays and disruptions. Adding to the chaos, issues suffered by Shibarium at launch reportedly led to at least $1.8 million in crypto funds getting stuck on the network.

Shytoshi Kusama Unveils Plans for Shibarium Relaunch

Screenshot from Shibarium blog post
Image Source: Shiba Inu

Addressing these concerns head-on, lead developer Shytoshi Kusama unveiled an array of proactive measures in a recent blog post. The team’s introduction of a “dynamic fee system” promises to adjust transaction fees according to network demand, warding off spam attacks. Additionally, rigorous audits and enhancements to the bridge contract aim to bolster security, and the team has ensured restitution for the affected users.

Although Kusama refrained from disclosing an exact date for Shibarium’s relaunch, he assured the crypto community that the much-anticipated event was imminent. Moreover, he hinted at an array of forthcoming features and partnerships set to elevate the network’s functionality and adoption rates.

Excitingly, Shibarium plans to pioneer cross-chain interoperability, seamlessly connecting with other blockchain giants like Polygon and Binance Smart Chain. Collaborations with notable industry players such as SushiSwap and OpenSea are on the horizon, further cementing Shibarium’s significance in the evolving crypto landscape.

Anticipation is palpable among Shiba Inu enthusiasts, who eagerly await the Shibarium relaunch with hopes of bolstering both the coin’s value and its overall prominence. Currently trading at $0.0000079, SHIB has experienced a marginal 2% dip in the last 24 hours, as per CoinMarketCap data.


You can purchase Lucky Block here. Buy LBLOCK

Litecoin (LTC/USD) Market Dumps, Settling for Rallying Motions

Litecoin Price Prediction – August 22
There have been financial reports stating that the LTC/USD market dumps, settling for rallying motions after making efforts to spring up from a reduction spot beneath the crucial point of $60.

Given that a rebound has been seen against the lower-trading spot of $60 going back approximately six days of operations to the present, buyers should be preparing to launch long-term position orders in light of the current deepening depth that the falling force has produced. The price is fluctuating close to $66.326939, maintaining a 1.00 percent downward percentage.

LTC/USD Market
Key Levels:
Resistance levels: $80, $90, $100
Support levels:$60, $55, $50

LTC/USD – Daily Chart
The LTC/USD daily chart portrays the crypto market dumps from a logical trading spot of around $80 as a result of bulls’ ineptitude to form a firm baseline, and it is currently settling for a round of rallying motions at a lower trading spot of $60.

The 14-day SMA indicator is placed at $78.267894 in a southward-bending mode underneath the $85.892353 value of the 50-day SMA indicator. The stochastic oscillators have crossed northbound from the oversold region, positioning from 18.97 to 30.82 points.
Litecoin (LTC/USD) Market Dumps, Settling for Rallying Motions
What pattern of pushes is likely to persist in the price for a while before we start to witness dependable returns in the valuation of LTC relative to the US coin?
It is expected for the LTC/USD trade to resume sideways below the trend lines of the moving averages for some time before pushing into a definite direction as the cryptocurrency market dumps, settling for rallying motions around the point of $60.

A short line of lows is liable to occur around the value line of $60 purposely to produce reliable decent entries for long-position placers. Nevertheless, the current point of transaction could be a good moment for buying orders ahead of volatile moves that will be in favor of bulls afterward.

Even though there may be additional ways for prices to fall, decreases in size often don’t last any longer than is necessary. As a result, sellers should exercise extreme caution this time around when thinking about a new shorting order.
Litecoin (LTC/USD) Market Dumps, Settling for Rallying Motions
LTC/BTC Price Analysis
In contrast, the Litecoin transaction line dumps against the trending weight of Bitcoin, settling for rallying motions from the lower horizontal line drawn beneath the trend lines of the moving averages.

They are momentarily bent southward above the current trading zone, with the 14-day SMA indicator below the 50-day SMA indicator. From the oversold area, the stochastic oscillators have curved northward to remain between the values of 43.62 and 64.23. In order to issue a cautionary notice against having a dependable, smooth run to the topside, a smaller force has appeared to make a sluggish reversal signal.

Note: Cryptosignals.org is not a financial advisor. Do your research before investing your funds in any financial asset or presented product or event. We are not responsible for your investing results.

You can purchase Lucky Block here. Buy LBLOCK

Maker (MKR/USD) Bounces Back at the $1064 Price Level

The price level of $1064 holds significant importance as a major demand zone. It is highly probable that the Maker market will experience a resurgence from this point on and proceed with its upward trajectory. When delving into historical data, it’s evident that the previous bullish rally was initiated precisely at this level on July 25. This led the market into a bullish phase that steered it toward the $1400 price point prior to the onset of the bearish market phase.

During this Maker bearish market period, a critical support point at $1064 played a pivotal role in halting the downward trend. Despite a test of the $1000 price mark by the bearish market, this attempt was swiftly rejected, causing the market to revert to the fundamental demand level at $1064. Should the pressure from the bearish side persist, the $1000 price level may emerge as the ultimate safeguard for maintaining the integrity of the ongoing bull market.

The Maker Market Data

  • MKR/USD Price Now: $1112.30
  • MKR/USD Market Cap: $1,083,964,093
  • MKR/USD Circulating Supply: 977,631 MKR
  • MKR/USD Total Supply: 977,631 MKR
  • MKR/USD CoinMarketCap Ranking: #41

Maker (MKR/USD) Bounces Back at the $1064 Price Level

Key Levels

  • Resistance: $1300, $1400, and $1450.
  • Support: $1000, $950, and $900.

Price Prediction for Maker: The Indicators’ Point of View

On August 16 and August 17, we observed pronounced bearish price action; however, the volume of trade indicator lacks the robustness necessary to substantiate the extent of the bearish candlesticks on these days. This suggests a decline in the potency of the bear market’s influence as they approach this key demand level.

The volume of trade indicator is a representation of the total number of shares or contracts traded during a specific time frame. Substantial or noteworthy volume typically corroborates the intensity of a price movement. In the context of a bearish trend, elevated volume amid a downward trajectory can signify heightened selling pressure, reinforcing the bearish price behavior. Nevertheless, when volume fails to meet expected levels of significance despite the presence of prominent bearish candlesticks, it could be indicative of waning bearish sentiment. This is where the concept of divergence comes into play. By identifying divergence, we can support the perspective that anticipates a price increase from the current level.

Maker (MKR/USD) Bounces Back at the $1064 Price Level

MKR/USD 4-Hour Chart Outlook

 From this vantage point, the Bollinger Bands exhibit convergence, resulting in the formation of a notably narrow price channel. This phenomenon implies an impending breakout. Nonetheless, it’s worth noting that while the market has already commenced a bullish breakout, the bullish price movement hasn’t yet gained sufficient momentum, causing the market to remain confined within this constrained price channel.

Nevertheless, traders are advised to monitor the volume of trade indicator for validation before making investment decisions. In terms of the 4-hour chart perspective, despite the potential for a bullish price surge, the volume traded within the daily session remains subdued, thereby impeding the pace of recovery. Alternatively, the market might persist in ranging at its current level, potentially bolstering the strength of this particular price level.

 Buy Maker on eToro.