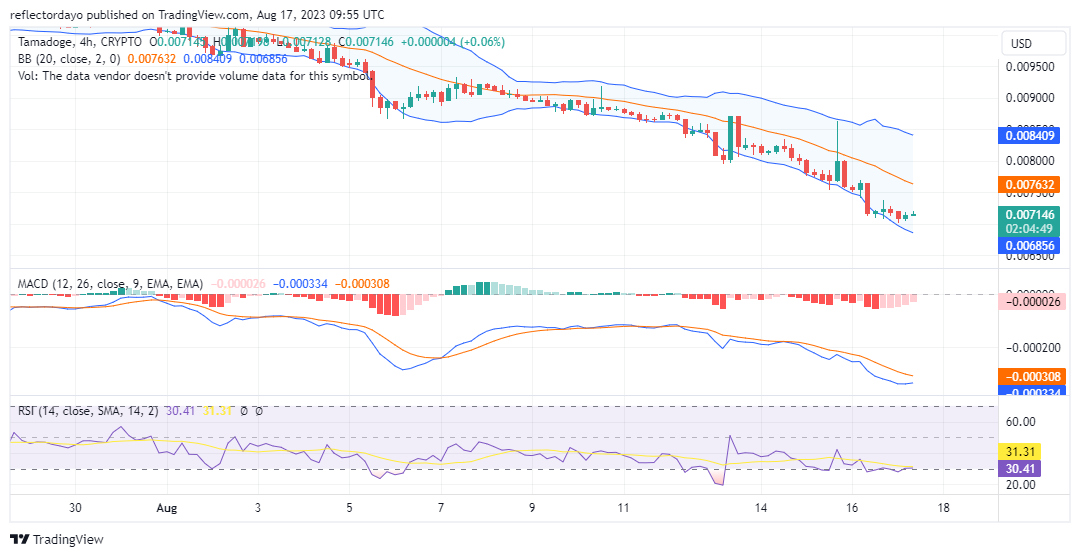
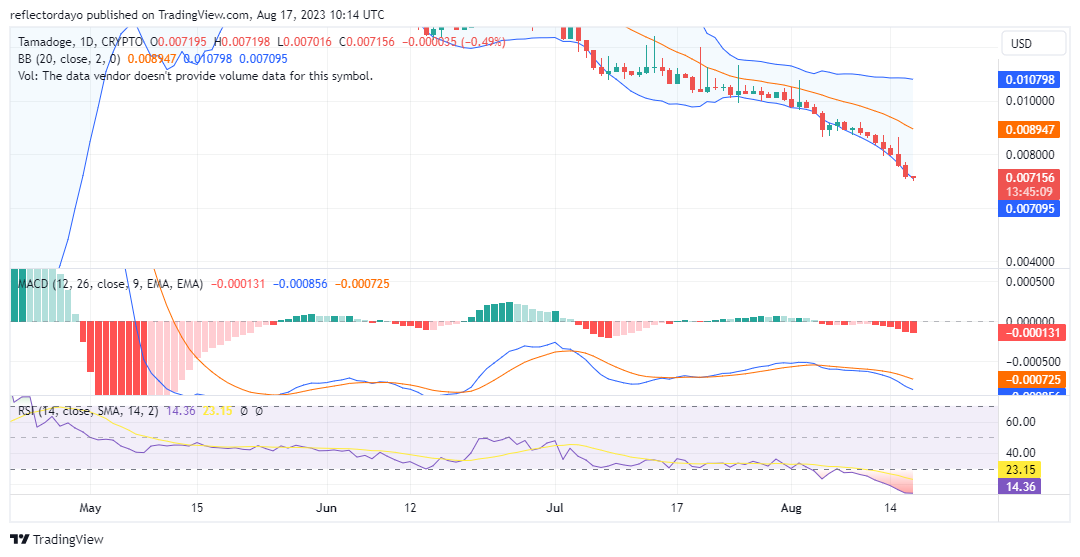
In the last few days, the Tamadoge market has experienced a downward trend, encountering several pauses at significant demand levels. However, nearing the $0.00700 price level, there are indications that the momentum could shift in favor of the buyers. The anticipation of a rebound at this point is leading to a period of consolidation, with the market stabilizing just above this price level.
Key Levels
Resistance: $0.015, $0.016, and $0.017
Support: $0.0070, $0.0065, and $0.006
TAMAUSD Price Analysis: The Indicators’ Point of View
As a potential rebound for the Tamadoge market at this critical demand level gains validation, the Moving Average Convergence and Divergence (MACD) indicator shows signs of fading red negative histograms, diminishing in height as the MACD line converges towards the signal line. Furthermore, the Relative Strength Index (RSI) also reinforces the likelihood of a recovery from this demand level as the market moves in sync with the 30 level, which signifies the threshold for oversold conditions.
Tamadoge Short-Term Outlook: 1-Hour Chart
Looking at the 1-hour chart viewpoint, the market has maintained a robust bearish sentiment, prominently displaying an evident state of oversold conditions. Within the Moving Average Convergence and Divergence (MACD) indicator, the negative histograms are distinctly shaded in deep red, progressing in a bearish manner.
Nonetheless, the most recent candlestick indicates waning bearish momentum. While the aggressive bearish trend nears the $0.007 price level, the market appears to be losing momentum. This dynamic adds to the anticipation of a potential rebound around this specific price level.
Both iOS and Android now provide the Tamadoge Arena app.
The Tamadoge Arena app is now available on both iOS & Android 🎉🥳
You can get in on the action in the App and Play stores below:
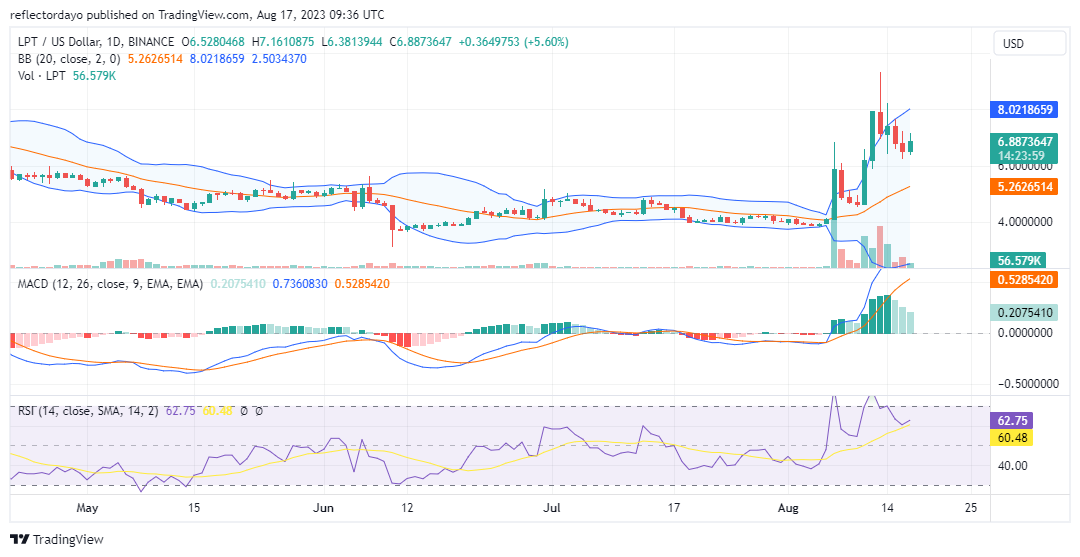
Over the past few days, the Livepeer bull market has driven the price beyond the $9.00 threshold. This market initiated this substantial price surge just last week, and the hyper-bullish momentum might be reaching its peak at the $9.33 price point. It is anticipated that a robust bear market could ensue following this vigorous movement. This strong market uptrend was observed peaking at the market’s high.
Nevertheless, this bear market seems to be short-lived, as the market is rebounding to $6.486. It appears that the market still maintains strong bullish sentiment.
The Livepeer Market Data
LPT/USD Price Now: $6.94
LPT/USD Market Cap: $199,532,003
LPT/USD Circulating Supply: 28,724,461 LPT
LPT/USD Total Supply: 28,724,461 LPT
LPT/USD CoinMarketCap Ranking: #133
Key Levels
Resistance: $8.00, $8.50, and $9.00.
Support: $5.50, $5.00, and $4.50.
Price Prediction for Livepeer: The Indicators’ Point of View
As the Livepeer market shifted in favor of the bulls last week, a notable increase in trading volume was observed. Alongside the rise in market volatility, traders became active in both buying and selling. Among these actions, a greater inclination toward buying is evident due to the prevailing bullish sentiment in the market.
The prevailing market bias is bullish, which is clearly indicated by the Bollinger Bands indicator. The upper standard deviation displays greater divergence than the lower standard deviation, signifying the dominance of the bulls. As the price continues its rally, the next potential halting point could be the $9.33 price level.
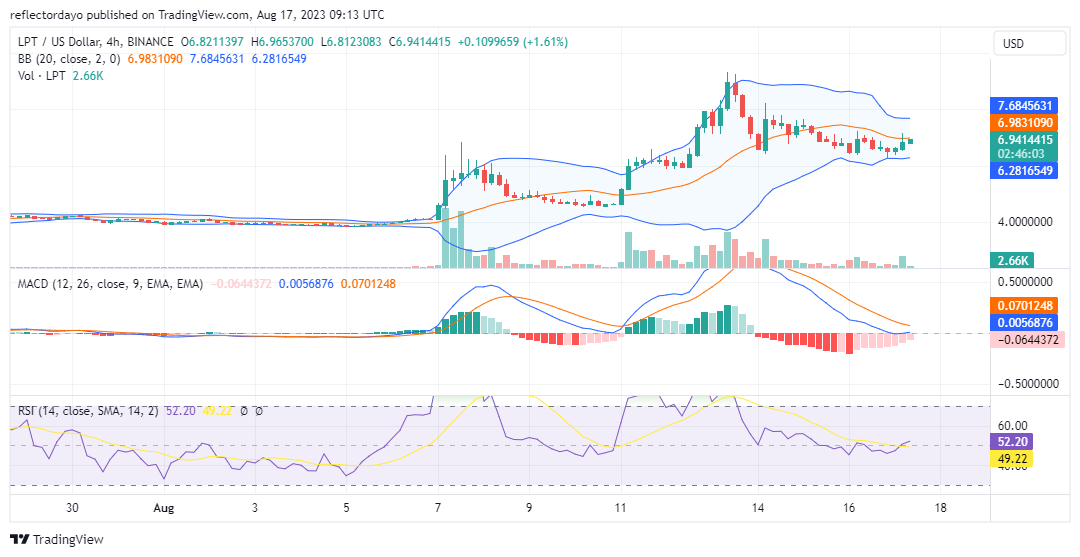
LPT/USD 4-Hour Chart Outlook
The Livepeer market, as observed from the 4-hour chart, is slightly positioned below the 20-day moving average. It is trying to surpass the $6.450 support level, which has proven resilient against the intense bear market stemming from the $9.33 peak. Since August 14, this demand level has effectively prevented further bearish movement.
At present, the Relative Strength Index (RSI) indicates a state of equilibrium within the market. The RSI line is showing a shift towards an upward trajectory. A similar trend is evident in the Moving Average Convergence and Divergence (MACD) indicator. The market is now in pursuit of reaching the $9.33 level.
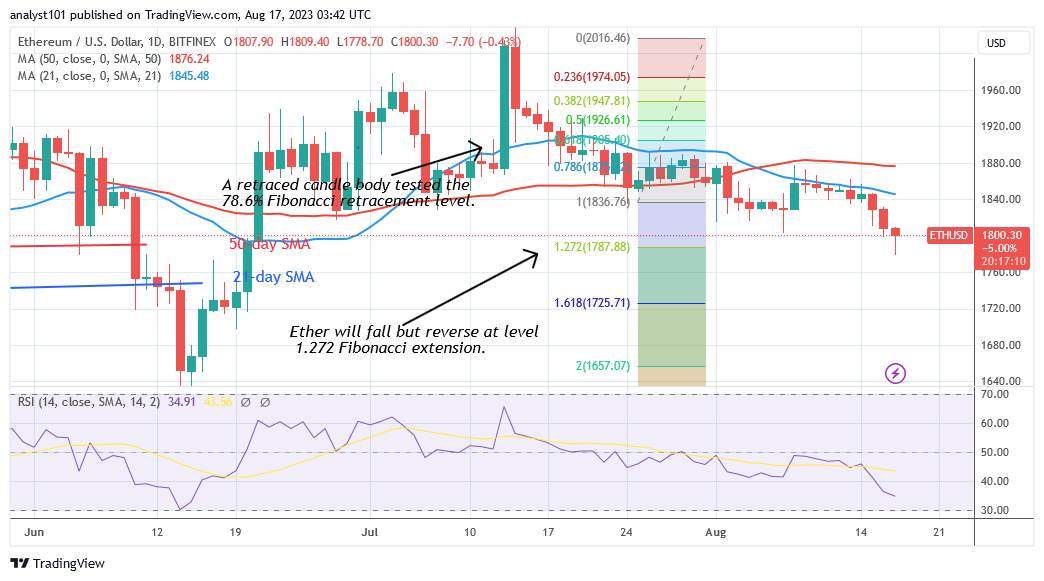
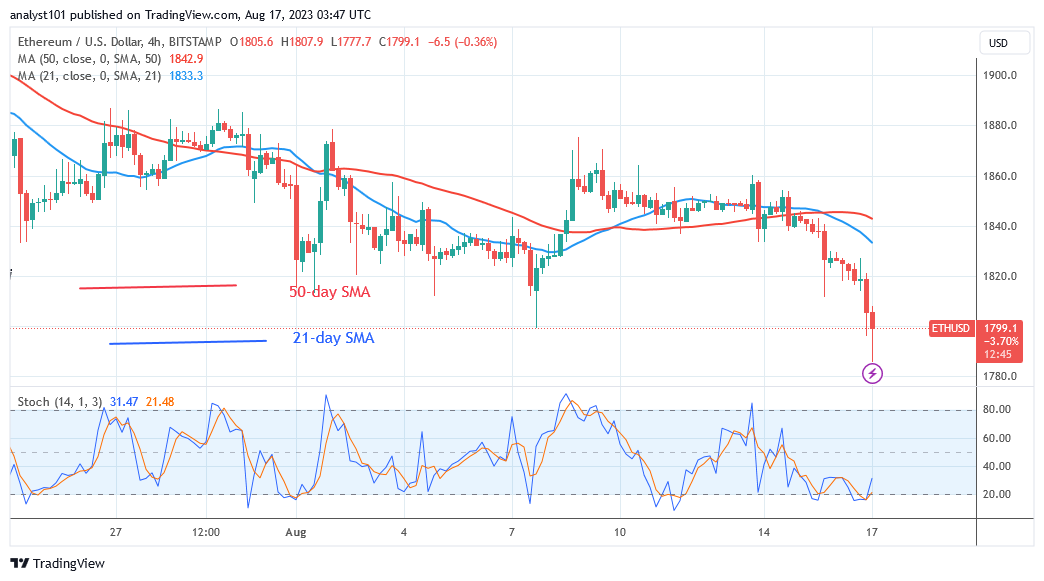
Ethereum Price Long-Term Analysis: Bearish The price of Ethereum (ETH) has broken through the current support level of $1,800 as it rebounds above $1,700.The selling pressure has dropped to the predicted level. The price indicator has already forecasted that the altcoin will fall but then reversal at the 1.272 Fibonacci extension level or $1,787.88 low.
Furthermore, the largest altcoin is trading towards the market’s oversold region. This suggests that the selling pressure in the market’s oversold region will shortly ease. Meanwhile, Ether is trading in a limited range between $1,780 and $1,800 per coin.
ETH/USD – Daily Chart
Technical indicators: Major Resistance Levels – $2, 600, $2,800, $3,000 Major Support Levels – $1.600, $1, 400, $1,200
Ethereum Indicator Analysis The largest altcoin is reaching the oversold territory on the Relative Strength Index for period 14 at level 34. The price bars are below the moving average lines, causing the fall. Ether has gone below the daily Stochastic level of 20. The coin has slipped into the market’s oversold zone. Buyers are anticipated to emerge to drive prices higher.
Conclusion Ethereum has dropped to a new low of $1,778.70 as it rebounds above $1,700. The cryptocurrency’s price is currently ranging between $1,780 and $1,800. Ether will begin to rise once it breaks over the prior support level of $1,800.
However, additional declines in the cryptocurrency seem unlikely as the market approaches oversold territory.
Note: Cryptosignals.org is not a financial advisor. Do your research before investing your funds in any financial asset or presented product or event. We are not responsible for your investing results
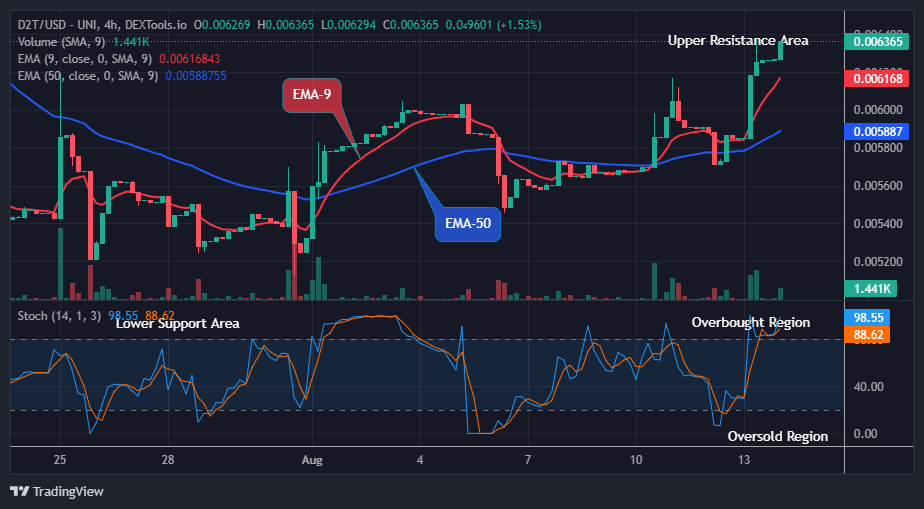
Dash 2 Trade Price Forecast: D2TUSD Bullish Pattern May Plunge Prices to a $0.01000 High Mark, Purchase Now! (August 17) The Dash 2 Trade (D2TUSD) price is likely to grow further and is an opportunity for long investors. The bullish pattern may likely plunge the coin price to a $0.01000 high mark as the market price remains above the $0.00626 resistance level. If the current support at $0.00584 value holds, and the daily chart closes above the $0.00636 resistance level, then there is a high probability of the price going up to its recent swing high, which is the $0.00670 resistance trend line. This might plunge the crypto prices to a $0.01000 upper resistance level, leading to higher profits for the coin holders.
D2T/ USD Long-term Trend: Bullish (4H) Price action on the long-term outlook seems to be rising upward without losing control despite the market uncertainties. The price of D2TUSD is strongly trading above the supply trend levels at the upper resistance area of the market. The bulls’ pressure on the currency pair in the past few hours has made it possible for the price to remain in an upward trend zone in its recent high.
Today, the price is making higher highs and higher lows. As an outcome of low bearish momentum, buyers are hindering the market from smashing through the support zones.
The coin price at a $0.00636 resistance value is undeniably bullish as the 4-hourly session opens today. Thus, the coin price will grow further if the buy traders could add more pressure to their buying actions in the market.
Should the buying team add more pressure and trigger a breakout above the $0.00670 resistance level, a breakout above this barrier, with a 4-hour candle closing could signify a shift in the market dynamics.
Such a breakthrough would provide an opportunity for buyers to regain control and potentially drive the price toward the $0.01000 mark.
Having said that, the daily signal indicates an upward direction, if the bullish momentum persists, a breakout above this combined resistance with candle closing could plunge the price of Dash 2 Trade to the $0.01000 upper resistance level soon which would result in a strong buy signal for interested traders.
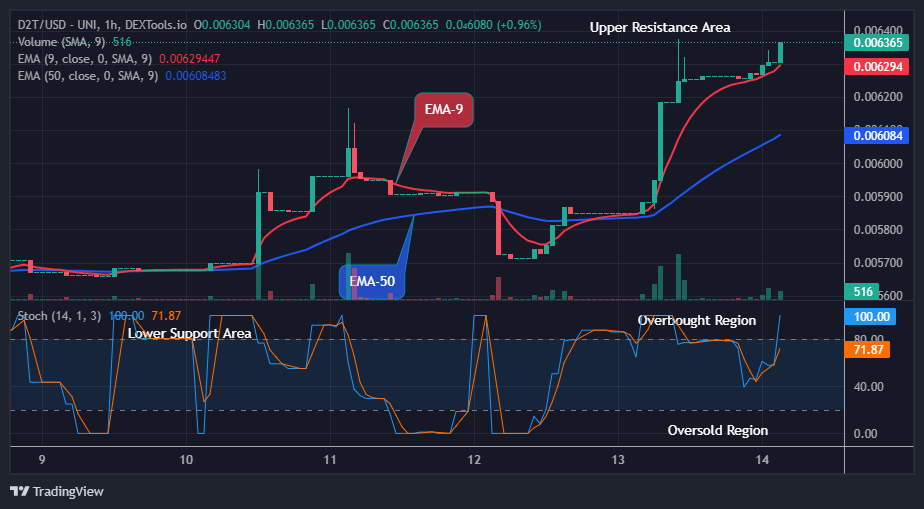
D2T (USD) Medium-term Trend: Bullish (1H) In the medium-term time frame chart, the Dash 2 Trade price showed a smooth recovery under the influence of a rising trend line. The coin prices are also strongly traded above the supply trend lines, confirming a bullish trend. The bulls have sustained the crypto market at the $0.00645 supply value in the previous action, this has made it possible for the coin to stay above the trend line and remain stronger at the moment.
The momentum remains in an uptrend despite the push from the short traders, the buying team made a touch at the $0.00636 high mark above the two EMAs as the 1-hourly chart resumes today. This trend pattern proves the impact of bullishness on crypto.
Thus, buyers must redouble their efforts to forecast a bullish increase in the market above the $0.00670 previous peak mark.
Notably, the daily stochastic remains in an upward direction, therefore, if the long traders could push harder and sustain the coin price above the $0.00670 previous high, the resulting rally may surpass the previous high and drive the price of D2TUSD to the $0.01000 psychological level at the upside in the days ahead in its medium-term perspective.
If you’re still here toiling away despite another week of ineffective activity, you’re on the road to beating the Bull. This week, Smart Money made a unique move: its stablecoin holdings decreased marginally. Just yesterday, it dropped to 11.7%, maybe as a result of a transaction made with Smart Money that we’ll go into later.
🔍 Smart Money Insights 🚀
📊 Another week of sideways action, but if you're still here grinding, you're on the path to conquer the Bull. Smart Money's stablecoin holdings dipped slightly this week, a rare move. Just yesterday, it fell to 11.7%, possibly linked to a Smart Money… pic.twitter.com/Pnw0ecl1lj
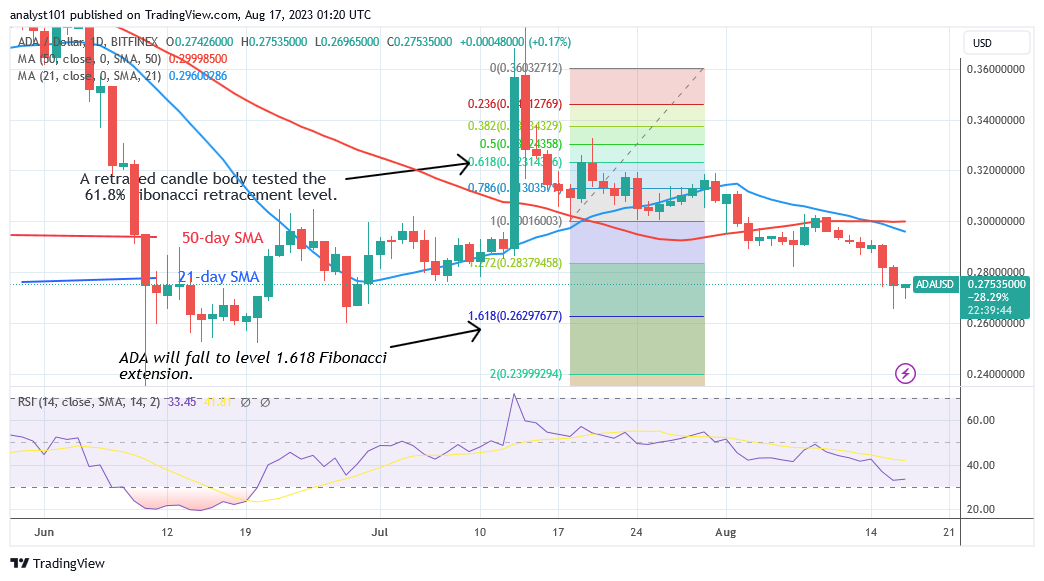
Cardano (ADA) Price Long-Term Forecast: Bearish The price of Cardano (ADA) is falling and has achieved bearish exhaustion as the market falls under $0.26. Selling pressure was expected to peak at a low of $0.26 prior to the price started to move again. Cardano has dropped to a low of $0.26 today and has since recovered.
The cryptocurrency’s future decline is improbable because it is trading near the market’s oversold region. On the negative, the cryptocurrency’s price has been reversing every time the market falls below $0.26. Today, the price of ADA is growing, reaching a high of $0.27.
ADA/USD – Daily Chart
Technical Indicators: Major supply zones: $1.0, $1.05, $1.10 Major demand zones: $0.45, $0.40, $0.35
Cardano (ADA) Indicator Analysis Cardano has reached level 32 of the Relative Strength Index period 14 due to the recent decrease. The altcoin is also trading toward the market’s oversold area. The price bars are below the moving average lines, causing the altcoin to fall in value. The ADA price is currently rising above level 25 of the daily Stochastic. The coin has previously hit the market’s oversold zone.
What Is the Next Move for Cardano (ADA)? Cardano’s bearish momentum has now ceased as the market falls under $0.26. The altcoin has dropped and retested its prior low of $0.26. Cardano has been reverting above the $0.26 support since June 10. The upward trend will probably begin above the $0.26 support level. Buyers are appearing at lower price levels to push prices higher.
Note: Cryptosignals.org is not a financial advisor. Do your research before investing your funds in any financial asset or presented product or event. We are not responsible for your investing results
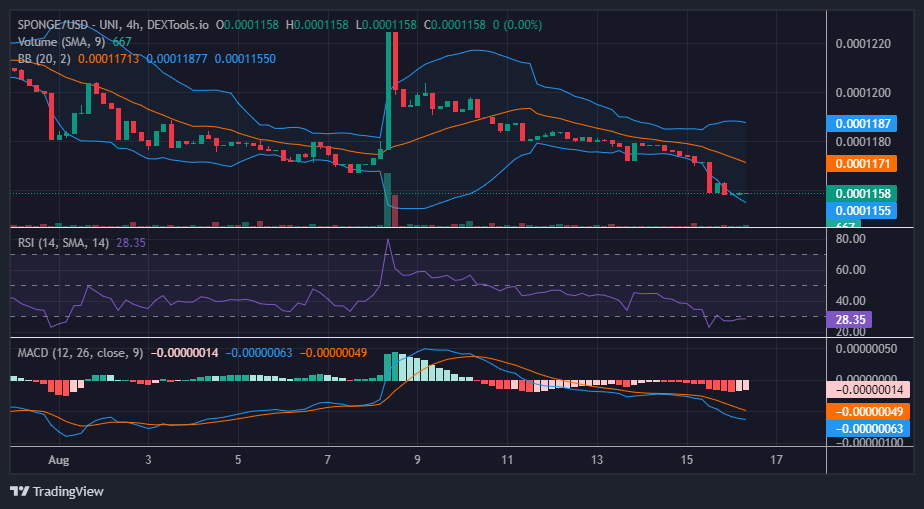
The $SPONGE market seems to have found firm support near the $0.0001158 price level. Yesterday’s bearish market experienced a surge in trading activity, pushing the price further into the demand zone until it reached approximately the $0.000116 price level. However, it’s important to note that at this point, the market established a new low that was even lower than the low of August 7th, which was at $0.0001167. Considering the significant price surge that originated from this level on the following day, a similar reaction could potentially be anticipated from the $0.0001158 price level as well.
Key Levels
Resistance: $0.0004, $0.0045, and $0.0005.
Support: $0.00011, $0.00010, and $0.00009.
Sponge (SPONGE/USD) Price Analysis: The Indicators’ Point of View
Based on the Relative Strength Index (RSI), the $SPONGE market is currently experiencing a slight range-bound movement just below the oversold threshold, specifically at the level of 28.35. The information from this indicator can add to the optimistic sentiment associated with this level. Nevertheless, the limited trading volume might impede the pace of recovery.
The market appears to be gearing up for a bullish trend, as indicated by the Moving Average Convergence and Divergence (MACD), which is also displaying indications of diminishing bearish momentum. The most recent two negative histograms have transitioned to faded red.
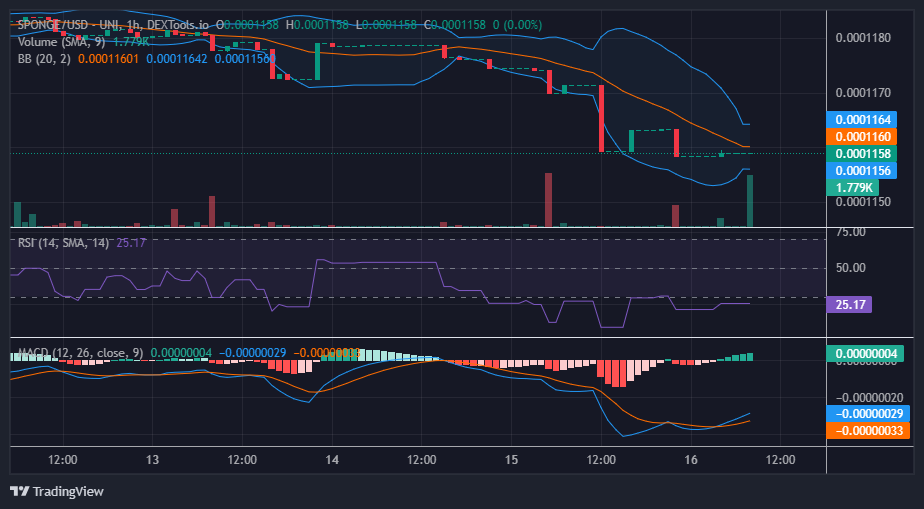
$SPONGE Short-Term Outlook: 1-Hour Chart
Analyzing the 1-hour chart perspective of the market around the $0.0001158 price level reveals a pronounced level of stagnation. The occurrence of four-price dojis persists at this horizontal price threshold. In the latest 1-hour trading session, the presence of the four-price doji was matched with a robust volume histogram. This could potentially signify substantial participation from traders who are actively engaged in this session. The elevated volume could potentially indicate a shift in sentiment, increasing the likelihood of a reversal scenario from its current direction.
Don’t pass up the fantastic $SPONGE Airdrop chance!
Although cryptocurrencies function on diverse technical frameworks, crypto markets frequently operate similarly to conventional markets. In these markets, you have the ability to purchase, vend, and exchange various cryptocurrencies, and their prices fluctuate in response to shifts in demand.
Approaches to Cryptocurrency Investment
When engaging in cryptocurrency investments, it’s crucial to meticulously assess elements such as your earnings, financial objectives, and capacity for risk. Once you’ve factored in these aspects, you might consider the following steps:
Implement Dollar-Cost Averaging (DCA), a method that entails consistent investments, to mitigate the uncertainties linked to market timing.
Consider assigning a minor segment (approximately 5%) of your comprehensive investment portfolio to cryptocurrencies. The precise allocation will hinge on your personal circumstances and willingness to tolerate risk.
Conduct periodic evaluations and adjustments to your portfolio to ensure that your investments remain aligned with your financial aspirations and risk threshold.
Cryptocurrency Investment Risks to Be Aware of
It’s important to recognize that crypto investing carries a range of risks, which include:
Regulatory Risk: This involves the possibility of shifts in governmental or regulatory policies concerning cryptocurrencies. The regulatory landscape for cryptocurrencies is often uncertain, and sudden alterations in their legal status can significantly impact their valuation.
Market Manipulation: Instances of market manipulation, such as “pump-and-dump” schemes, can occur. These schemes involve coordinated efforts to artificially inflate the price of a cryptocurrency to attract unsuspecting investors. Subsequently, these groups sell their holdings, causing the price to plummet.
Cyber Theft Risk: Cryptocurrencies are digital assets susceptible to hacking, theft, and fraudulent activities. If a crypto wallet is compromised, the funds can be stolen, often with limited prospects for recovery. One approach to enhancing security is to store a substantial portion of your cryptocurrency in a hardware wallet. Hardware wallets provide enhanced safety by keeping private keys offline and out of the reach of hackers.
While the risks associated with crypto investing are considerable, the potential rewards can also be substantial. For instance, early adopters of bitcoin have experienced remarkable returns in traditional markets. Additionally, cryptocurrencies can serve as a hedge against the uncertainties of the traditional financial system during periods of economic instability.
Factors to Consider When Determining Your Affordable Cryptocurrency Portfolio
This fundamental question applies to any investment endeavor, and in most cases, there are several key common considerations:
Income: Start by evaluating your income and budget. A cardinal rule is to only invest money you can afford to lose, ensuring that essential expenses like rent, food, and bills are not compromised. Additionally, before entering into investments, it’s wise to establish an emergency fund that covers 3-6 months’ worth of living expenses. This buffer provides security against unforeseen events such as job loss or medical emergencies.
Financial Goals: Are you saving for a specific goal like purchasing a home or planning for retirement? Having a well-defined end objective significantly simplifies maintaining consistency in your investment strategy. This clarity aids in making informed decisions and staying focused, particularly during periods of market turbulence, even when dealing with crypto assets.
An important divergence in the realm of cryptocurrency is your tolerance for risk. Assessing your comfort level with risk is crucial, recognizing that crypto investments can lead to both substantial gains and losses at a relatively rapid pace compared to traditional investments. In line with the aforementioned principle, gauge how severely a potential loss could impact you. If the notion of a potential financial setback causes significant distress, it might be prudent to consider a more conservative investment approach.
Once you’ve gained a solid understanding of your income, risk tolerance, financial aspirations, and the amount you’re prepared to allocate to cryptocurrencies, a strategy worth contemplating is Dollar-Cost Averaging (DCA), also known as “steady-drip investing.” With this strategy, you divide your desired investment amount into equal portions and systematically invest them over time. For instance, rather than investing the entire $12,000 at once, you might opt to invest $1,000 monthly over a span of 12 months.”
Advantages of this Cryptocurrency Investment Strategy
Mitigating Uncertainty in Market Timing: The challenge of accurately timing market fluctuations is formidable, even for seasoned investors. Consistently buying at low points and selling at high points can be an elusive endeavor, especially for those who aren’t professional day traders. However, the beauty of Dollar-Cost Averaging (DCA) lies in its simplicity. By consistently investing the same amount at regular intervals, you acknowledge that the ups and downs of the market will balance out over time, contingent on the specific investment asset.
Fostering Regular Investment: DCA fosters the practice of regular investing, a habit that can contribute to gradual wealth accumulation, even if you’re committing a modest sum during each interval. This approach guards against the pitfalls of sporadic or inconsistent investing patterns, promoting a more disciplined and steady investment journey.
Conclusion
By understanding your financial objectives, financial situation, risks involved, and risk appetite, you familiarize yourself with the tools, approaches, and tactics at your disposal for making sound investment choices. With this understanding, you can then gauge your capacity for crypto investment.
In essence, effective crypto investors are well-informed, patient, and judicious. Through a thorough evaluation of your financial circumstances and aspirations, coupled with a comprehensive grasp of crypto investment insights, you can make more precise evaluations on constructing a portfolio that encompasses cryptocurrency.
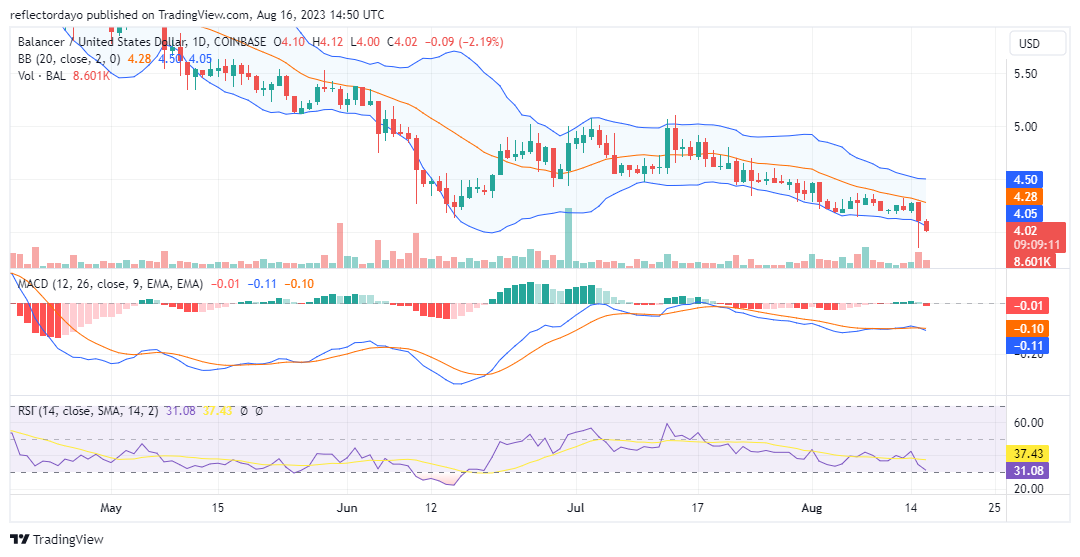
During the period between mid-June and mid-July, the Balancer (BAL/USD) market exhibited high volatility and a lack of clear direction. The price action unfolded within a broad range of $4.50 to $5.10, signifying volatile market sentiment and indecision among traders.
Initially, in the second half of June, the support level was identified at $4.15, while the resistance level stood at $5.00. However, by the end of June, these levels had shifted, with support adjusting to $4.50 and resistance adjusting to $5.10. This adjustment in levels signifies changing market dynamics and potential shifts in supply and demand.
Balancer Market Data
BAL/USD Price Now: $4.02
BAL/USD Market Cap: $200,400,015
BAL/USD Circulating Supply: 51,56,1669 BAL
BAL/USD Total Supply: 58,562,744 BAL
BAL/USD CoinMarketCap Ranking: #132
Key Levels
Resistance: $5.50, $6.00, and $6.50.
Support: $4.00, $3.50, and $3.00.
Price Prediction for Balancer: The Indicators’ Point of View
On July 14th, a significant bearish event transpired as the Balancer market encountered a notable resistance level at $5.10. This resistance prompted a bearish reversal, catalyzing a downward spiral in prices. Ultimately, the market reached its lowest point of the year, reaching $3.86 in the recent trading sessions. This pronounced decline signifies a strong bearish sentiment during this period.
Given the extent to which the bulls have ventured into bullish territory, there is potential for the market to shift in favor of the buyers. Buyers might congregate around the $4.00 price level, potentially leading the market to pivot in their favor.
The Relative Strength Index (RSI) underscores the depth of bearish sentiment in the market due to the sharp decline observed over recent days. The price is hovering in proximity to the oversold threshold, indicating that the market could be approaching a state of exhaustion concerning downward momentum. This scenario might signal a prospective reversal or bounce.
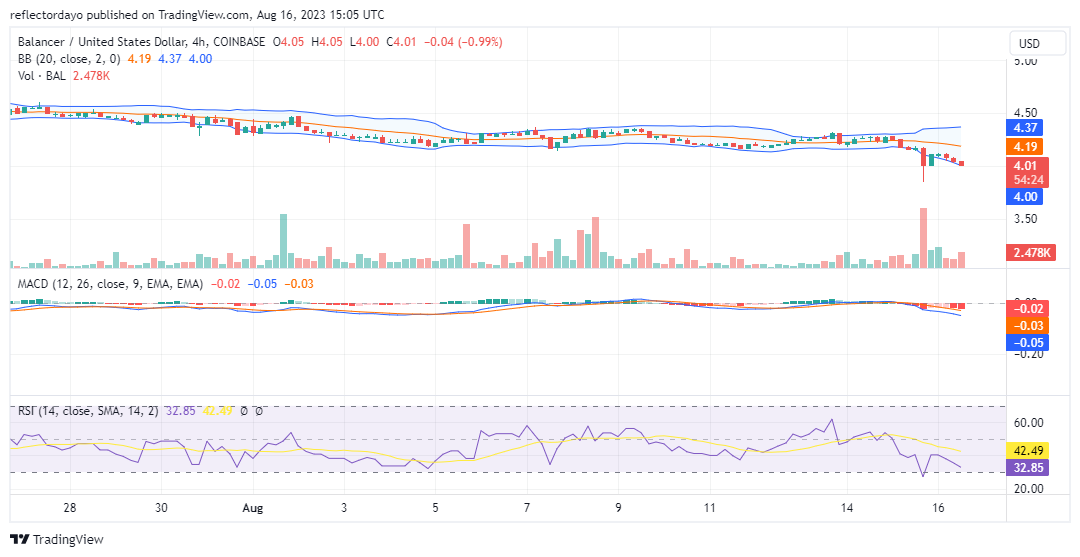
BAL/USD 4-Hour Chart Outlook
Examining the 4-hour chart, the bear market exhibited a noticeable and dramatic increase in liquidity. This was vividly depicted by a distinct spike in the trade volume indicator during the final 4-hour session of the preceding day. Traders capitalized on this price dip, seizing the opportunity to initiate long positions and seek shelter at the $4.00 support level. There is potential for a market shift in favor of buyers in this vicinity.
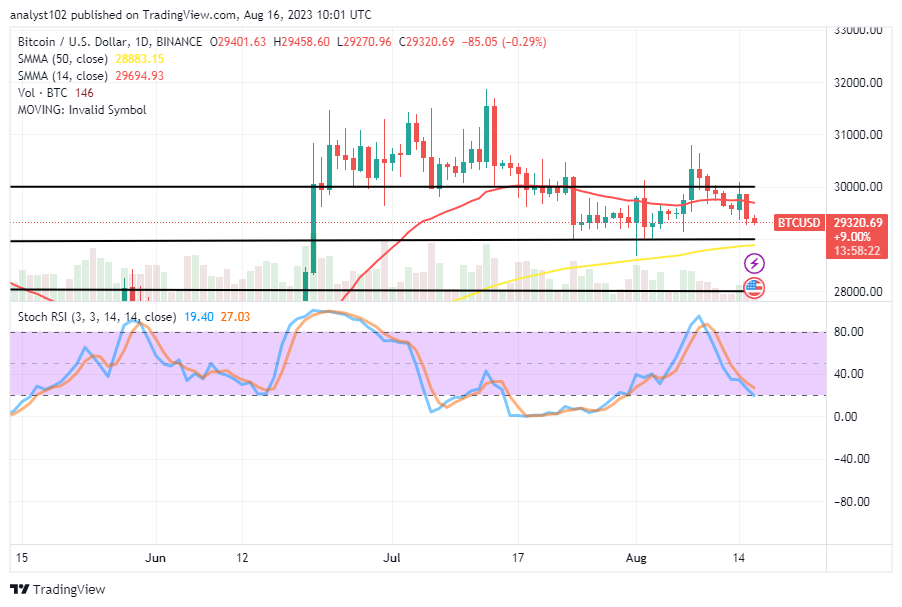
Bitcoin Price Prediction – August 16 As of the writing of this technical analysis, the BTC/USD market bears appear to be at the top of pushing, given the crypto trade depresses, attempting to average the support line of $29,000.
With 320.69 currently left over after continuous selling activity, the retracement appears to be moving in the direction of the value line’s threshold. The decrease transaction has a weak force that is less inclined to participate in the shorting process. By launching a purchase limit order later, buyers may be getting set closely beneath the point.
BTC/USD – Daily Chart The BTC/USD daily chart reveals that the crypto-economic trade depresses, attempting to average the support level of $29,000.
Being as it has been trending, the current formation of a smaller bearish candlestick portends that about 25% or a bit less will be the remaining value that the market may go further reducing as the 14-day SMA indicator is at $28,883.15 underneath the $29,694.93. The Stochastic Oscillators are positioned southbound, maintaining points between 27.03 and 19.40. Should investors in the BTC/USD market launch their products before the price retests the $29,000 support line? The obtainable psychological trade thought in the BTC/USD market operations suggests that investors can start adding to their portfolio sizes as the crypto-economic trade depresses, attempting to average the support zone of $29,000.
Long-term position orders might have to be suspended at this point to allow a test of support to occur, possibly around the trend line of the bigger Moving average, before considering launching buy orders afterward.
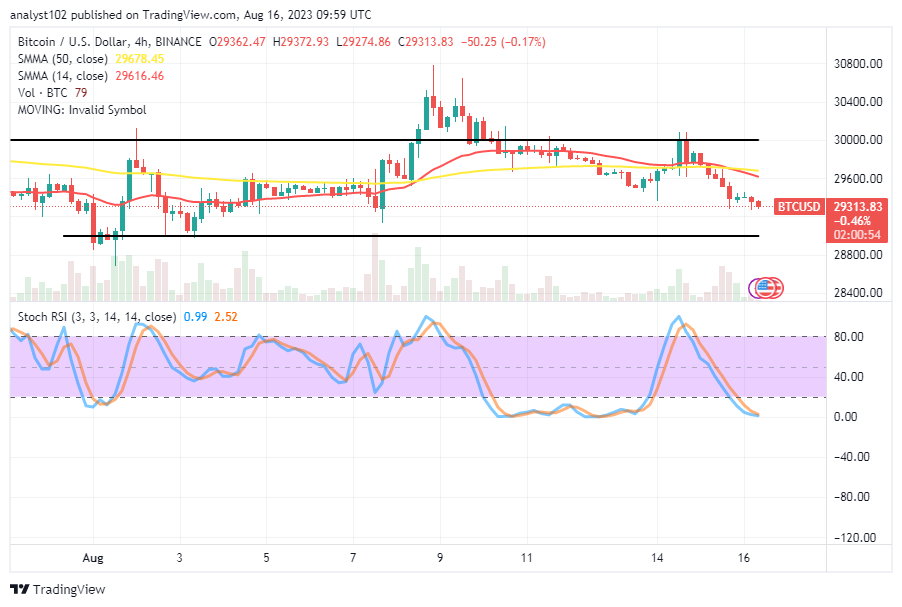
Because the Oscillators’ reading posture indications showed lower figures to complete it perhaps in the near future, it appears that it was too late to join the downward force even at its current rate of trading. To prevent any potential whipsaw session against any current intended shorting order, that presumption should be maintained. BTC/USD 4-hour Chart The BTC/USD 4-hour chart shows the crypto trade depressed, attempting to average the support level of $29,000.
The 50-day SMA trend line has been crossed by the 14-day SMA trend line to the south, making the bigger indicator to place at $29,678.45. The Stochastic Oscillators are in the oversold region, keeping the point lines between 2.52 and 0.99. That signifies that the fallout situation is rapidly approaching an end. Therefore, sellers should be cautious about pushing more than necessary through the underlying baselines.
Note:Cryptosignals.org is not a financial advisor. Do your research before investing your funds in any financial asset or presented product or event. We are not responsible for your investing results.