Bitcoin (BTC/USD) Trade Is Mooning, Nurturing Momentums

Bitcoin Price Prediction – March 13

Stable processions of price increases have continually been generated in the market activities of Bitcoin versus the valuation of the US Dollar, given that the trade is mooning, nurturing the momentum in a positive direction.

The current trade affairs have confirmed that the crypto economy is still headed for higher positions, so it would be a smart technical concept for long-position traders to try and identify optimal rising forces to leverage their means of entry. In the vein of keeping that sentiment alive, buyers should also be cautious about buying against an aggressive pull-down-moving force that may surface.

BTC/USD Market
Key Levels:
Resistance levels: $75,000, $77,500, $80,000
Support levels: $65,000, $62,500, $60,000

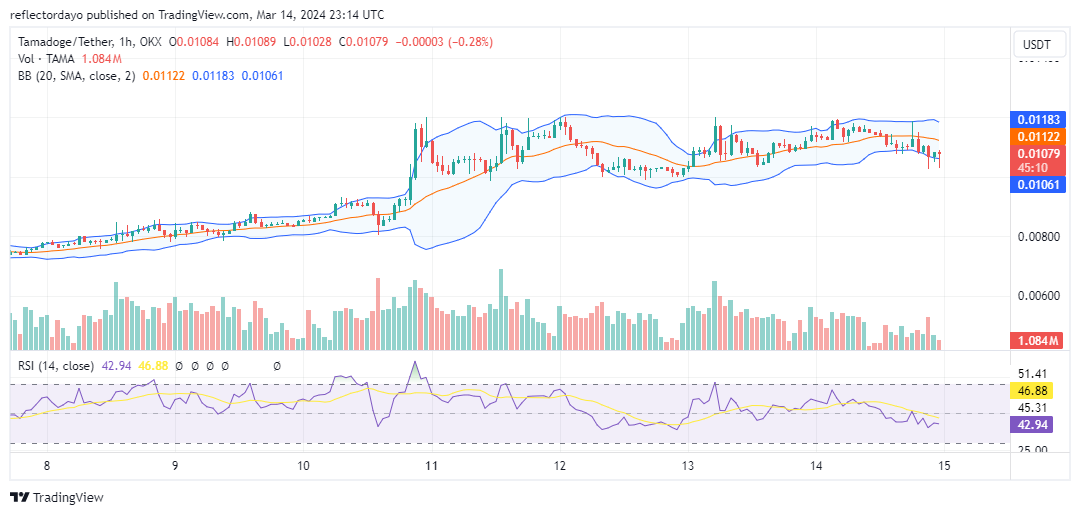
BTC/USD – Daily Chart
The BTC/USD daily chart showcases that the market is mooning steadily, nurturing the momentum through some higher points above the previous all-time high.

The upper Bollinger Band indicator has continued to move highly above the other trend lines. As it is, the middle Bollinger Band indicator has been seen to be the crucial support trade line against the validation of either regaining or losing more values in the event of a massive correctional pattern. The stochastic oscillators have moved southerly to get a re-cross positional posture to a crypto signal to the upside.
Bitcoin (BTC/USD) Trade Is Mooning, Nurturing Momentums

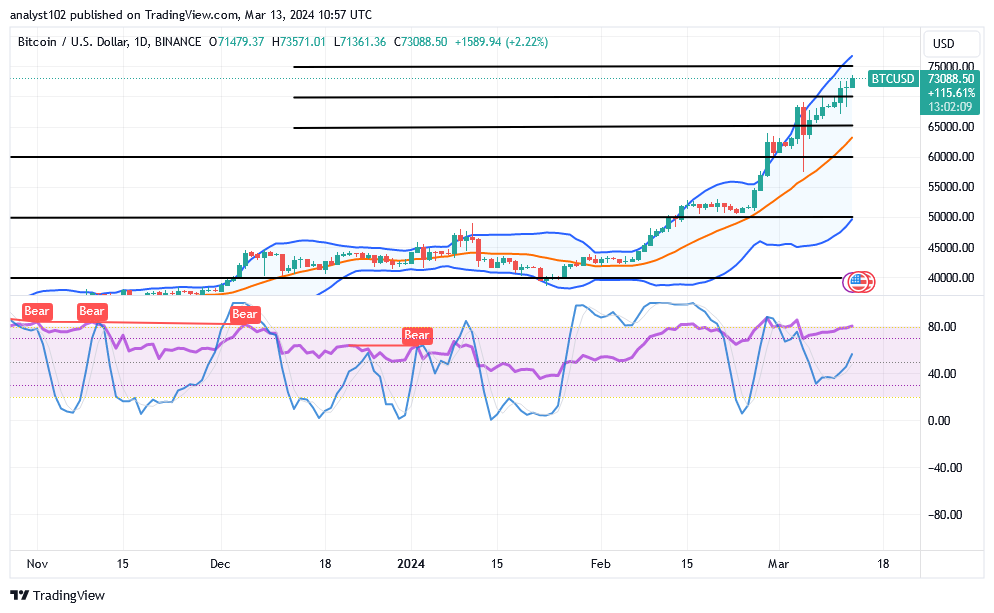
When will the US coin tendencies begin their views against Bitcoin, given that it is currently in a positive running cycle?

The American currency may be tending to re-affirm its valuation against the market-pushing forces of Bitcoin only when several rejections set up to garner at a given higher spot, given that the BTC/USD market is mooning presently, nurturing the momentum.

As the condition of the market is good, long-position placers should be cautious about making entries without spotting active price actions. Investors are believed to still find ways to increase points afterward.

It has been demonstrated that to get an ideal time for a decent shorting position order, a touch of price around the upper Bollinger Band trend line has to materialize with a reasonable reversal mode of price action before launching a short order position.
Bitcoin (BTC/USD) Trade Is Mooning, Nurturing Momentums
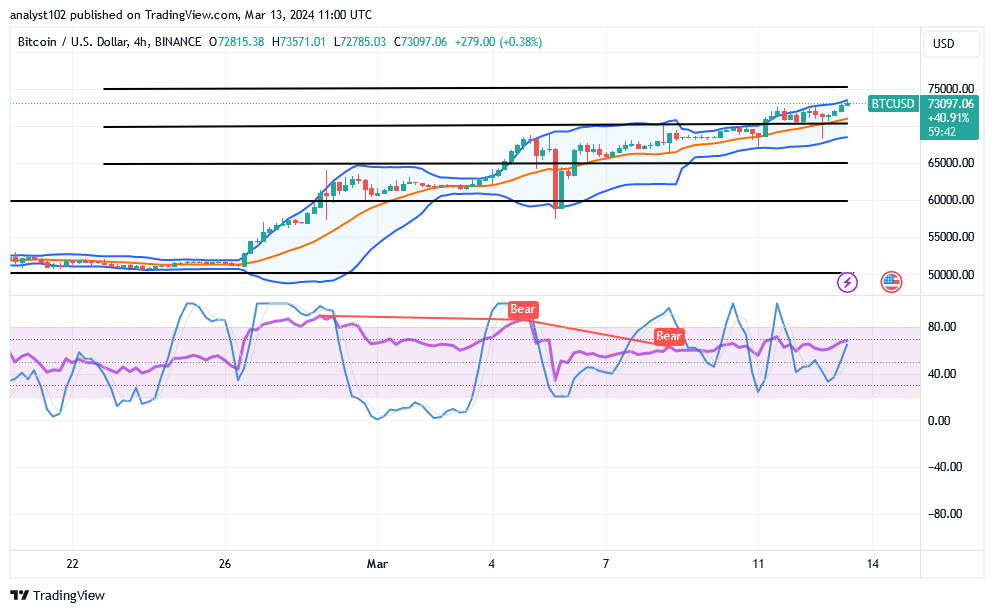
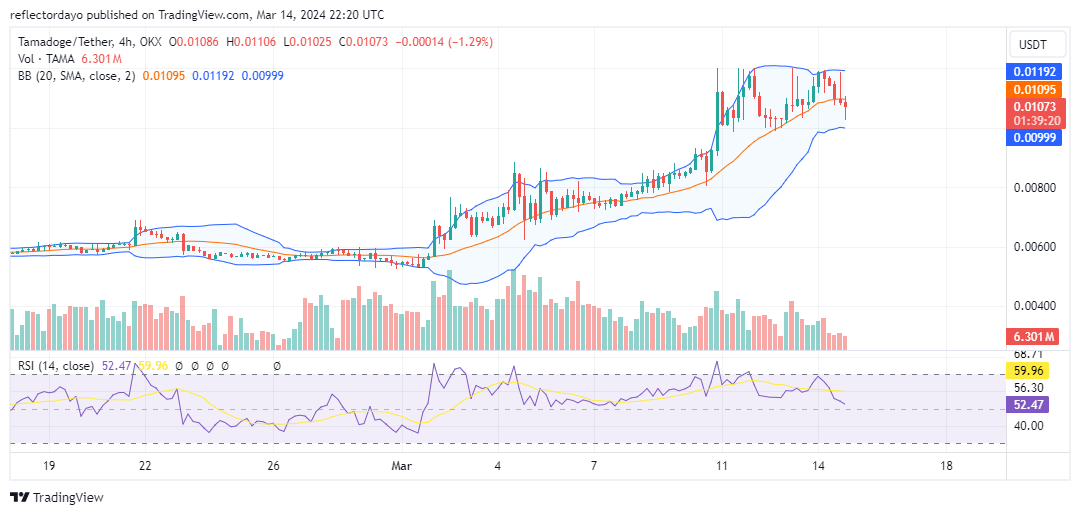
BTC/USD 4-hour Chart
The BTC/USD 4-hour chart showcases that the crypto trade is mooning, nurturing the momentum.

There have been moments when the stochastic oscillators have swerved erratically about variant points, producing an indecisive signal. The Bollinger Band trend lines have been able to extend somewhat to the north, emphasizing the area between the $70,000 and $75,000 marks. As a result, a sudden change in those values, either up or down, will signal future changes in either direction.

Note: Cryptosignals.org is not a financial advisor. Do your research before investing your funds in any financial asset or presented product or event. We are not responsible for your investing results.


You can purchase Lucky Block here. Buy LBLOCK

Tamadoge (TAMA/USD) Surges Past $0.010 Price Threshold

In our previous Tamadoge market analysis, we observed a gradual increase in buying pressure, pushing the price from $0.008 to $0.0085. This bullish momentum resulted in a decisive break above the resistance level at $0.0085, fueling further price gains and propelling the price above $0.010.

Key Levels

  • Resistance: $0.013, $0.014, and $0.015.
  • Support: $0.0045, $0.0040, and $0.0035.

Tamadoge (TAMA/USD) Surges Past $0.010 Price Threshold

TAMA/USD Price Analysis: The Indicators’ Point of View

The recent surge past the $0.0085 resistance level triggered a surge in the Tamadoge bullish sentiment. This momentum propelled the price towards the $0.012 mark. However, a subsequent correction emerged, with strong selling pressure pushing the price down. Buyers stepped in at the $0.010 level, establishing it as a crucial support level.

This price action has formed a rectangle pattern between $0.010 and $0.012, which typically indicates a period of consolidation.

Tamadoge (TAMA/USD) Surges Past $0.010 Price Threshold

Tamadoge Short-Term Outlook: 1-Hour Chart

Buyers and sellers are currently engaged in a tug-of-war around the $0.010 support and $0.012 resistance levels. This crypto signal is pointing to equilibrium. This equilibrium may lead to decreased volatility as trading volume contracts due to the balancing of buying and selling pressure. A breakout, hopefully in a bullish direction, could signal a continuation of the previous trend.

Buy TAMA/USD!

Do you want a coin that will be 100 times more valuable in the next few months? That is Tamadoge. Buy TAMA today!

Lucky Block Price Prediction: LBLOCK/USD Touches $0.000040 Low; More Buyers Will Play Out

Lucky Block Price Prediction – March 14

The Lucky Block price prediction reveals that LBLOCK heads to the south as more buyers are expected to enter the market soon.

LBLOCK/USD Medium-term Trend: Ranging (1D Chart)

Key Levels:

Resistance levels: $0.000070, $0.000072, $0.000074

Support levels: $0.000018, $0.000016, $0.000014

Lucky Block Price Prediction: LBLOCK/USD Touches $0.000040 Low; More Buyers Will Play Out
LBLOCKUSD – Daily Chart

LBLOCK/USD is trading below the 9-day and 21-day moving averages, this is for the market price to prepare for another bullish movement. However, the bulls are gathering momentum as new investors are expected to enter the market.

Lucky Block Price Prediction: LBLOCK/USD Will Head to the North

The Lucky Block price is trading around $0.000041 and it will break to the upside, any further bullish movement toward the upper boundary of the channel will push the Lucky Block price to the resistance levels of $0.000070, $0.000072, and $0.000074

Nevertheless, the market can become very cheap if the coin slides below the lower boundary of the channel, any further bearish movement could hit the supports at $0.000018, $0.000016, $0.000014. Moreover, the 9-day MA crosses below the 21-day MA, preparing the coin for the upward movement.

LBLOCK/USD Medium-term Trend: Ranging (4H Chart)

According to the 4-hour chart, the Lucky Block price keeps hovering below the 9-day and 21-day moving averages. Meanwhile, the long-term moving averages could push the coin to the north as the market is starting a new trend in the next positive direction.

Lucky Block Price Prediction: LBLOCK/USD Touches $0.000040 Low; More Buyers Will Play Out
LBLOCKUSD – 4-Hour Chart

However, if the buyers push the price above the moving averages, higher resistance could be located at $0.000052 and above while the 9-day moving average is expected to cross above the 21-day moving average. Moreover, should the bulls fail to move higher, the bears may increase the pressure, and the nearest support level could be located at $0.000033 and below.

You can purchase Lucky Block here. Buy LBLOCK

Solana Shines Despite Broader Crypto Market Downturn

As the cryptocurrency market records a sharp retracement following weeks of parabolic hikes, Solana remains unperturbed, launching into a fresh rally as it cleared the $174 top for the first time since January 2022.

Over the past 24 hours, Solana’s native token, SOL, has demonstrated remarkable strength, surging by 5% despite a 3.3% drop in the overall crypto market capitalization.

Solana Shines Despite Broader Crypto Market Downturn
SOLUSD Daily Chart

Memecoins Responsible for Surge in Solana

The surge in SOL’s value is not an isolated event but rather a testament to the growing significance of the Solana blockchain.

Memecoins, a unique feature of the Solana ecosystem, have played a pivotal role in driving this surge.

Memecoins such as Dogwifhat, Bonk, Myro, and Popcat have experienced significant gains, ranging from 15% to an astonishing 60%, in just one day. These memecoins, known for their lighthearted appeal and accessibility, have captured the attention of investors seeking novel opportunities in the cryptocurrency space.

According to Tristan Frizza, CEO of Zeta Markets, Solana’s performance reflects more than just speculation. Speaking to The Block, Frizza said:

“The blockchain’s ascent is not merely speculative—it’s rooted in genuine user engagement. Its potential has only been reinforced as we witness its transaction volumes and DeFi applications flourish.”

Indeed, Solana’s transaction volumes and decentralized finance (DeFi) applications have been flourishing, underscoring its potential and user engagement. The blockchain’s health, often measured by its active addresses, is also thriving, with daily active addresses soaring from approximately 660,000 in late February to 1.04 million on March 12, per data from The Block.

Solana Shines Despite Broader Crypto Market Downturn
Image via The Block

In contrast, Bitcoin, the largest cryptocurrency by market capitalization, has seen a 3.6% decline, trading at $70,450. This contrast highlights Solana’s impressive performance and resilience in a challenging market environment, positioning it as a prominent player in the cryptocurrency landscape.

When trading the crypto market, it doesn’t have to be “hit or miss.” Safeguard your portfolio with trades that actually yield results, just like our premium crypto signals on Telegram.


Interested in learning how to day trade crypto? Get all the information you need here

$SPONGE (SPONGE/USD) Bulls Assert Dominance, Firmly Establish Higher Support Level

In the recent $SPONGE market analysis, we observed heightened market volatility, which favored bearish sentiment, resulting in price stagnation below the $0.00008 level. Furthermore, our prior analysis indicated a consolidation of bullish activity around the $0.000061 mark. A closer examination of this crypto signal from 4-hour chart reveals a notable resurgence in bullish momentum, effectively reasserting an upward trajectory in the market.

Key Market Dynamics:

  • Resistance Levels: $0.0010, $0.0011, and $0.0012.
  • Support Levels: $0.000035, $0.000030, and $0.000025.

SPONGE (SPONGE/USD) Bulls Assert Dominance, Firmly Establish Higher Support Level

In-Depth Technical Analysis for $SPONGE (SPONGE/USD)

The bullish momentum within the $SPONGE market intensified significantly, leading to a test of the $0.00012 price threshold. However, this vigorous surge prompted substantial profit-taking, albeit ultimately resulting in the establishment of a reinforced support level near $0.000071. Despite the recent pronounced fluctuations, evident in the widening Bollinger Bands, the resilience displayed in securing a higher support level underscores the prevailing bullish sentiment within the market.

SPONGE (SPONGE/USD) Bulls Assert Dominance, Firmly Establish Higher Support Level

Insights from the 1-Hour Perspective

Upon examining the 1-hour chart, it’s evident that bearish attempts to breach the $0.000072 mark were rejected on multiple occasions. This reaffirms the strength of the support level, suggesting its sustainability. Notably, the recent volatility was effectively leveraged by the bulls to establish a higher pivotal price level. As volatility subsides, there’s a likelihood of a brief period of price stabilization before witnessing another upward movement, potentially solidifying $0.00008 as yet another higher support level.

Invest in SPONGE/USD and take advantage of the wave to advance.

Invest in the hottest and best meme coin. Buy Sponge ($SPONGE) today!

Dash 2 Trade Price Predictions for Today, March 14: D2TUSD Possible Reversal at the $0.00547 Support Level

Dash 2 Trade Price Forecast: D2TUSD Possible Reversal at the $0.00547 Support Level (March 14)
The market price of D2TUSD may experience a possible reversal at the $0.00547 support level to resume its upside moves soon. Thus, if buyers eventually wrestle trend control from sellers and rebound from the mentioned support, a breakout above the trend line is needed to confirm the potential Bull Run. By doing this, buyers will have a stronger foundation to extend this recovery. Therefore, a post-retest rally could push prices higher and reach the resistance trend level of $0.02000, which will enable the coin to continue to advance in the upside direction.

Key Levels:
Resistance levels: $0.00600, $0.00700, $0.00800
Support levels: $0.00400, $0.00350, $0.00300

D2T (USD) Long-term Trend: Bearish (4H)
Dash 2 Trade market today, indicates a downward trend with a bearish sentiment in its long-term perspective. The coin is trading below the two EMAs, due to the high bearish pressure on the crypto. However, the current trend will soon be nullified as the market has reached its exhaustion.
Dash 2 Trade Price Predictions for Today, March 14: D2TUSD Possible Reversal at the $0.00547 Support Level
The sustained bearish pressure at the $0.00578 support value has made the crypto price drop below the supply levels in its recent low.

The price of D2TUSD at the $0.00546 low value below the two EMAs as the 4-hour chart opens today is a result of low bullish momentum. Thus, traders who buy the coin during the bearish market will also make gains in the future.

Meanwhile, the daily stochastic which indicates an uptrend at the oversold region, means there is a possibility for a price reversal at the mentioned support.

As a result, the upcoming bullish rally may likely break the $0.00822 high mark which might hit the $0.02000 supply value in the coming days in the long-term outlook.

D2T (USD) Medium-term Trend: Bearish (1H)
The currency pair is trading in a bearish market in its medium-term outlook. This is due to the high influence of the sell traders on the crypto.
Dash 2 Trade Price Predictions for Today, March 14: D2TUSD Possible Reversal at the $0.00547 Support Level
Sustained pressure from the short traders to a $0.00578 low mark in the previous action has led the D2TUSD price below the supply levels in recent times.

The coin plummeted to the $0.00547 support level beneath the moving averages as the 1-hour chart resumes today. Nevertheless, today’s price drop has still not stalled the bull run as it remains intact. Traders might seize this opportunity to invest in the coin now at a lower rate for more potential gains in the future.

Thus, if the bulls can put extra effort into the price action, the price of Dash 2 Trade could turn positive and break above the $0.00741 supply mark, as a result of this, further selling pressure will be put into hibernation.

In continuation, the market price of D2TUSD is pointing upwards on the oversold region of the stochastic, this means that the selling pressure has reached an exhaustion, and the expected upside move in the price could be high at $0.02000, swing high in the coming days in its medium-term outlook.

Want a coin that has a huge potential for massive returns? That coin is Dash 2 Trade. Buy D2T now.

$SPONGE (SPONGE/USD) Bullish Momentum Resurges; Bulls Rally at $0.000061

The SPONGE/USD bull market has demonstrated notable advancement; nonetheless, as the market nears the $0.00008 price level, volatility has intensified. This surge in volatility has bolstered bearish resistance at the critical $0.00008 price threshold, leading to pronounced price swings. However, on March 12th, bulls marginally exceeded the $0.00006 price mark, revitalizing bullish sentiment and reigniting momentum towards the $0.00008 price level.

Key Market Dynamics:

  • Resistance Levels: $0.0010, $0.0011, and $0.0012.
  • Support Levels: $0.000035, $0.000030, and $0.000025.

SPONGE (SPONGE/USD) Bullish Momentum Resurges; Bulls Rally at $0.000061

In-Depth Technical Analysis for $SPONGE (SPONGE/USD)

Upon examining SPONGE/USD from the chart, it becomes evident that the volume of trade indicator has experienced a notable decrease. Additionally, price action appears to be stabilizing around the midpoint, indicative of an equilibrium level. These crypto signals suggest that the market may briefly consolidate at the current price level before a nuanced bullish momentum reasserts itself. The Moving Average Convergence and Divergence (MACD) indicator indicates weakening bearish momentum, despite the latest candlestick, an inverted hammer, signaling bearish sentiment. Nevertheless, the MACD’s negative histograms remain subdued, suggesting ongoing bullish activity striving to regain dominance in the market.

SPONGE (SPONGE/USD) Bullish Momentum Resurges; Bulls Rally at $0.000061

Insights from the 1-Hour Perspective

Analyzing the market from a 1-hour perspective reveals several promising indicators for bullish traders. Notably, the Bollinger Bands indicator suggests an equilibrium in the market. Furthermore, the formation of higher lows, coupled with price action flattening out and forming a doji after a notable bearish movement, is particularly noteworthy. The presence of the doji around the $0.000067 price level indicates a potential emergence of bullish pressure, possibly leading to the establishment of another higher support level.

Buy SPONGE/USD!

Invest in the hottest and best meme coin. Buy Sponge ($SPONGE) today!

Ethereum Launches “Dencun” Upgrade: A Leap Forward for Layer-2 Networks

In a major development for the blockchain industry, Ethereum has successfully activated its highly-anticipated “Dencun” upgrade. This upgrade is expected to drive growth across layer-2 networks like Arbitrum and Polygon by significantly reducing data fees.

The activation of the Dencun upgrade, which is technically a hard fork, took place at Ethereum epoch 269,568, starting at 13:55 UTC and completing by 14:10 UTC. Despite this milestone, the price of ether (ETH), Ethereum’s native cryptocurrency, saw a minor increase of 0.41% to $3,996 over the last day, following a remarkable 50% surge in the past month.

Ethereum Launches "Dencun" Upgrade: A Leap Forward for Layer-2 Networks
ETHUSD Daily Chart

One of the key features of the Dencun upgrade is the introduction of “blobs,” a new method for data storage on the blockchain. These blobs provide a dedicated and cost-effective space separate from standard transactions.

This upgrade, the most significant for Ethereum in almost a year, marks a pivotal moment in its history. It signals a new era in addressing the platform’s high transaction fees and could spark a competitive race among prominent layer-2 networks to utilize the enhancements for blockchain scaling.

At the core of the upgrade is “proto-danksharding,” a new transaction category that will store data on Ethereum through these data blobs.

Ethereum Dencun Will Benefit Other Layer-2 Networks

While direct Ethereum users may not be the primary beneficiaries of this upgrade, layer-2 networks like Arbitrum, Optimism, and Polygon stand to gain the most. These networks improve Ethereum’s scalability by consolidating user transactions and settling them on the main blockchain in large batches.

The Dencun upgrade represents the first step in Ethereum’s ambitious journey to implement “sharding,” a technology that aims to break the blockchain into smaller segments, or mini-shards, to enable a higher volume of transactions at a lower cost.

While the full implementation of sharding is still in the works, the interim solution of proto-danksharding provided by Dencun is a promising step toward reducing Ethereum’s high gas fees.

When trading the crypto market, it doesn’t have to be “hit or miss.” Safeguard your portfolio with trades that actually yield results, just like our premium crypto signals on Telegram.


Interested in learning how to day trade crypto? Get all the information you need here

Chiliz (CHZUSD) Buyers Struggle to Get a Refill 

Market Analysis – The Sellers Try to Change the Tide 

Chiliz buyers struggle to get a refill after sellers have been putting in effort this week. Recent market trends have shown that CHZUSD buyers are facing challenges in getting a refill. The crypto price has been gradually shifting towards a sell response, causing buyers to struggle at the $0.167000 price level. For the second time this month, the crypto price of Chiliz has been stuck at the $0.167000 key level. Earlier in the month, the bulls were in control, with the price appreciating from the $0.0915000 key level. 

CHZUSD Significant Zones

Resistance Zones: $0.167000, $0.14360000 
Support Zones: $0.0969000, $0.0915000

Chiliz (CHZUSD) Buyers Struggle to Get a Refill 

The momentum indicator showed a strong spike as buyers made solid progress, even reaching levels not seen since March. However, after reaching the $0.167000 key level, the momentum indicator started swinging lower, indicating a potential shift in market sentiment especially for the bears.

Chiliz (CHZUSD) Buyers Struggle to Get a Refill 

Market Expectation 

Currently, the bears are navigating the Chiliz market, pushing for lower prices this week. A successful pushback from the bears could ignite a breakout below the significant $0.1436000 level. Despite this bearish pressure, it is important to note that the overall bullish trend in Chiliz is still unfolding.

The Moving Average crossing has yet to indicate a solid crossover, suggesting that there may still be opportunities for buyers in the market. Traders who are looking to enter the Chiliz market during this period of uncertainty can benefit from using the best forex signals

You can purchase Lucky Block here.  Buy LBLOCK

Note: Cryptosignals.org is not a financial advisor. Do your research before investing your funds in any financial asset or presented product or event. We are not responsible for your investing results.