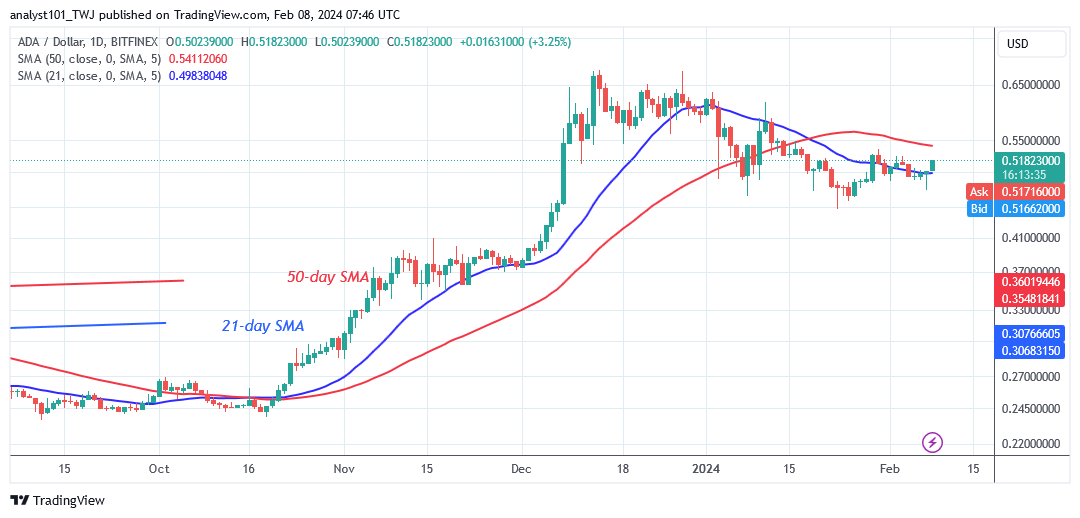
Cardano (ADA) Price Long-Term Forecast: Bearish Cardano’s (ADA) price has broken above the 21-day Simple Moving Average but falters below the peak of $0.55. Since January 8, the altcoin has been declining above the $0.46 support level and below the moving average lines. The cryptocurrency’s price has broken through the 21-day $MA, and the positive momentum is extending to the 50-day $MA.
In other words, the ADA price is above the 21-day SMA but below the 50-day moving average. Cardano is now trading at $0.54 at the time of writing. On the upside, if the cryptocurrency price rises above the 50-day $MA, the bullish trend will resume. Bullish momentum will continue to the highs of $0.65 and $0.67.
If Cardano does not surpass the 50-day $MA, it will become caught between the moving average lines. In other words, the altcoin will trade at prices ranging from $0.48 to $0.55.
ADA/USD – Daily Chart
Technical Indicators: Major supply zones: $1.0, $1.05, $1.10 Major demand zones: $0.25, $0.20, $0.15
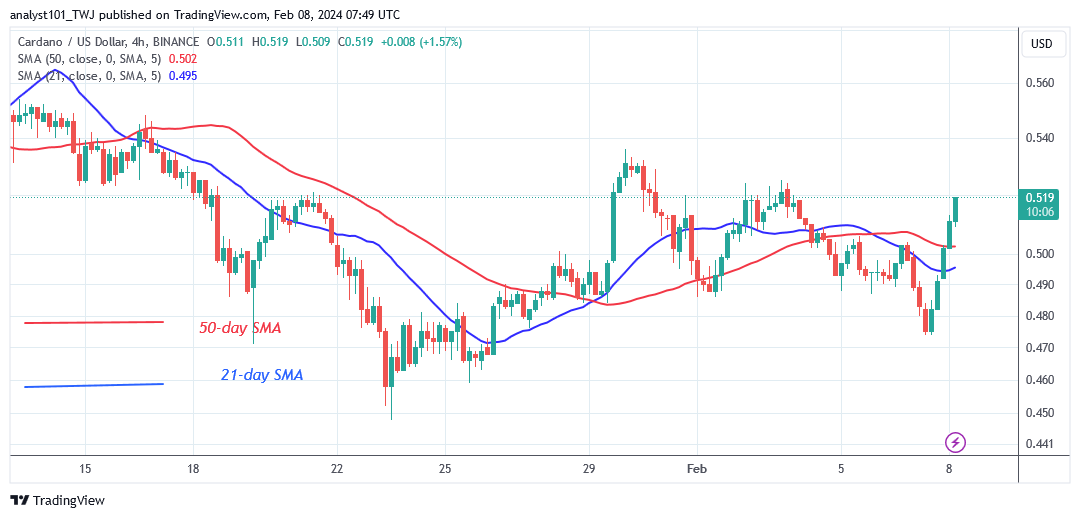
Cardano (ADA) Indicator Analysis Given the recent price rise, ADA’s price is now between the moving average lines. The altcoin will be locked in if its price is unable to breach the 50-day moving average. The crypto’s price will be forced to vary for a few days. The moving average lines are sloping horizontally as the downturn ends.
What Is the Next Move for Cardano (ADA)? Cardano’s upward momentum has slowed but falters below the peak of $0.55. In a similar vein, the price of cryptocurrencies hit a resistance level on January 30 at $0.53 but was rejected. Currently, the crypto’s signal is expected to be negative as the altcoin is rejected at the $0.55 resistance zone. The altcoin will trend when the moving average lines are crossed.
Note:Cryptosignals.org is not a financial advisor. Do your research before investing your funds in any financial asset or presented product or event. We are not responsible for your investing results
Enjin coin sideways motion continues as market traders await momentum. The price of the ENJUSD has been reluctant to make significant movements for weeks, lacking the momentum needed for a substantial slide or surge. Traders have been waiting for the market to regain a solid rhythm, but so far, the coin has been struggling to find a clear direction.
Enjin Coin started the year with a dip in price, as sellers easily breached the key level of $0.340200. The sell pressure intensified, pushing the price down to a significant level of $0.251500. However, buyers recognized the need for a reversal and attempted to regain control. Despite their efforts, the bulls have not yet gained enough momentum to fully recover. As a result, the Enjin market has been rolling in accumulation for several days, extending into the new month.
ENJUSD Key Levels
Resistance Levels: $0.428000, $0.340200 Support Levels: $0.251500, $0.202500
The Money Flow Index (MFI) on the daily chart for Enjin Coin indicates a bearish sentiment, as it runs deep below the 40.00 level. This suggests that buyers are currently exerting minimal pressure on the market, leading to consolidation. Additionally, the Moving Average crossing has not yet formed a golden cross, indicating a lack of a clear trend for ENJUSD
To navigate the current market conditions and identify potential entry and exit points, traders can benefit from utilizing the best forex signals. These signals provide valuable insights and analysis from experts in the field, helping traders make informed decisions. By leveraging the power of forex signals, traders can identify potential places to place orders in the market. This will increase their chances of success.
Market Expectation
In shorter time frames, the Enjin Coin market continues to move at a slow pace. The struggle between buyers and sellers persists, with sellers attempting to take further control. Traders should remain cautious and closely monitor the market for any signs of a breakout or reversal.
Note:Cryptosignals.org is not a financial advisor. Do your research before investing your funds in any financial asset or presented product or event. We are not responsible for your investing results.
Chiliz Sellers Are Gradually Gain Strength. Chiliz is currently experiencing a shift in market dynamics as sellers gain more strength. The crypto market is taking another turn as we enter the new month. After struggling to maintain support below the significant level of $0.1026700, the buyers have pulled out, leaving room for the sellers to dominate. This week, there have been numerous sell indications, indicating a potential overwhelming of the market.
CHZUSD Key Levels
Resistance Levels: $0.117380, $0.1026000 Support Levels: $0.089430, $0.077900
In the previous month, the buyers showcased their strength by pushing the price up from the significant level of $0.80000. They managed to break through other significant levels, trading up to a high of $0.117300 before eventually pulling back. Towards the end of January, the crypto price flipped back and broke through the $0.1026700 level once again.
The Moving Average crossing indicator is showing strong potential for another golden cross, which is a bullish signal. If this materializes in favor of the buyers, we can expect to see further development and potential upward movement in the price. However, if sellers persist and the price remains below the $0.1026700 significant level, we may witness more breakthroughs to the downside.
Market Expectation
The Money Flow Index (MFI) measures the rate at which money is flowing into or out of a particular asset. It ranges from 0 to 100, with a reading below 40 typically indicating selling pressure. In this case, the MFI is close to breaching the 40.00 level, suggesting that selling pressure is increasing. This could potentially lead to further downward movement in the price of chiliz.
To navigate the market effectively, traders can benefit from utilizing the best crypto signals. This can provide valuable insights and potentially give them an edge over others. These signals can help identify profitable trading opportunities.
Note:Cryptosignals.org is not a financial advisor. Do your research before investing your funds in any financial asset or presented product or event. We are not responsible for your investing results.
Market Analysis – ApeCoin Sellers Continue to Slide
ApeCoin (APEUSD) price momentum is still losing ground as the struggle between market traders for dominance intensifies. The bulls initiated an offensive movement last week, as the price made a U-turn above the significant level of $1.2900. However, their momentum was cut short as they failed to breach the key level of $1.5390.
APEUSD Key Levels
Resistance Levels: $1.8540, $1.5390 Support Levels: $1.2190, $0.9840
In contrast, the sell traders have shown strong dominance this year, although buyers have made attempts to correct the price at certain points. Since the beginning of the new month, the sellers have taken charge, maintaining a sell streak for the past three days. As their momentum increases, sellers may charge lower towards the significant level of $0.12900.
The Stochastic Oscillator, a technical indicator, suggests that sellers are assuming charge again. A further cross below the mid-range indicates growing selling pressure. Additionally, the Moving Average crossing has yet to spread out and dictate a strong swing. More spreading of this indicator will suggest a strong bearish continuation in the market.
Market Expectation
In this short time frame, the struggle between buyers and sellers remains. The bears are looking to brace down following the accumulation of selling pressure. The Stochastic Oscillator is in the oversold region as the price is currently accumulating strength. The struggle however remains between the market traders but sellers sellers are looking forward to more slide lower on APEUSD.
Note: Cryptosignals.org is not a financial advisor. Do your research before investing your funds in any financial asset or presented product or event. We are not responsible for your investing results.
Technical Indicators: Major supply zones: $1.0, $1.05, $1.10 Major demand zones: $0.25, $0.20, $0.15
Cardano (ADA) Price Long-Term Forecast: Bearish Cardano’s (ADA) price has broken above the 21-day Simple Moving Average but falters below the peak of $0.55. Since January 8, the altcoin has been declining above the $0.46 support level and below the moving average lines. The cryptocurrency’s price has broken through the 21-day $MA, and the positive momentum is extending to the 50-day $MA. In other words, the ADA price is above the 21-day SMA but below the 50-day moving average. Cardano is now trading at $0.54 at the time of writing. On the upside, if the cryptocurrency price rises above the 50-day $MA, the bullish trend will resume. Bullish momentum will continue to the highs of $0.65 and $0.67. If Cardano does not surpass the 50-day $MA, it will become caught between the moving average lines. In other words, the altcoin will trade at prices ranging from $0.48 to $0.55.
Cardano (ADA) Indicator Analysis Given the recent price rise, ADA’s price is now between the moving average lines. The altcoin will be locked in if its price is unable to breach the 50-day moving average. The crypto’s price will be forced to vary for a few days. The moving average lines are sloping horizontally as the downturn ends.
What Is the Next Move for Cardano (ADA)? Cardano’s upward momentum has slowed but falters below the peak of $0.55. In a similar vein, the price of cryptocurrencies hit a resistance level on January 30 at $0.53 but was rejected. Currently, the crypto’s signal is expected to be negative as the altcoin is rejected at the $0.55 resistance zone. The altcoin will trend when the moving average lines are crossed.
You can purchase crypto coins here. Buy LBLOCK
Note: Cryptosignals.org is not a financial advisor. Do your research before investing your funds in any financial asset or presented product or event. We are not responsible for your investing results
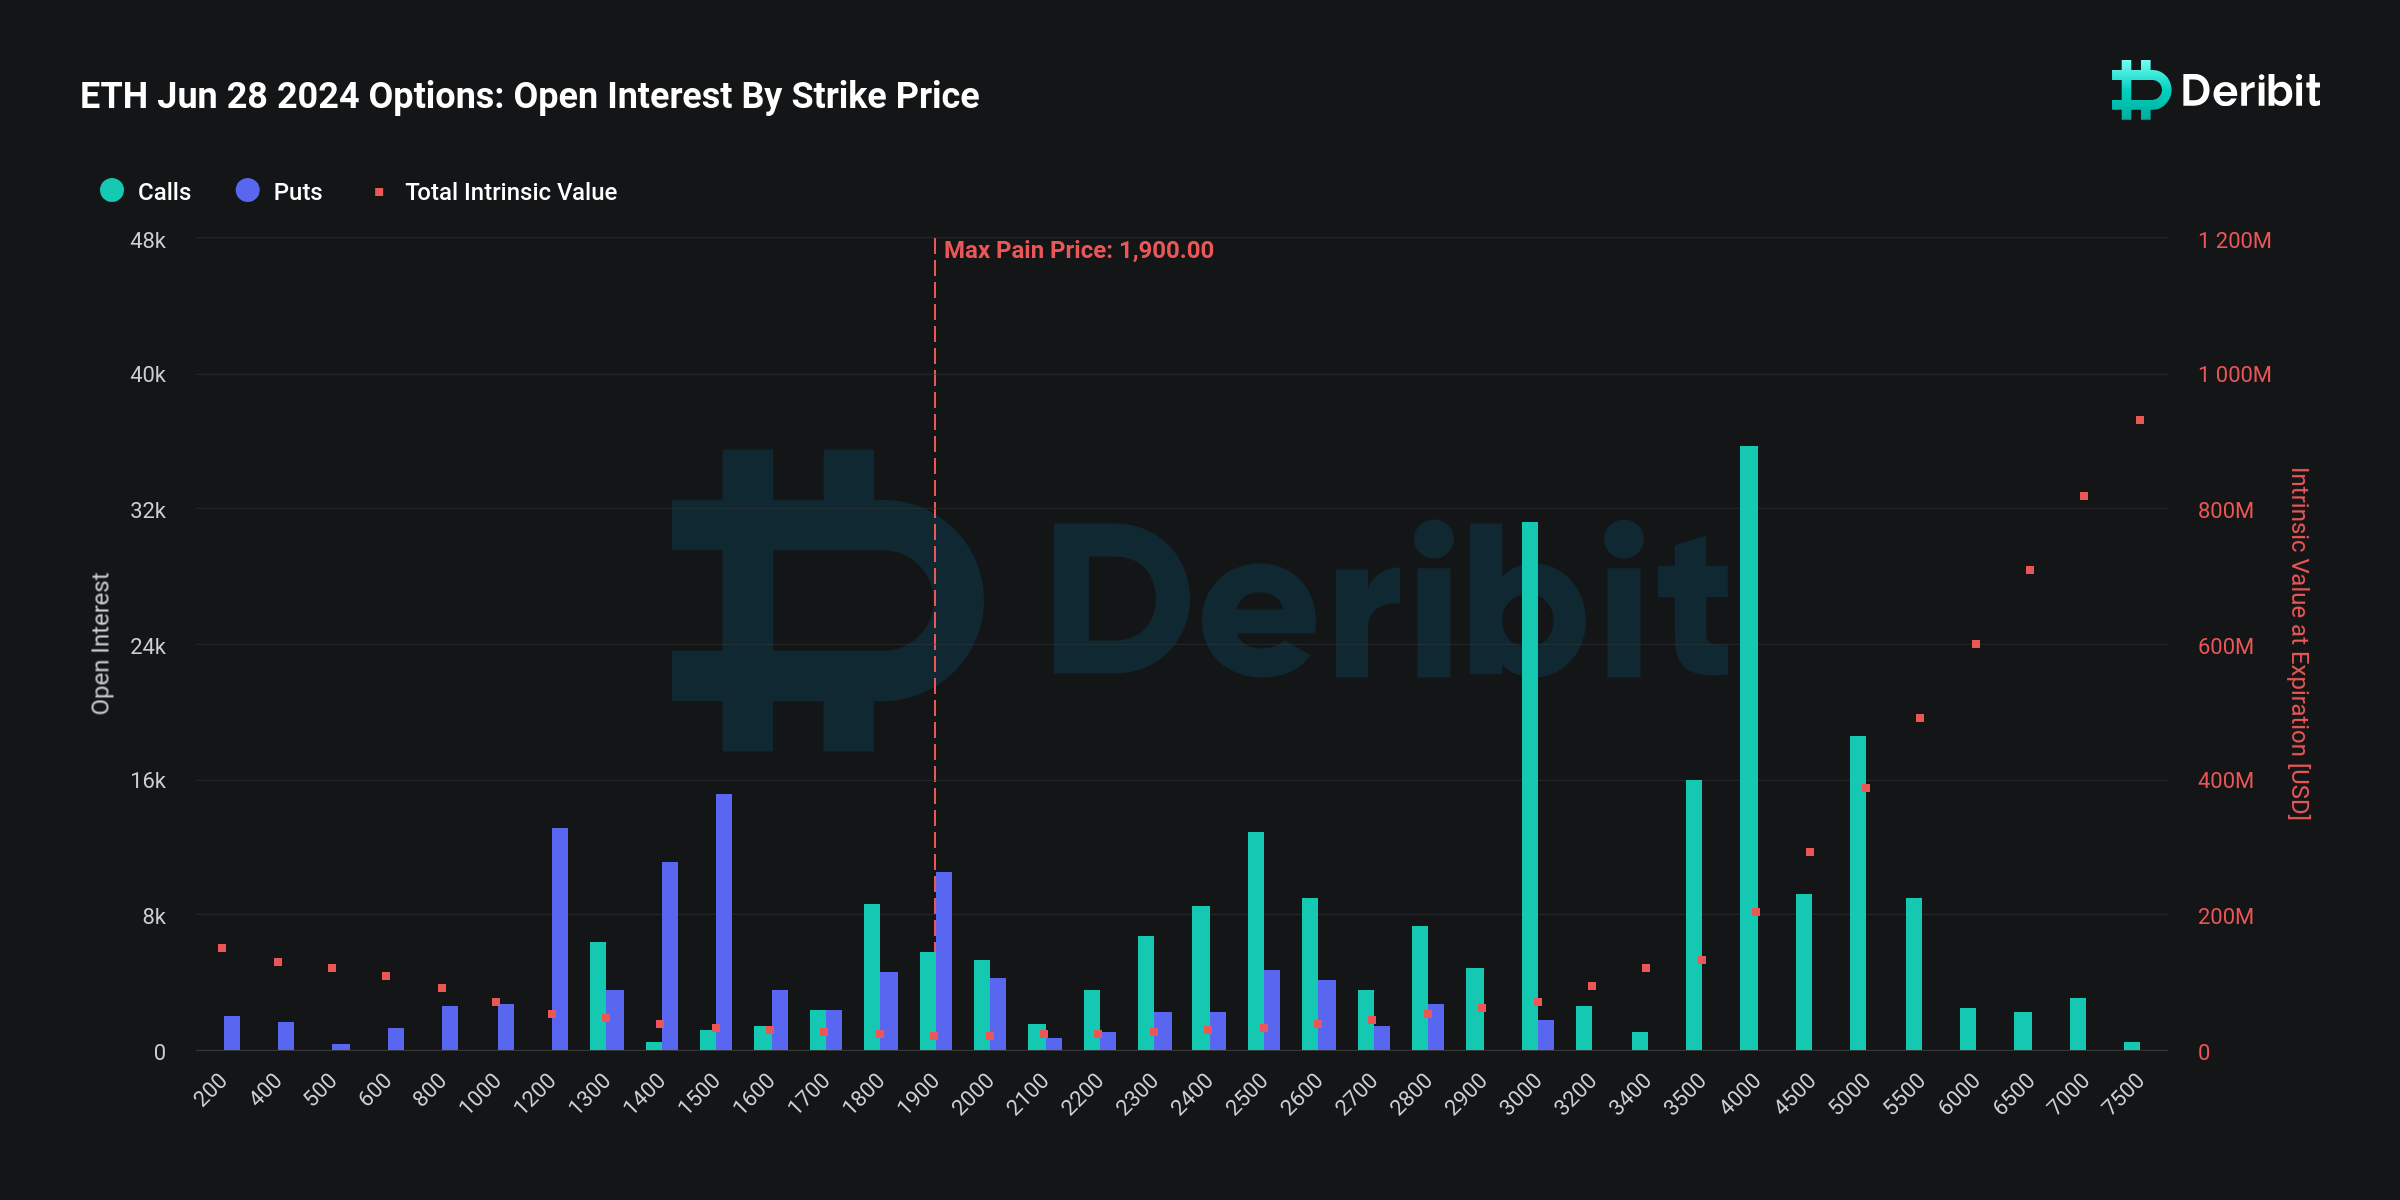
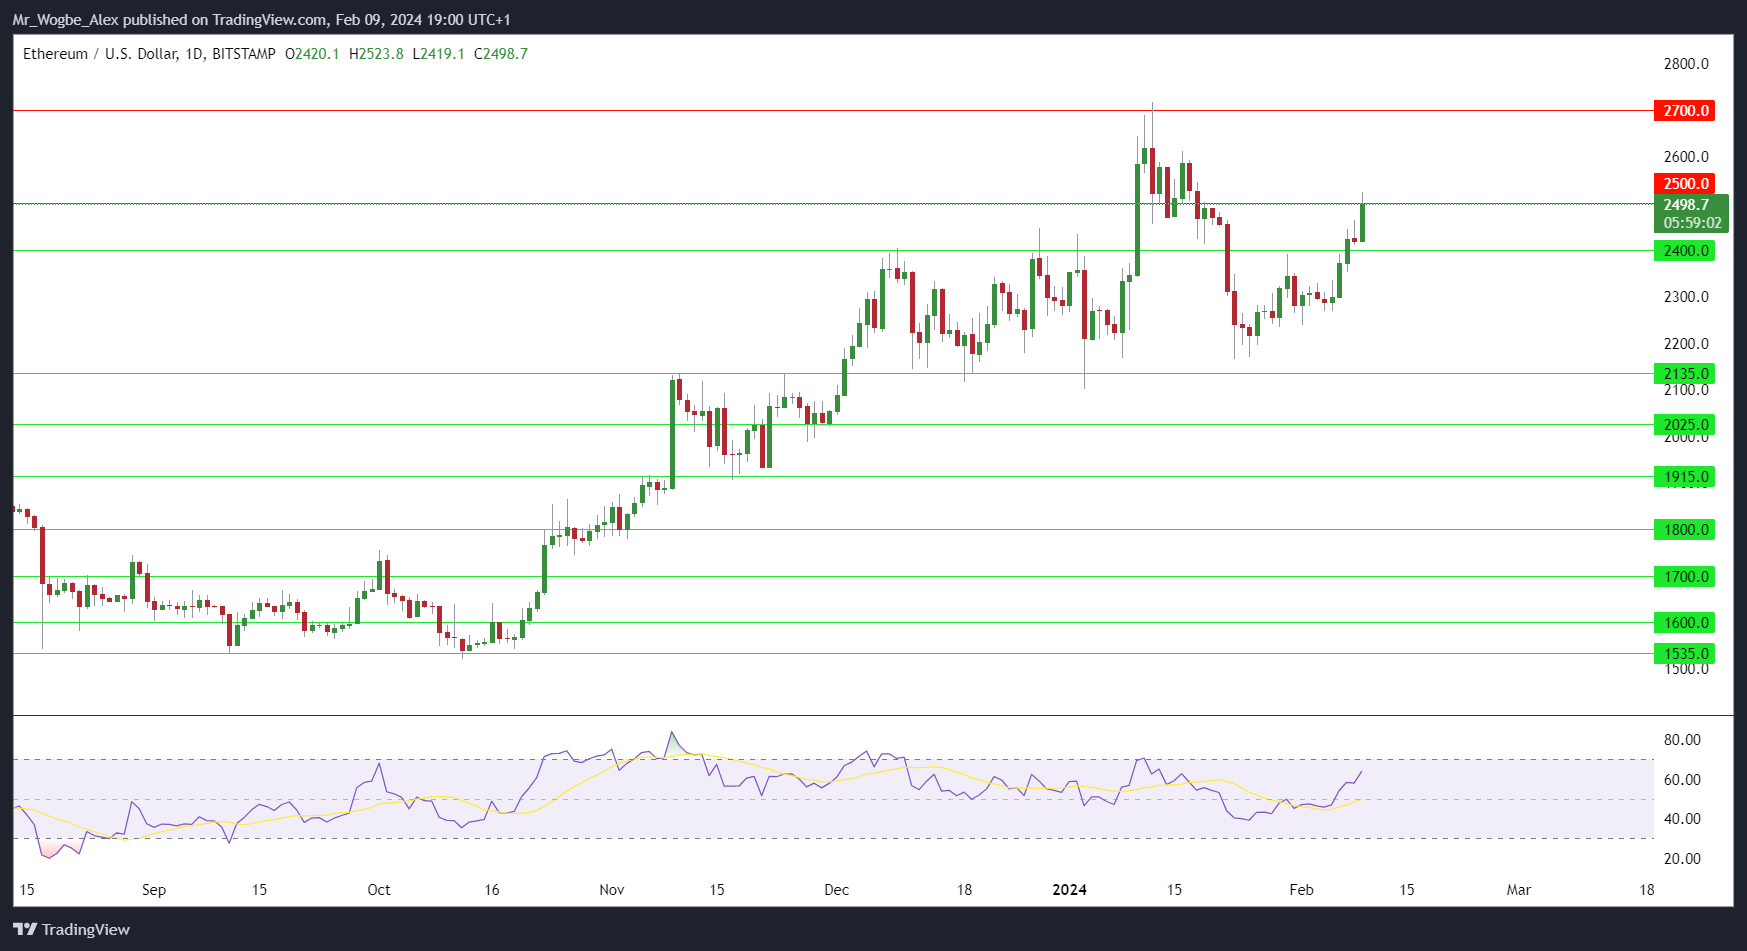
Ethereum, the second-largest cryptocurrency globally, is witnessing a surge in demand among options traders, anticipating its price to hit $4,000 by June or September.
Options, essentially contracts granting the buyer the right (but not the obligation) to buy or sell an underlying asset at a specified price and time, are driving bullish sentiments in the market.
Call options, indicative of bullish bets, speculate that the asset’s price will surpass the strike price, while put options, representing bearish bets, anticipate the price to drop below the strike price.
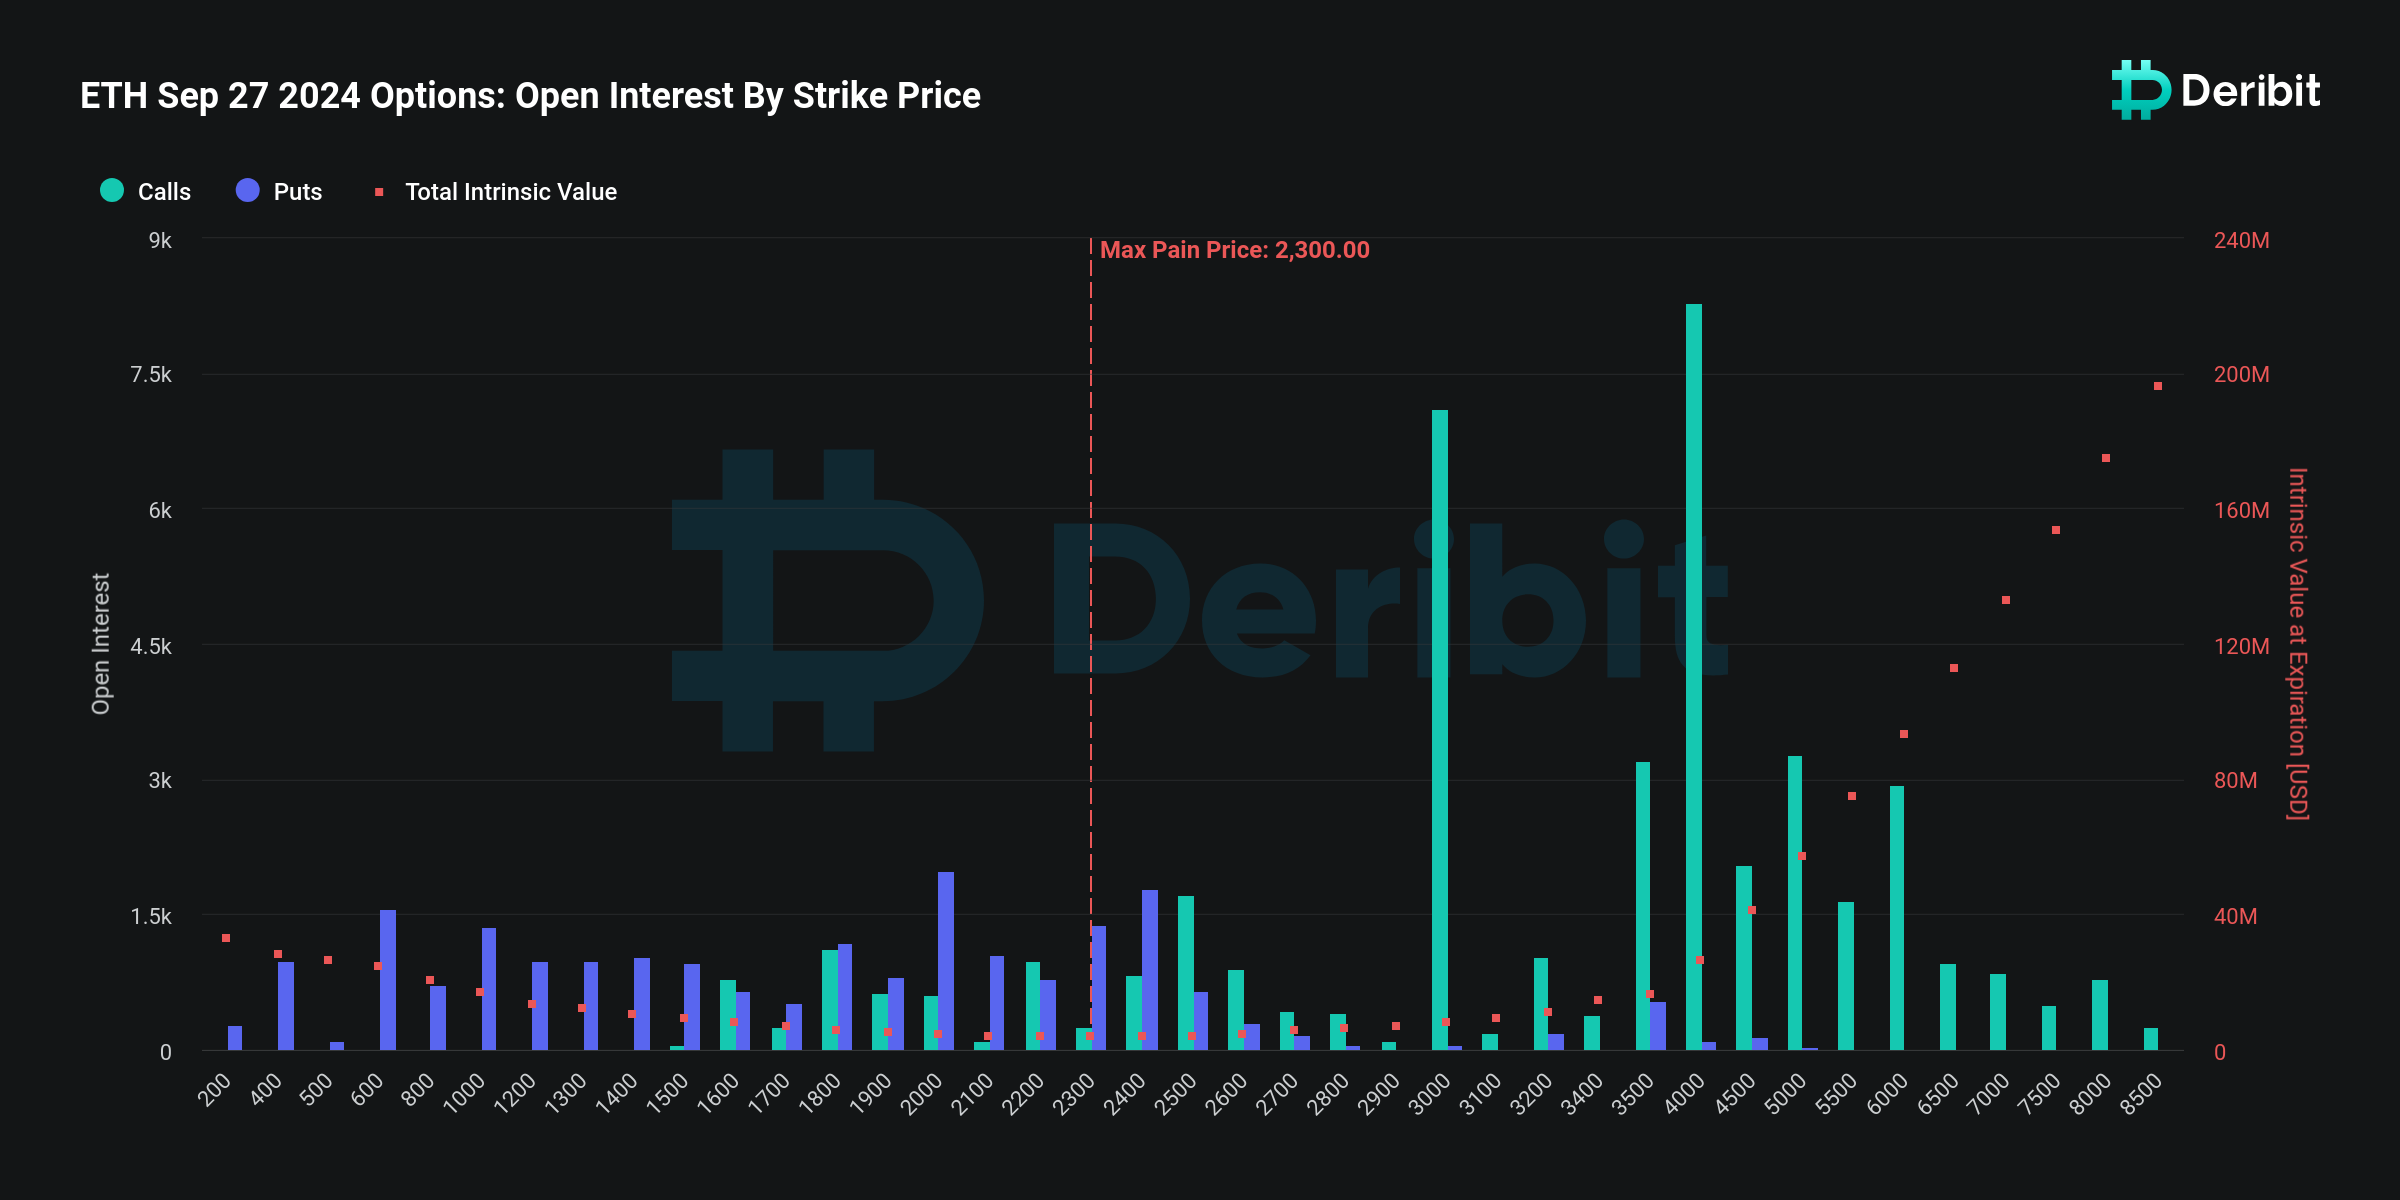
Data sourced from Deribit, the largest cryptocurrency options exchange, reveals that the $4,000 strike price stands as the top choice among ether call options for both June and September expiries. Deribit Chief Commercial Officer Luuk Strijers told The Block that this shows significant interest or expectation from the market participants.
Image via Deribit
The $4,000 target reflects a near doubling of ether’s current price, which experienced a 3% surge on Friday, hovering just below $2,500.
The bullish sentiment surrounding ether is fueled by the prospects of a spot Ethereum ETF approval by the U.S. Securities and Exchange Commission (SEC) by May’s end. A spot ETF would empower investors to directly trade ether via a regulated platform, bypassing intermediaries or custody solutions.
While the SEC faces applications for spot ether ETFs from asset managers VanEck and Ark/21Shares, with a final decision due by May 23, Deribit’s Strijers warns against prematurely linking options activity solely to ETF news.
Factors like impending network upgrades, competition from rival blockchains, and Bitcoin’s correlation could sway Ethereum’s price trajectory.
For those intrigued by Ethereum and other cryptocurrencies, our crypto signals service offers timely and accurate market insights and trading tips, facilitating informed trading decisions.
Want to learn about the best crypto staking platforms? Click here
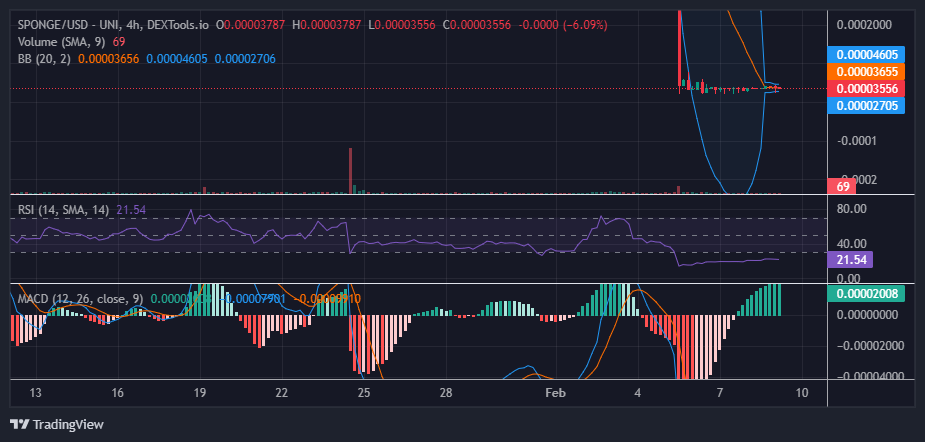
The $SPONGE market is currently poised for a significant rebound, with its price hovering around $0.000035. This presents an ideal opportunity for investors to capitalize on the market’s potential resurgence. Seizing this favorable moment could optimize returns. Given that the market has reached $0.000035, a level from which $SPONGE began its trajectory last year, this suggests a promising upside direction. Buying at this level thus offers the potential for substantial returns.
Key Market Dynamics:
Resistance Levels: $0.0010, $0.0011, and $0.0012.
Support Levels: $0.00040, $0.00035, and $0.00030.
In-Depth Technical Analysis for $SPONGE (SPONGE/USD)
The Relative Strength Index (RSI) has persistently remained below the 30 level for some time now, but a gradual price ascent and recovery of the RSI line are noticeable, with a minor shift from level 17 to 21, indicating substantial gains in bullish momentum. Moreover, the Moving Average Convergence and Divergence (MACD) indicator suggests a possible bullish shift. The negative histograms have transformed and transitioned to green ones, signaling the strengthening of bullish momentum in the $SPONGE market, although not yet evident from the price action on the chart.
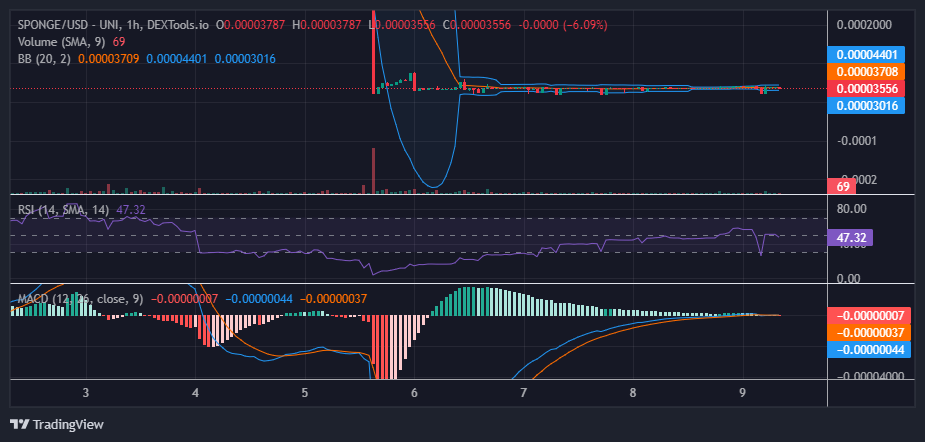
Insights from the 1-Hour Perspective:
The price channel has significantly narrowed, aligning closely with the flat price action and predominantly tracking the 20-day moving average. This market dynamic has persisted over a prolonged period. These conditions continue to suggest an imminent bullish breakout. Indicators from this perspective indicate that the market is currently at equilibrium. The Moving Average Convergence and Divergence present a robust crypto signal, supporting the notion of significant indecision within the market at this juncture.
In the ever-fluctuating realm of cryptocurrency, strategic foresight is the linchpin that separates triumph from defeat. Despite the tumultuous nature of coins like Bitcoin and Ethereum, which often confound traders with their capricious price swings, astute market maneuvers and well-informed investments can yield substantial returns. Central to this approach is technical analysis, empowering investors to swiftly discern patterns and make informed decisions.
But how does one engage in technical analysis, and to what extent does it influence portfolio performance?
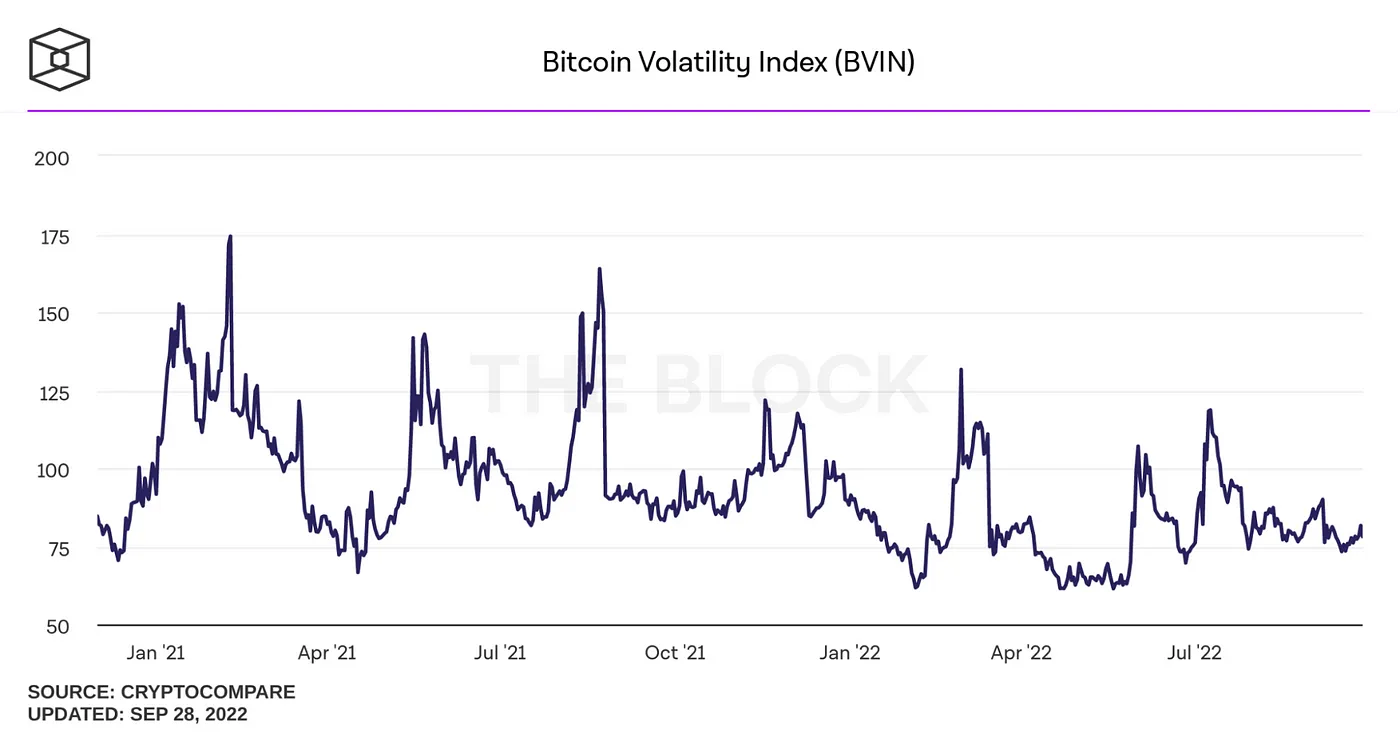
Bitcoin’s Volatility Index (BVIN) vividly illustrates the asset’s susceptibility to dramatic price fluctuations, surpassing those of traditional stocks and shares by multiples. While comprehending these rapid oscillations may pose a challenge, technical analysis serves as a beacon, aiding investors in recognizing impending movements.
With this in consideration, let’s delve into how investors can leverage technical analysis to delve deeper into cryptocurrency performance, facilitating the identification and anticipation of future trends.
Factors Influencing Cryptocurrency Prices
Before dissecting the technical indicators pertinent to cryptocurrencies, it’s imperative to grasp the myriad factors influencing asset prices and performance.
Supply and demand stand as paramount considerations for investors. Bitcoin, for instance, is programmed with a finite circulation of 21 million coins, with approximately 19.1 million currently in circulation. Moreover, Bitcoin’s issuance to miners undergoes a halving every four years, rendering it increasingly scarce over time.
Diverse coins boast varying issuance limits, if any. Consequently, assessing supply is pivotal, as a higher circulation typically correlates with a lower asset value. Assets with high circulation necessitate substantial trading volumes to instigate meaningful price surges.
Furthermore, investors must factor in the myriad applications and underlying projects of cryptocurrencies, along with technological developments, all of which can significantly impact price rallies. For instance, Ethereum experienced a recent price fluctuation following its merger event.
Regulatory shifts can also exert substantial influence on asset prices. Bitcoin, for instance, faced adversity following bans in China, while XRP weathered extreme price volatility following the SEC’s 2020 lawsuit.
While deciphering the factors influencing cryptocurrency prices may prove daunting, astute analysis enables investors to discern trends and anticipate future movements effectively.
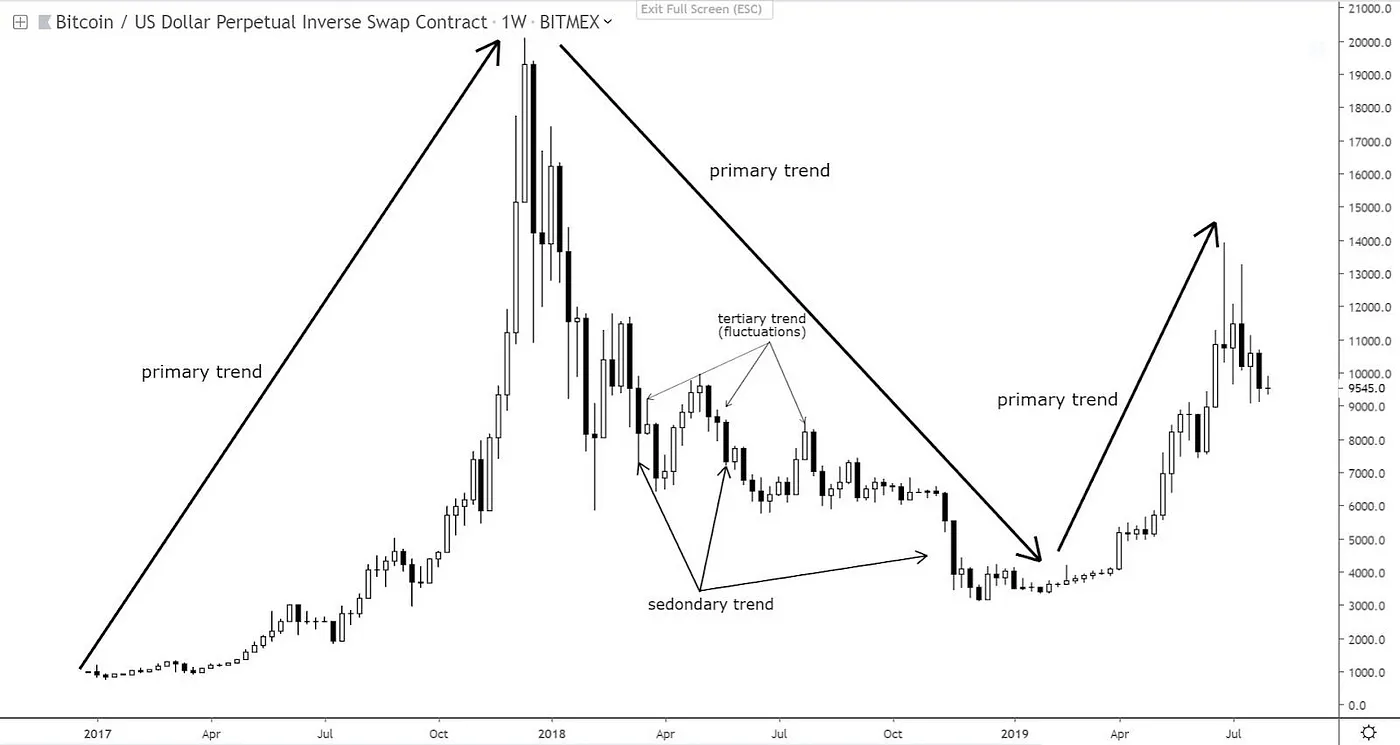
Understanding Primary, Secondary, and Tertiary Trends in Cryptocurrency Markets
Per Dow’s theory, markets, including the cryptocurrency market, exhibit three types of trends. Primary trends denote significant market movements lasting months or years, while secondary trends can counter primary ones, indicating pullbacks within bull markets or temporary opposing movements.
Investors should also consider tertiary trends, fleeting movements lasting about a week. These are often viewed as market noise and are disregarded by long-term investors.
Primary trends, such as bull and bear markets, warrant the highest respect from investors, while secondary trends offer opportunities for short-term gains by going against the trend strategically.
Primary trends typically unfold in three phases, presenting opportunities for investors. The first phase involves accumulation in bull markets or distribution in bear markets, signaling a shift in market sentiment and allowing early anticipation of price movements.
The second phase sees broader market participation as price movements gain momentum, followed by the excess phase in bull markets and the panic phase in bear markets, where investors speculate on movements as the phase nears its end. Being proactive during these phases can lead to advantageous positions ahead of the wider market.
Utilizing Data for Informed Predictions
Investors can leverage this data to gain insights into crypto assets, identify support and resistance levels, and indicate price bottoms or peaks.
Identifying resistance levels allows investors to use stop-loss orders to mitigate losses if the asset falls below these levels, preventing significant losses.
Various tools like the Average Directional Index, Bollinger Bands, Relative Strength Index (RSI), or standard deviation can aid traders in making informed decisions.
Additionally, utilizing chart templates from platforms like PoweredTemplate can transform raw data into actionable insights or facilitate collaboration with peers.
Despite the crypto market’s volatility, strong technical analysis enables investors to identify trends swiftly and respond to price movements promptly. Monitoring candlestick patterns, identifying primary trend phases, and investing responsibly contribute to building a robust portfolio.
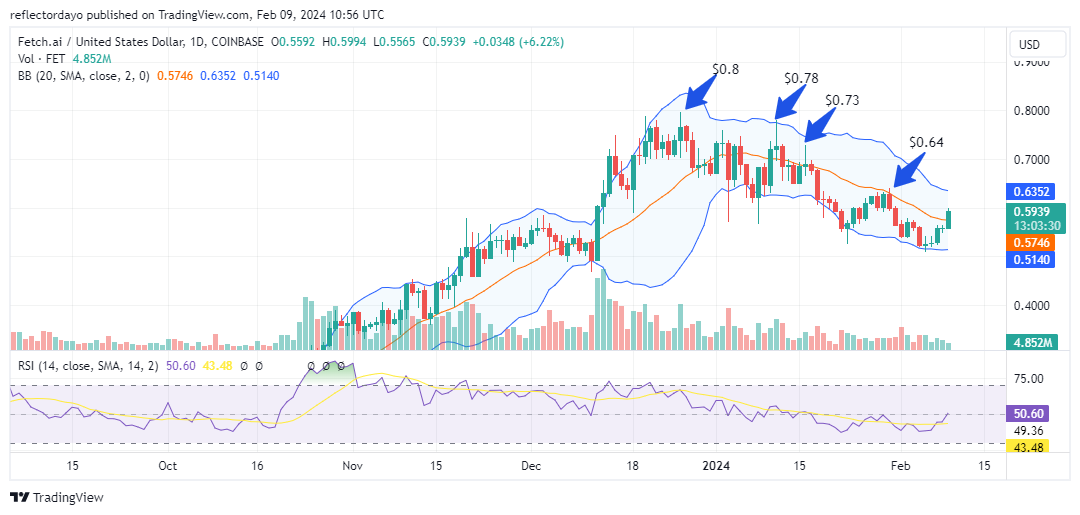
Following its peak at $0.80 on December 26, the Fetch.ai market has entered a bearish trend, characterized by a series of lower highs. Notable instances include $0.78 on January 11, $0.73 on January 14, and $0.64 on January 31. However, around the $0.50 support level, a notable confrontation between supply and demand ensued, culminating in a swift bullish breakout.
Fetch.ai Market Data
FET/USD Price Now: $0.59
FET/USD Market Cap: $48 million
FET/USD Circulating Supply: 831 million FET
FET/USD Total Supply: 1.2 billion FET
FET/USD CoinMarketCap Ranking: #112
Key Levels
Resistance: $0.60, $0.63, and $0.70.
Support: $0.52, $0.50, and $0.45.
The Fetch.ai Market Analysis: The Indicators’ Point of View
Upon analyzing the chart, we observed a diminishing bullish momentum coinciding with the formation of new lower highs in the market. At the $0.60 price level, there was a noticeable decrease in overall trading volume, indicating a waning interest from both bullish and bearish traders. The crypto signal from the analysis suggests a decline in investor engagement. However, as the market approached the $0.50 price level, buying interest emerged among traders. Consequently, bullish sentiment prevailed, triggering a significant price rally.
Currently, attention is focused on overcoming the $0.600 resistance level, which may pose a challenge given the relatively modest height of the volume histograms according to the volume indicator.
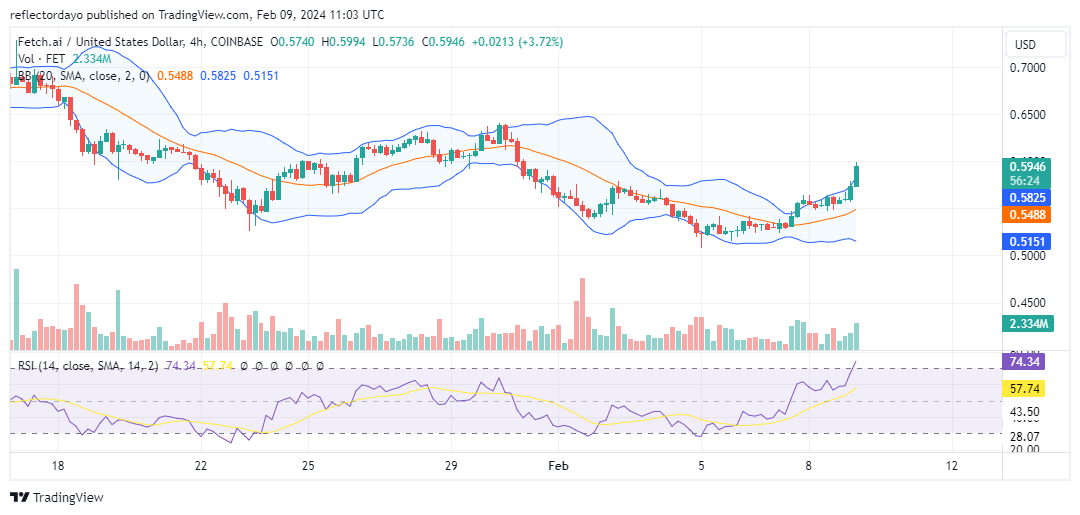
FET/USD 4-Hour Chart Outlook
Upon examining a smaller timeframe, the volume of trade histogram appears noteworthy, aligning with the current bullish market sentiment. Nonetheless, we observed the presence of bearish sentiment indicated by an upper shadow on the bullish candlestick at the $0.600 price level. Should bulls fail to secure a breakout beyond this point, a potential scenario could involve price consolidation near the $0.600 level to establish a robust foundation for overcoming bearish resistance.