The crypto market is booming as crypto inflows into digital asset investment products surge dramatically, especially the new spot-based Bitcoin ETFs in the US.
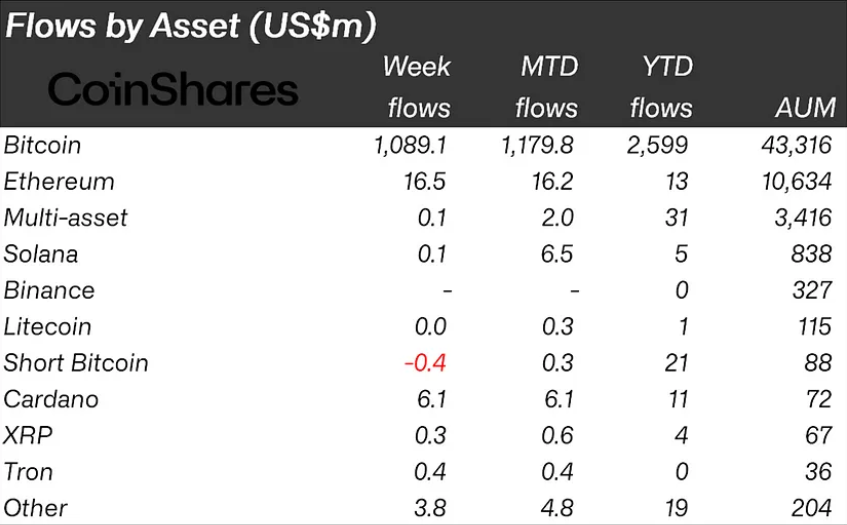
According to CoinShares, a leading digital asset manager, crypto inflows totaled $1.1 billion last week, bringing the year-to-date inflows to $2.7 billion. This also pushed the total assets under management (AuM) to $59 billion, the highest level since early 2022.
Bitcoin Dominates in Crypto Inflows, Accounts for Almost 98%
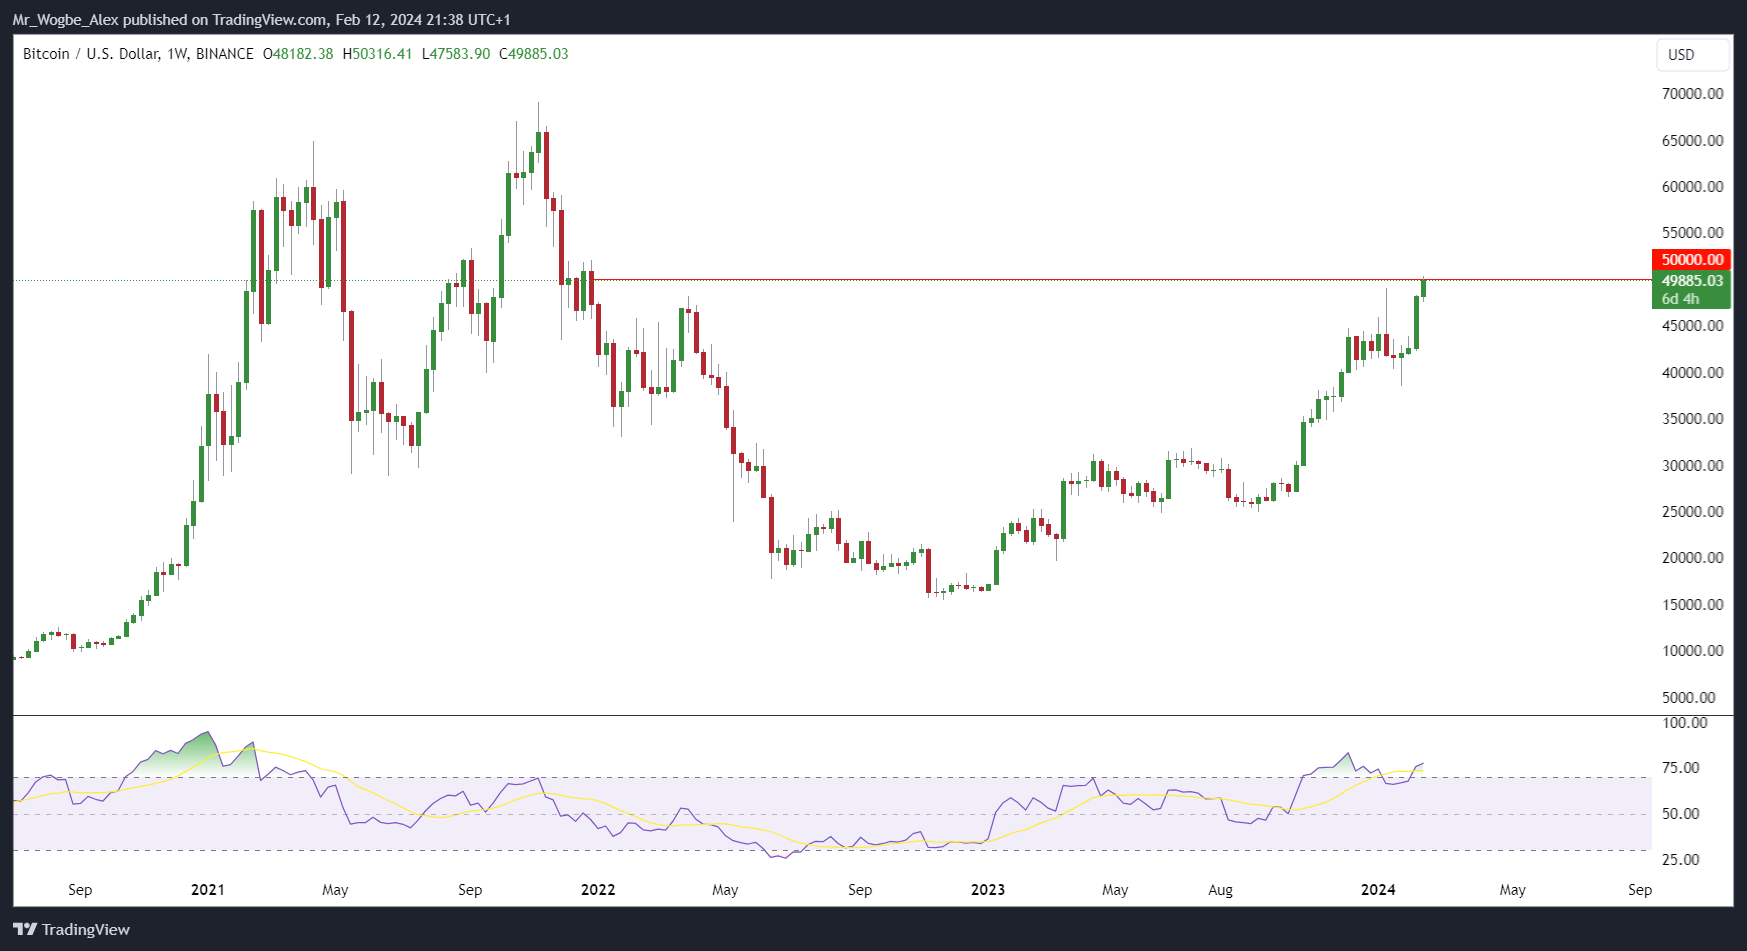
Bitcoin dominated the inflows, accounting for almost 98% of the total. The price of the leading cryptocurrency also soared to over $50,000 on Monday, for the first time since December 2021. The benchmark cryptocurrency jumped by almost 4% on Monday as traders took advantage of the surge.
BTC/USD Daily Chart
The rally was fueled by strong demand from traders and institutional investors, amid the lingering enthusiasm around Bitcoin ETFs in the US.
Other cryptocurrencies also benefited from the positive sentiment, with Ethereum and Cardano seeing inflows of $16 million and $6 million, respectively. Some emerging coins, such as Avalanche, Polygon, and Tron, also attracted minor inflows.
Image via CoinShares
However, not all regions and products saw inflows. Canada and Germany experienced minor outflows of $17 million and $10 million, respectively.
Uniswap and Short-Bitcoin also saw outflows of $0.5 million and $0.4 million, respectively. Moreover, the potential sale of the Genesis holdings of $1.6 billion could cause further outflows from the incumbent products in the US.
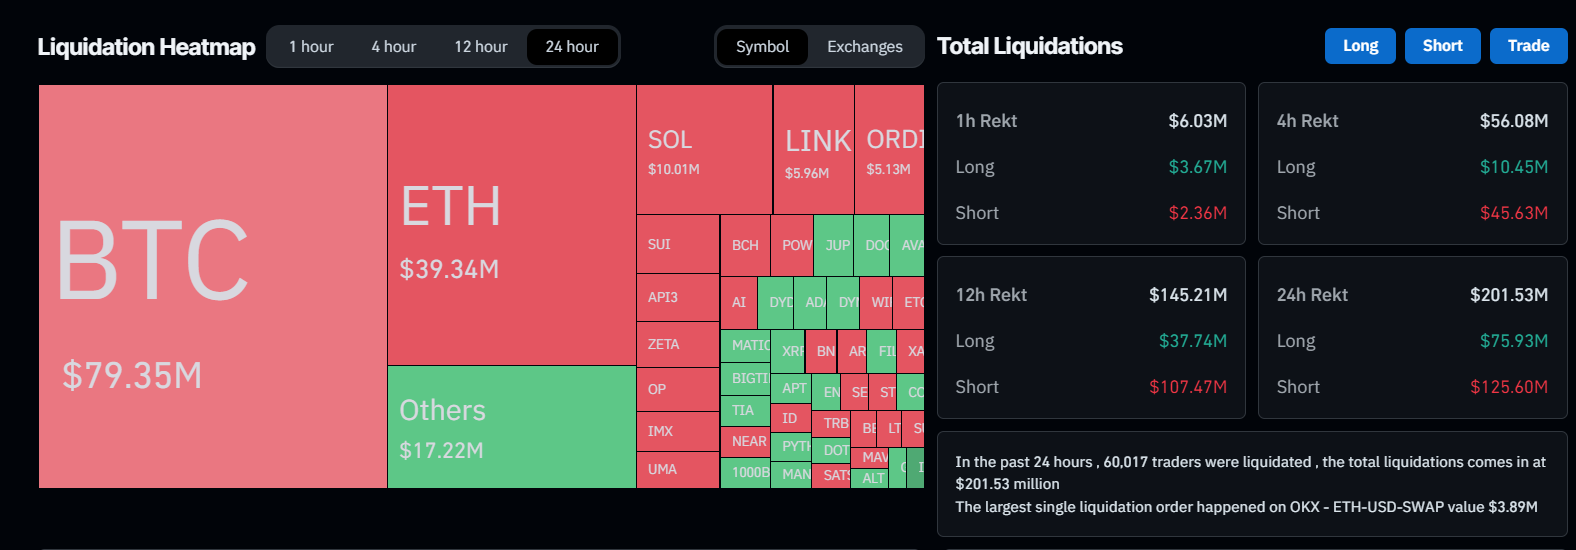
The crypto market also witnessed high volatility and liquidations, as data from Coinglass showed that $201.5 million in positions was liquidated on Monday, with Bitcoin shorts bearing the brunt of the losses.
Millions of Dollars Get Liquidated With Recent Bitcoin Surge
The crypto market also witnessed high volatility and liquidations, as data from Coinglass shows that the recent rise in Bitcoin has triggered massive liquidations in the market, especially for bears. The data shows that $201.5 million in positions was liquidated on Monday, with Bitcoin shorts alone accounting for $79.3 million of this figure.
Image via Coinglass
If you are interested in learning more about crypto and Bitcoin, you can sign up for our Telegram channel and get the latest crypto signals delivered to your inbox.
Interested In Learning How To Use Leverage While Trading? Find Out Here
Market Analysis: MANAUSD to Resume the Initial Bullish Trend
MANAUSD accumulates buys to resume the initial bullish trend. Buyers encounter a slight resistance in late December 2023. This caused a breach in the bullish trend line giving sellers momentum. However, the seller’s momentum came to an end as sellers failed to push prices lower.
Price initially rose from the $0.3020 demand level, creating a bullish trend to surpass the $0.6100 supply level. However, upon reaching the $0.6100 level, the price crashed and breached the bullish trend line. The $0.42300 demand level then provided support, preventing further price decline (Failed low).
The Moving Average is signaling bullishness as the current price is trading above it. The $0.4230 demand level has been retested multiple times, indicating that the price is holding above this level. On the 4-hour timeframe, there is strong liquidity indicated which is attracting price towards it, adding to the bullish bias.
Market Expectation
The market is expected to take out liquidity in the 4H timeframe thereby also indicating a structure break. The anticipated target for the forex signals is the $0.6100 demand level being taken out.
Note:Cryptosignals.org is not a financial advisor. Do your research before investing your funds in any financial asset or presented product or event. We are not responsible for your investing results.
Decentraland (MANAUSD) shows buying strength leaving a $0.3000 demand level the late October 2023 to December 2023. However, the price begins to consolidate, indicating buyers and sellers struggle to dominate the current market trend.
Price started to increase in late October 2023, forming a bullish trend. However, the bullish momentum weakened upon reaching the 0.6150 supply level. Subsequently, the market entered a consolidation phase, forming a symmetrical triangle pattern, suggesting a potential breakout.
On the daily timeframe, the Relative Strength Index indicates that the price has moved out of the oversold region at 30.0 and is expected to rise towards the overbought region at 70. The trend before the symmetrical triangle pattern is bullish, and with the Relative Strength Index providing a confluence, a bullish breakout is expected.
Market Expectation
The price is expected to surpass the symmetrical triangle neckline to indicate the breakout direction. However MANAUSD is anticipated to break out bullishly, the 4h Timeframe indicates a price drop ending as the price failed to create an additional lower low( failed low).
Note:Cryptosignals.org is not a financial advisor. Do your research before investing your funds in any financial asset or presented product or event. We are not responsible for your investing results.
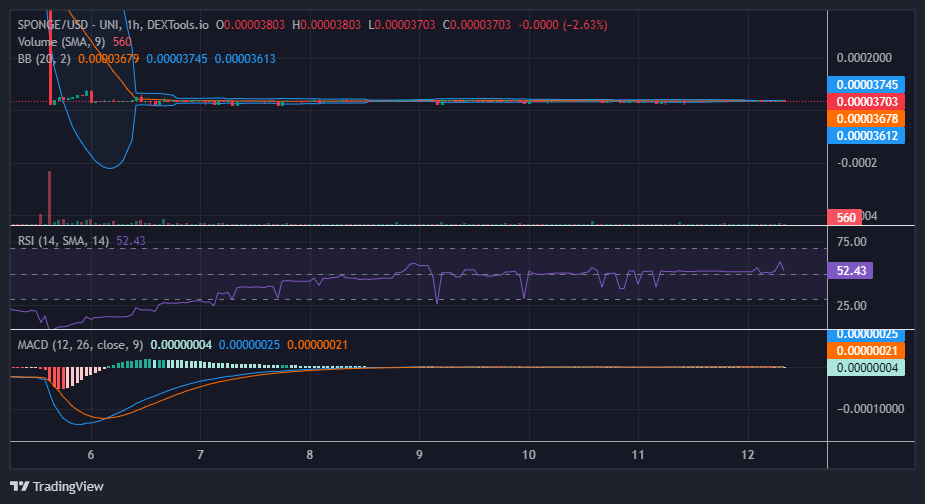
While the broader crypto market experiences choppy waters, this particular market carves its own path, holding steady at a crucial support level of $0.000035. This level served as the launchpad for $SPONGE’s journey last year, and many analysts see it as a springboard for another upsurge. The current price action around $0.000035 signifies robust demand meeting moderate supply, creating a stable foundation for a potential surge. Remember, consolidation often precedes significant moves, and this market might be coiling up for a powerful spring.
Key Market Dynamics:
Resistance Levels: $0.0010, $0.0011, and $0.0012.
Support Levels: $0.00040, $0.00035, and $0.00030.
In-Depth Technical Analysis for $SPONGE (SPONGE/USD)
The tightening Bollinger Bands signify suppressed volatility, similar to squeezing a spring. When released, the spring explodes. This crypto signal is known as “squeeze”, it often precedes significant breakouts, and with bullish momentum building (more on that later), $SPONGE could be on the cusp of an exciting upward climb. The Relative Strength Index (RSI), our trusted sentiment gauge, has started inching upwards from the sub-30 zone, indicating a gradual shift in momentum. While still in oversold territory, this upward tick suggests building bullish energy that could propel the market towards its resistance levels at $0.0010 and beyond.
Insights from the 1-Hour Perspective:
Although the one-hour chart shows a narrow price channel, don’t be fooled by the apparent calm. The 20-day moving average acts as a support line, while the MACD’s conflicting signals hint at brewing indecision. This often precedes a decisive move, and with the right push, the price could break out in a bullish direction.
Buy SPONGE/USD and ride the wave to the next level.
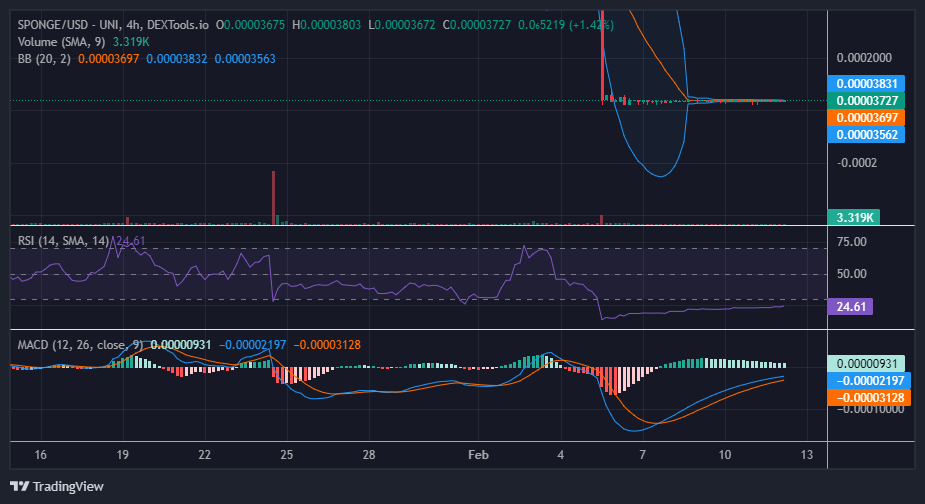
The SPONGE/USD market stands resilient, absorbing the tides of fluctuation, with demand and supply converging along the $0.000035 price level. For investors, this juncture presents an opportunity akin to catching the perfect wave for optimal returns. Historically, since this level represents the starting point of the market last year, there is a strong indication that the price may not decline further than this. Therefore, placing a trade here definitely presents an opportunity for investors to maximize profit.
Key Market Dynamics:
Resistance Levels: $0.0010, $0.0011, and $0.0012.
Support Levels: $0.00040, $0.00035, and $0.00030.
In-Depth Technical Analysis for $SPONGE (SPONGE/USD)
The convergence of the Bollinger Bands into a narrow price channel is a sign of a significant decrease in market volatility. While low volatility implies a potentially flat SPONGE/USD market, the squeeze can also precede a breakout in volatility. Imagine compressing a spring; upon release, it expands rapidly. Similarly, the low volatility period can accumulate energy, potentially leading to a sudden and significant price movement, hopefully in a bullish direction.
One compelling reason to anticipate a bullish price breakout is because our trusty compass, the Relative Strength Index (RSI), presents a crypto signal that indicates a gradual shift in momentum. While it once languished below the 30 mark, a faint glimmer of bullish energy emerges as it climbs from around 14 to 24. Meanwhile, the MACD indicator hints at a potential bullish turn, with negative histograms transitioning into verdant hues, suggesting the strengthening of bullish undertows, although not yet reflected in price action.
Insights from the 1-Hour Perspective:
Zooming in reveals a narrowing price channel, mirroring the tranquility before a storm. The 20-day moving average acts as our guiding star, guiding us through the labyrinth of market fluctuations. Yet, amidst this calm, a brewing storm of indecision brews, as indicated by the MACD’s conflicting signals, suggesting the market teeters on the brink of a momentous shift.
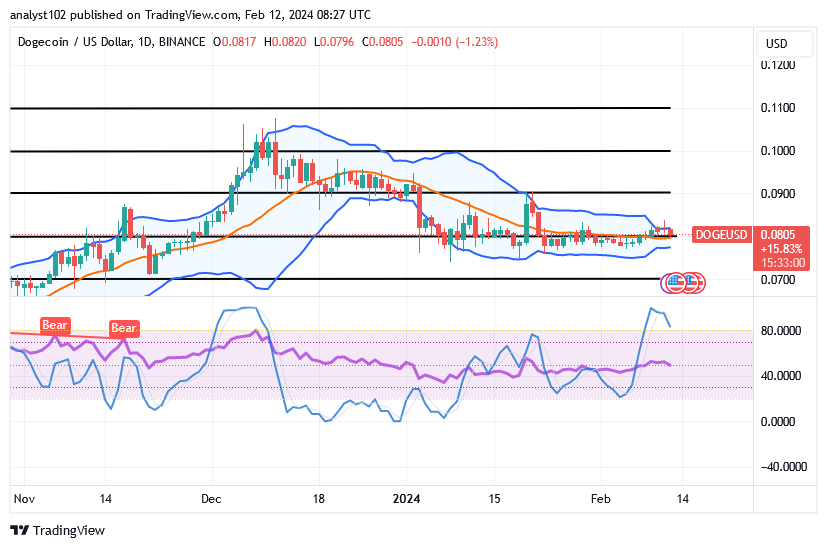
Different forms of price lengths have surfaced primarily around the point of $0.080 in the activities of Dogecoin versus the valuation of the US coin, given that the crypto-economic price is beneath the point of $0.090, keeping a correction trait.
As of the time of writing, the stochastic oscillators’ repositioning posture—which indicated an overbought condition—is the source of the correction mode that the crypto signal is experiencing. On the other hand, given the current trading valuation of the cryptocurrency economy, bulls can still push through in the aftermath of operations because it is still undervalued in relation to overhead barriers in production. Buyers are expected to maintain their holdings firmly, taking into account the risk of a further decline.
DOGE/USD – Daily Chart The DOGE/USD daily reveals that the cryptocurrency coin is beneath the value line of $0.090, keeping a correction trait.
The stochastic oscillators have penetrated the overbought region to bend southerly, showcasing that the motion is relatively under the control of bears. The Bollinger Band trend lines are at the trade points of $0.090 and $0.070 to observe the strategic points that the price has been pushing through.
Will the bears in the DOGE/USD market hold stronger against the lower Bollinger Band, given the existence of a dropping force line?
As there have been variant candlesticks representing variant degrees of sideways, buyers need to be watchful for decent longing entry, as the DOGE/USD market places beneath the value of $0.090, keeping a correction trait.
It is anticipated that pushers in long positions will consistently find support near the lower Bollinger Band’s trending capacity. The trade is expected to stage substantially positive at the $0.065 area, according to close technical analytics.
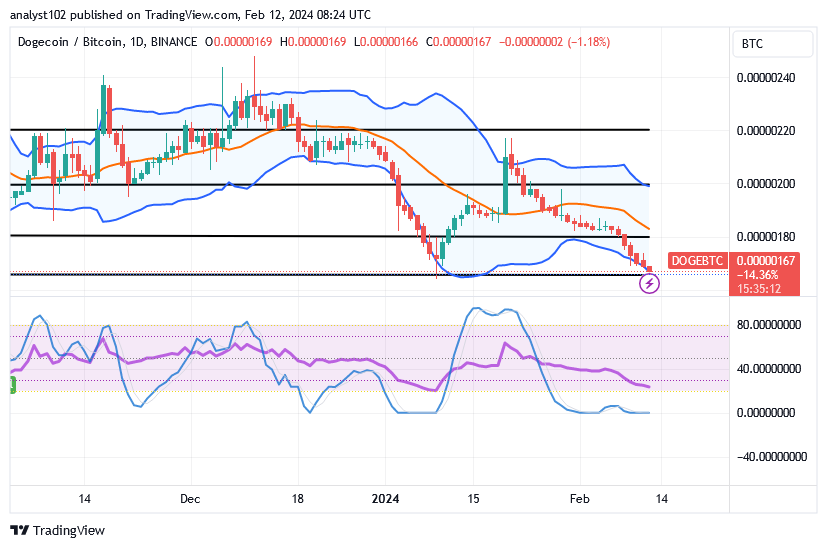
It takes a few days to stage a series of rejections around the top Bollinger band. As shown, in order to carry out shorting orders, shorting activity needs to develop in the area below the $0.090 mark. DOGE/BTC Price Analysis In contrast, the Dogecoin trade has been decreasing steadily against Bitcoin, which shows a correction trait alongside the lower Bollinger Band.
At the bottom end, the Bollinger Band trend lines have been steadily extending southerly. Alongside, a bearish trend has been established. The moves will quickly return to an upward direction if a bullish candlestick emerges from the lower channel of the lower Bollinger Band. In order to minimize downward movements, the stochastic oscillators have been positioned in the oversold area to portend a near end to the declines.
Note:Cryptosignals.org is not a financial advisor. Do your research before investing your funds in any financial asset or presented product or event. We are not responsible for your investing results.
Stablecoins such as Tether are pivotal in merging traditional finance with the digital asset world, notably dollar-backed ones experiencing a surge. They provide stability, enabling smooth value transfer and serving as safe havens in volatile markets, which is crucial for economies facing financial instability.
Tether (USDT) leads the stablecoin market with a significant share but faces scrutiny over reserve transparency. Despite recent assurances, its dominance warrants closer scrutiny.
In this issue of Coin Metrics’ State of the Network, we delve into Tether’s rapid ascent. Using advanced on-chain data analysis, we explore its growth, adoption, usage, and reserve strategies to provide a detailed understanding of this stablecoin giant.
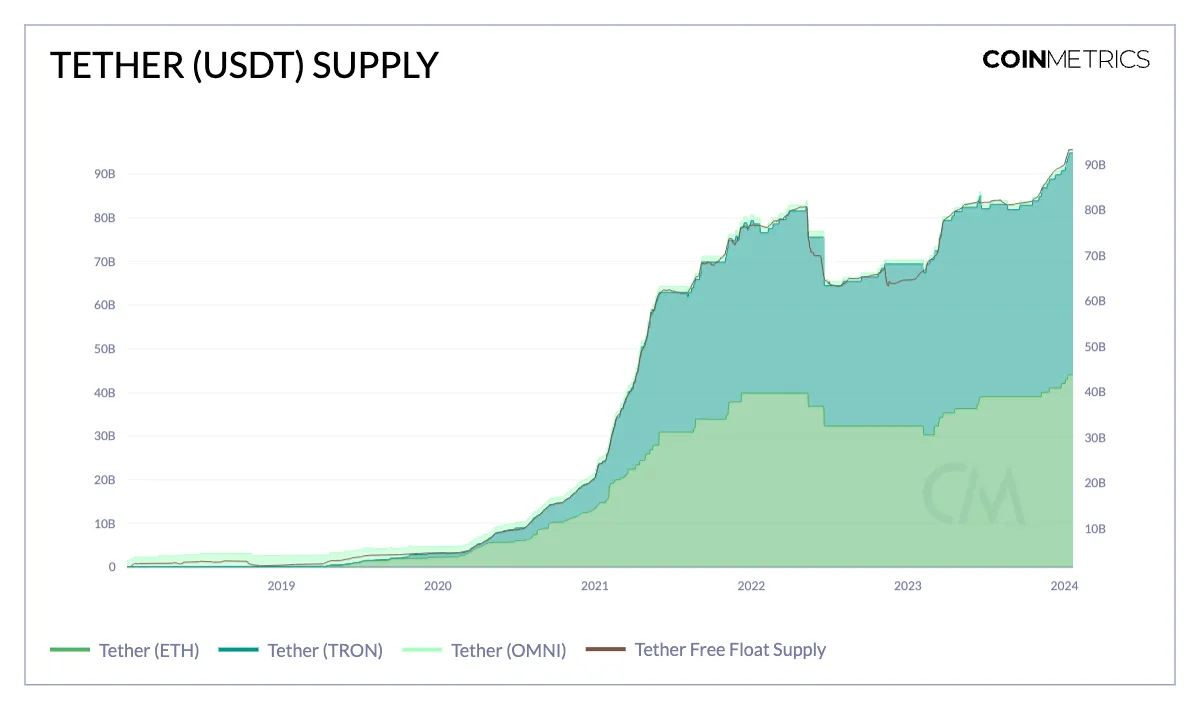
The Expansion of Tether: Scaling New Peaks
While attention momentarily veers towards Bitcoin ETFs, Tether continues its remarkable climb, surpassing $95 billion in total supply with a notable 35% year-over-year increase. Ethereum and Tron serve as primary platforms for USDT issuance, with significant supply shares. Tether’s expansion into alternative layer-1 networks like Solana and Avalanche broadens its reach, reinforcing its role as the premier stablecoin for the digital era.
Navigating the Seas of Adoption: Unraveling the Offshore Stablecoin Surge
Following recent disruptions, including the SVB collapse and the Operation Choke Point 2.0 fallout, offshore stablecoins witnessed a notable resurgence. A closer look reveals USDT’s remarkable surge within smart contracts, traditionally dominated by USDC. The SVB fallout appears to boost USDT’s confidence in smart contracts, with its footprint growing from $4 billion to nearly $6.9 billion since March 2023. USDT’s dominance extends to key DeFi markets like Aave v2 and Compound, consolidating its position in the DeFi space.
USDT’s growing presence in DeFi, spanning lending protocols and decentralized exchanges, highlights its crucial role in facilitating secure dollar transactions and enhancing access to financial services. While Tether’s integration into smart contracts expands, its primary holdings remain in externally owned accounts (EOAs), reaching $37 billion in supply on Ethereum. This trend mirrors the rising adoption of digital dollars for transactions beyond just store of value or volatility hedging, including trading and payments.
Unveiling Usage Trends: Charting Tether’s Global Footprint
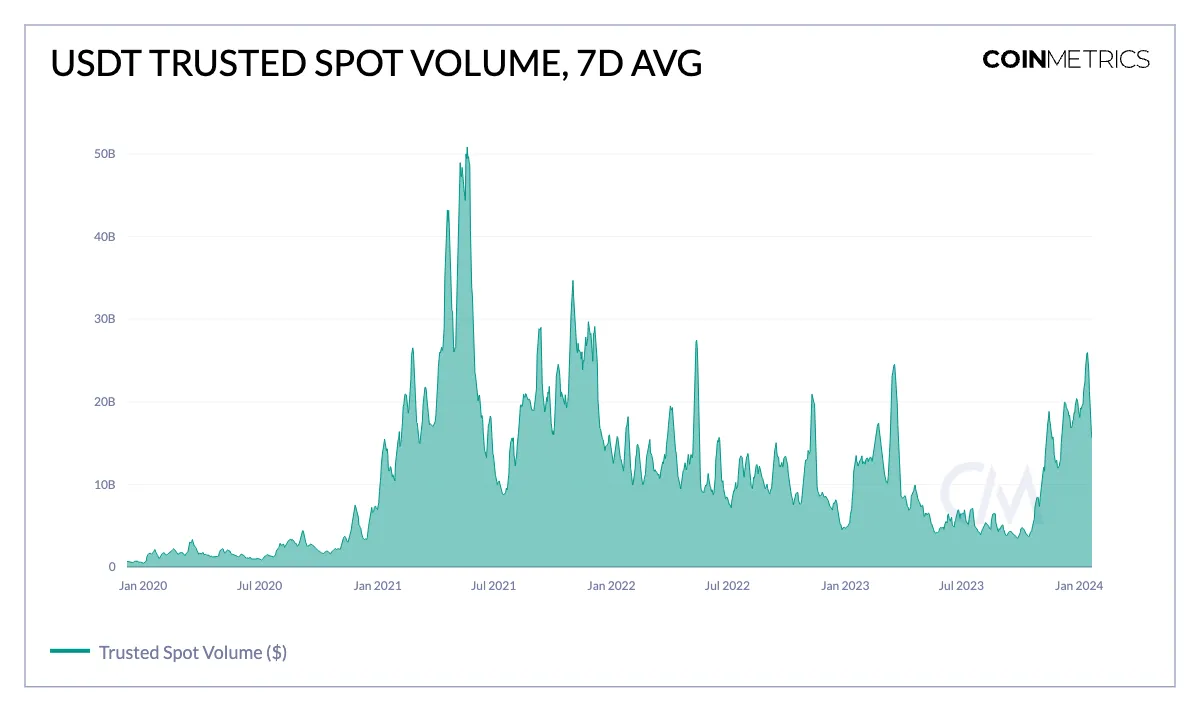
Tether, the leading stablecoin, is widely utilized across networks. This month, on-chain transfer values on Ethereum and Tron exceeded $5 billion and $11 billion, respectively. Since 2014, Tether has facilitated over $13 trillion in transfers, especially in emerging markets where it acts as a reliable dollar substitute. Despite smaller average transfer sizes compared to USDC, Tether’s widespread adoption underscores its pivotal role in facilitating peer-to-peer transactions and economic resilience.
In contrast, USDT transactions on the Ethereum network manifest a different pattern, with an average transfer size of approximately $35,000. This signifies substantial involvement in financial activities within the DeFi landscape, likely influenced by Ethereum’s higher transaction fees. Conversely, USDT transactions on the Tron network paint a distinct picture. With Tron’s negligible transaction fees, the average transfer size for USDT hovers around $7,000, facilitating frequent, lower-value transactions, thereby rendering it a practical choice for everyday payments and remittances.
Unraveling Tether’s Reserve Dynamics
The constitution and transparency of Tether’s reserves have been subjects of intense debate, often sparking conjecture regarding the adequacy of its financial backing. However, Howard Lutnick’s resolute declaration at the World Economic Forum in Davos, asserting that “They have the money,” has assuaged some of these apprehensions, lending credence to discussions surrounding Tether’s reserves. Presently, the sole means of validation lies in independent auditor attestation reports, furnishing a quarterly breakdown of assets stashed in their reserves.
Over the years, Tether’s reserve makeup has undergone notable transformations. While commercial paper once formed a substantial chunk of reserves in 2021, their latest attestation indicates a predominant reliance on US Treasury bills, mirroring the prevailing interest rate environment. In a strategic move unveiled in May 2023, Tether announced a plan to allocate up to 15% of realized profits exclusively into BTC to bolster USDT’s surplus reserves. This initiative materialized into the acquisition of 57.5K BTC, valued at $1.6 billion, aligning with their Q3 2023 attestation. Notably, recent revelations hint at the potential addition of another 8.9K BTC to Tether’s coffers, with credits to this account seemingly linked to Bitfinex, a platform closely intertwined with Tether.
Finally: The Road Ahead
Tether’s meteoric rise underscores its tangible utility, particularly in volatile economies where access to a stable, dependable currency is a luxury. Despite legitimate concerns regarding centralization and transparency, the multifaceted advantages offered by Tether demand acknowledgment.
As a pivotal conduit for broader digital asset adoption, Tether has propelled the entire stablecoin market forward. While it currently reigns as the foremost stablecoin, the evolving landscape poses intriguing questions about its continued dominance. With Circle’s plans for public listing and the emergence of crypto-collateralized and interest-bearing stablecoins, the dynamic realm of stablecoins promises an enthralling journey ahead.
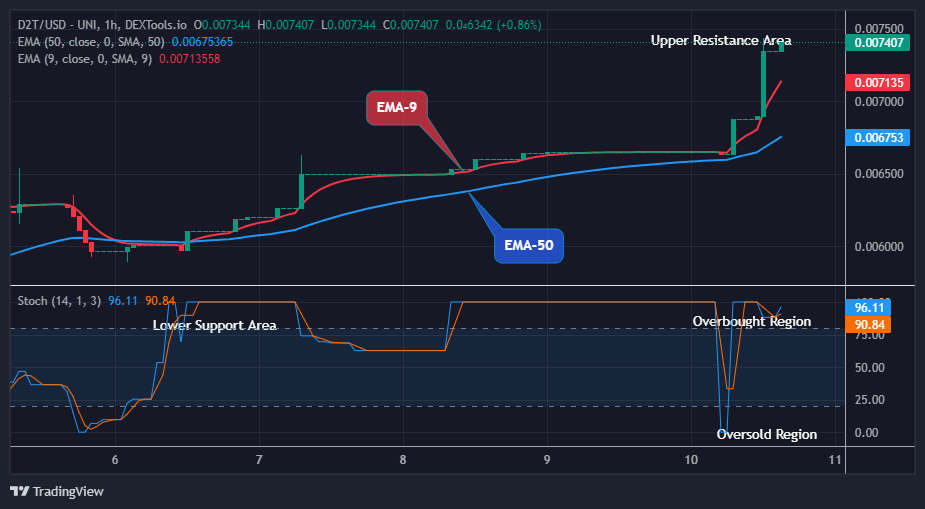
Dash 2 Trade Price Forecast: D2TUSD Remains a Good Buy at $0.00743 Price Value (February 12) Dash 2 Trade market is on the positive side today as the price remains a good buy at the current price of $0.00743 level and maintains its bullish race. If the coin holders could prove stronger and the price shows sustainability above the current trend line, its upside moves could extend further to reach a $0.01000 high level and beyond, encouraging traders to consider long positions.
D2T (USD) Long-term Trend: Bullish (4H) The D2TUSD pair portrays a bullish sentiment in its long-term perspective. Buyers are confident about gaining higher levels as the coin price keeps climbing after clearing the $0.00597 hurdle and this confirms their high impact in the market at the present. The buy investors’ jump to the $0.00664 supply value during the previous action has enabled the crypto to remain strong above the trend line in its recent high.
The momentum continues today after a series of ranging movements, buyers successfully pushed the Dash 2 Trade price to a high at the $0.00743 mark above the supply levels. This shows the high impact of the buy investors on the crypto market.
Additionally, a sharp breakout and closure above the current correction phase at a $0.00743 high value will invalidate any bearish thesis, and then there is a high probability of the coin price going up further to wade off the bearish shackles and focus on the ultimate breakout to the $0.01000 upper resistance level and beyond improving bullish sentiment and modest crypto signal on the crypto in the higher time frame.
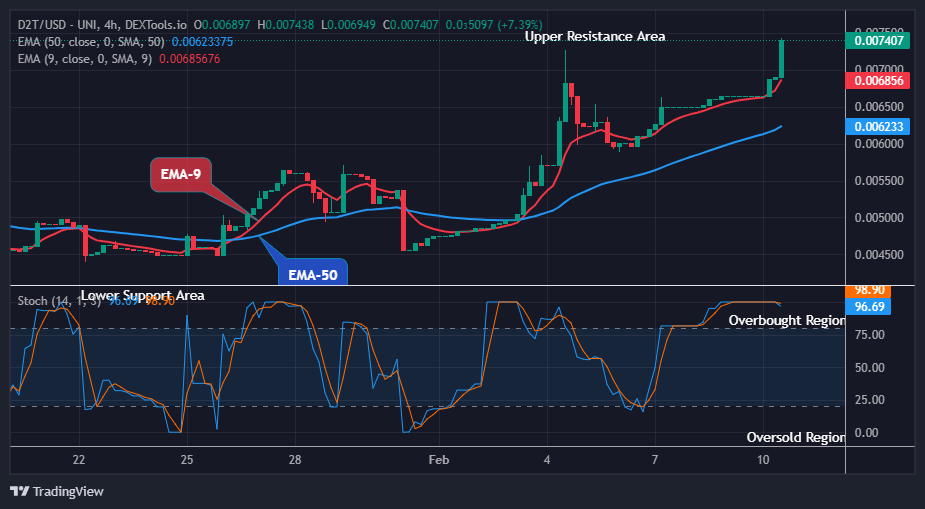
D2T (USD) Medium-term Trend: Bullish (1H) D2TUSD indicates a strong upward trend with a bullish sentiment in its long-term perspective. The coin is trading above the level of $0.00734. The market is presently facing strong resistance at the recent high. The bulls have sustained the crypto market at the $0.00664 supply value in the previous action, this has made it possible for the coin to stay above the trend line and remain stronger in its recent high.
Earlier today, after completing the sideway moves, the bulls made a smooth ride up to a $0.00740 high mark above the moving averages.
The Dash 2 Trade price looks promising as the bulls remain dominant in the market at the moment. If the bulls should increase their price action, and a bullish momentum is sustained far above the current resistance trend lines, further bearish sentiment will be restricted.
Additionally, the coin market will rise further as shown by the price indicator which is pointing upwards, if the buy traders should increase their price actions, and bullish momentum is sustained above the $0.00740 high mark, the Dash 2 Trade price may likely pump up to a significant level at a $0.01000 resistance mark and beyond in its medium-term time frame. This signals a BUY trade again in its medium-term time frame.
Smart Money Insights: People and organizations seen as knowledgeable and experienced, who frequently predict future trends, are known as smart money.
🚀Smart Money Insights📊
Smart Money is individuals & entities who are seen as experienced & informed, often signaling future trends.
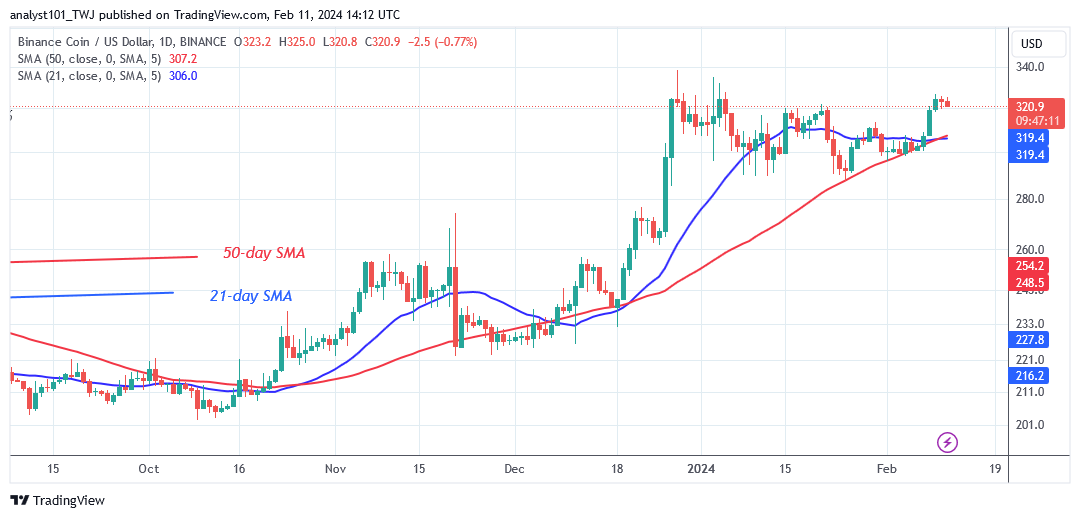
BNB (BNB) Long-Term Analysis: Bullish BNB’s price is trending sideways as it continues its downward trajectory. Since December 27, the cryptocurrency has been trading sideways between $290 and $330. On February 9, the altcoin surged to a high of $326 before resuming swings below the $330 barrier mark. Today, the altcoin is retracing to the moving average lines. This has been the price activity over the last two weeks.
On the upside, if the current resistance level is broken, the altcoin will rise to $360. If the bulls fail to break above the present resistance level, the sideways trend will continue. Meanwhile, prices have moved slowly due to the presence of Dojt candlesticks.
BNB/USD – Daily Chart
Technical indicators: Major Resistance Levels – $440, $460, $480 Major Support Levels – $240, $220, $200
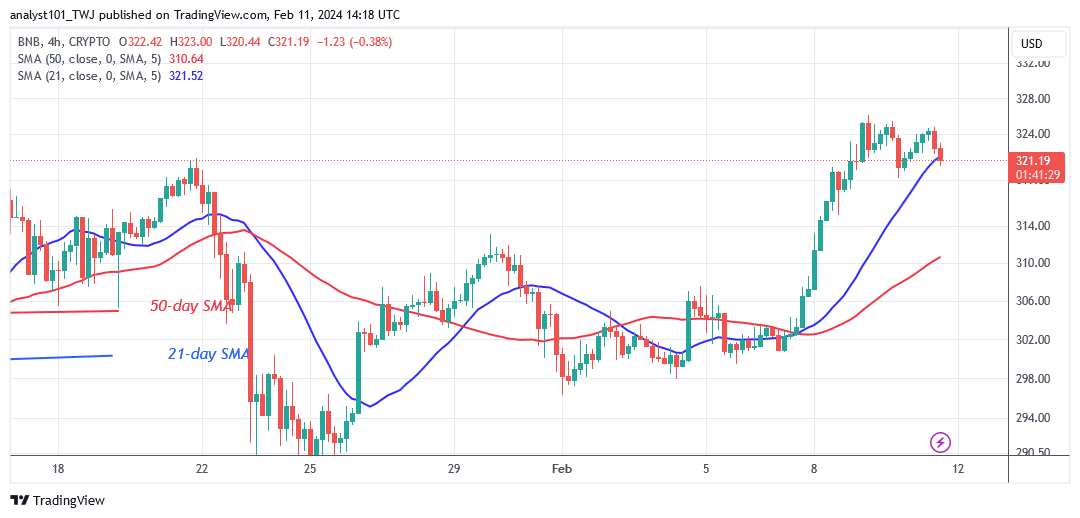
BNB (BNB) Indicator Analysis The price bars are above the horizontal moving average lines. BNB prices will rise as long as they remain above the moving average lines. The upward trend is stalled at the $330 resistance level. On the 4-hour chart, the price bars have broken below the 21-day SMA, indicating a continued slide to the 50-day SMA.
What Is the Next Direction for BNB (BNB)? BNB/USD is falling after hitting a resistance level as it continues its downward trajectory. The altcoin is expected to drop and resume its range-bound movement between $290 and $330. Currently, the altcoin has been repelled from its recent high. Long candlestick wicks imply significant selling pressure at the higher price level. The crypto signal is expected to be bearish, as the altcoin faces rejection at its recent high.
Note:Cryptosignals.org is not a financial advisor. Do your research before investing your funds in any financial asset or presented product or event. We are not responsible for your investing results