SPONGE (SPONGE/USD) Aims to Rejuvenate Upward Momentum Near $0.0008

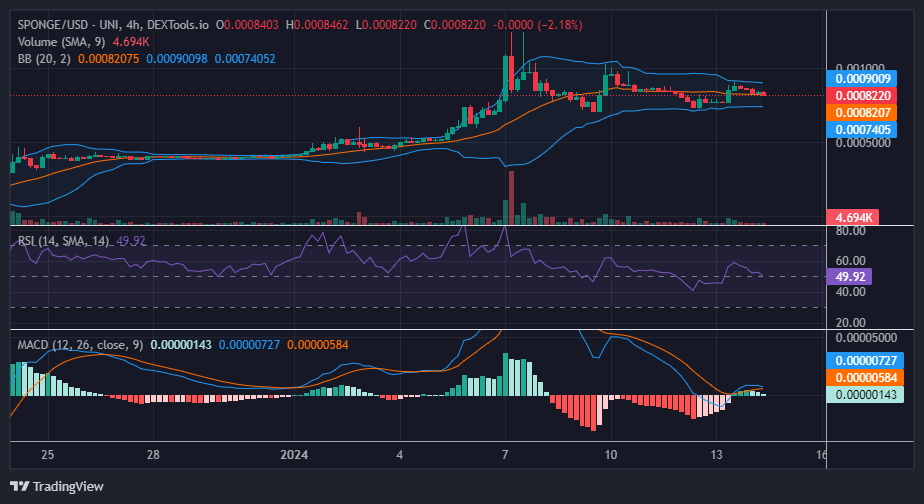
Following the most recent market analysis, the previously upward-trending SPONGE/USD bullish market has exhibited indications of a bearish accumulation since the 11th hour of yesterday’s trading session. The increasing bearish sentiment is likely a contributing factor to the market’s failure to surpass the $0.0009 price level, leading to a retracement in prices.

Key Market Indicators:

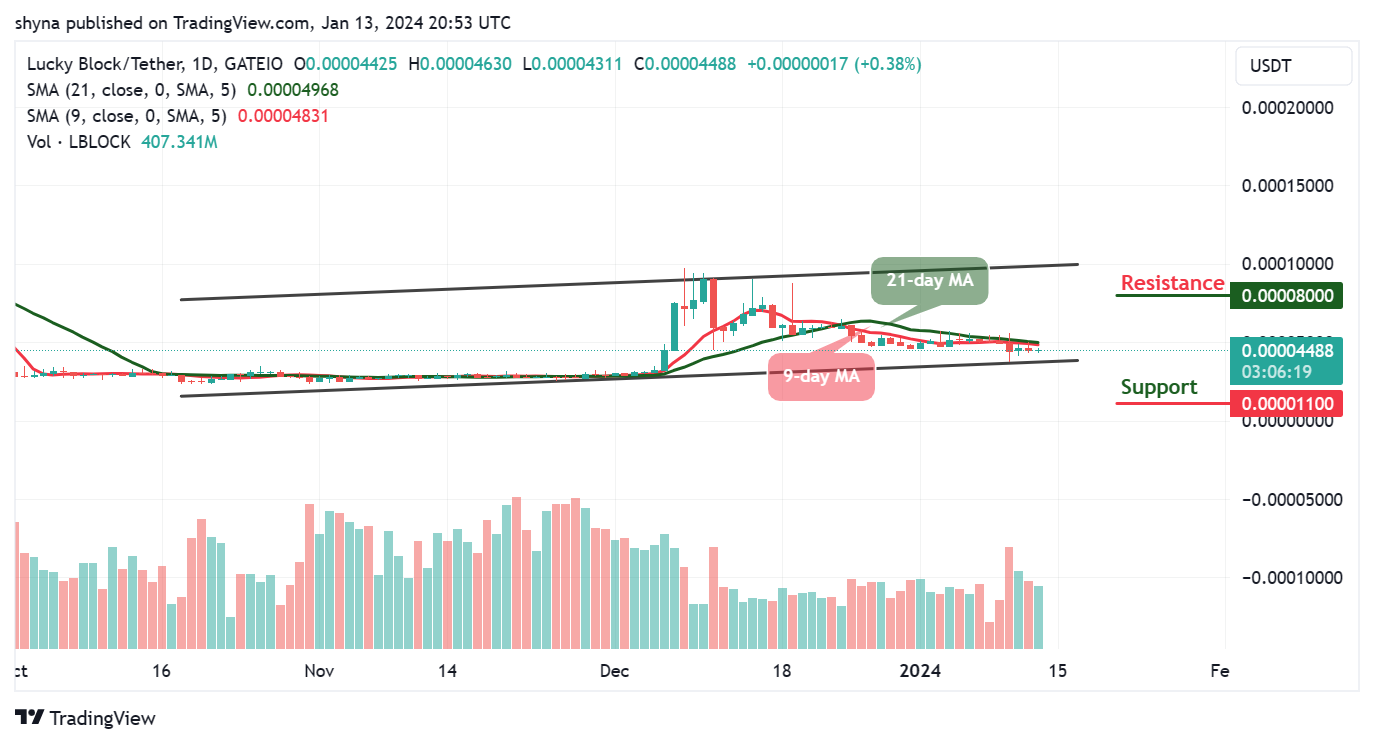
  • Resistance Levels: $0.0010, $0.0011, and $0.0012.
  • Support Levels: $0.000450, $0.00040, and $0.00035.

SPONGE (SPONGE/USD) Aims to Rejuvenate Upward Momentum Near $0.0008

In-depth Technical Analysis for $SPONGE (SPONGE/USD):

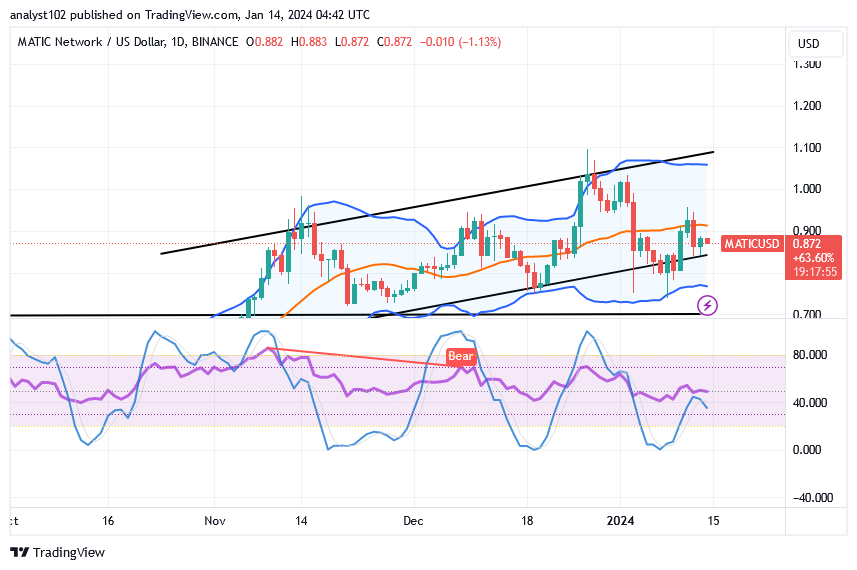
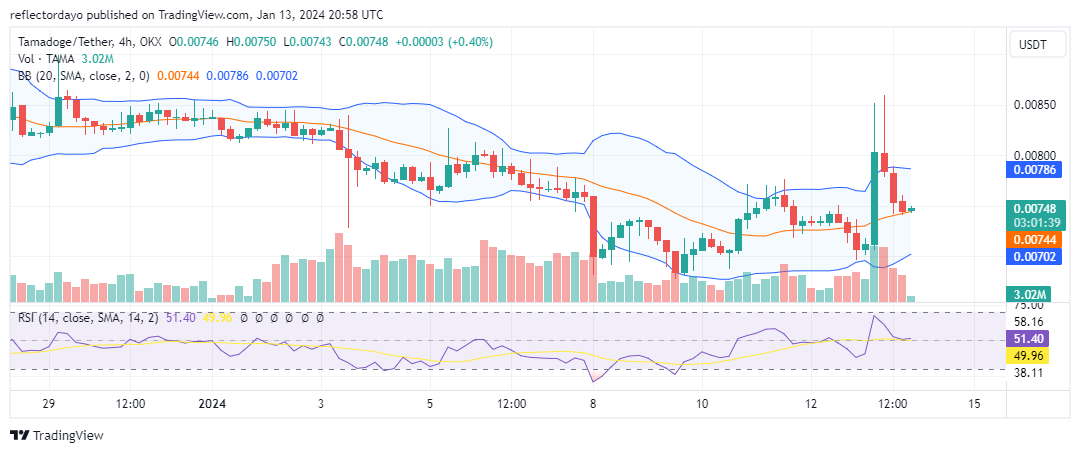
Examining the market through the lens of the Bollinger Bands indicator reveals the emergence of a consolidation trend. The horizontally moving bands are gradually converging, forming a narrow price channel. Furthermore, a careful analysis since January 10 indicates a convergence of both support and resistance levels around the ongoing price action, with the price itself descending to the 20-day moving average.

The bandwidth, representing the dynamic interplay between demand and supply, is diminishing and narrowing, particularly around the $0.00082 price level. Anticipation arises for a potential pivotal support level to materialize from these SPONGE/USD market developments, fostering the continuation of the bullish trend.

SPONGE (SPONGE/USD) Aims to Rejuvenate Upward Momentum Near $0.0008

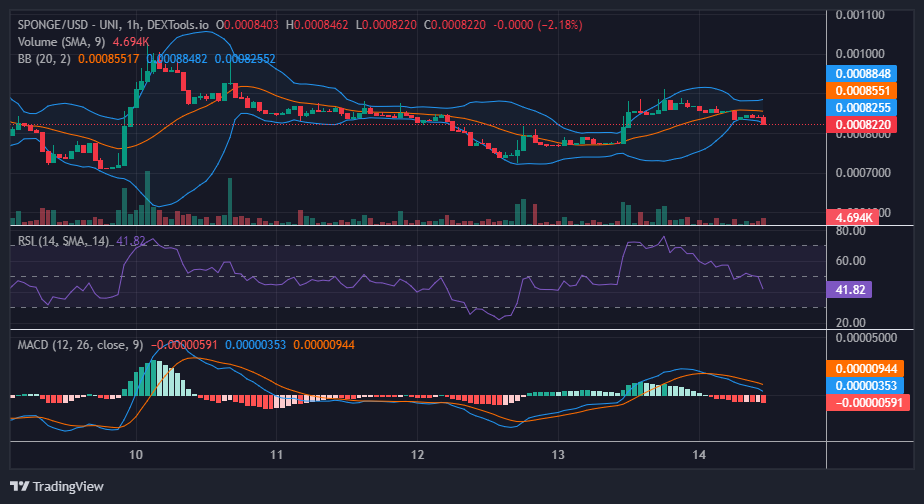
Insights from the 1-Hour Perspective:

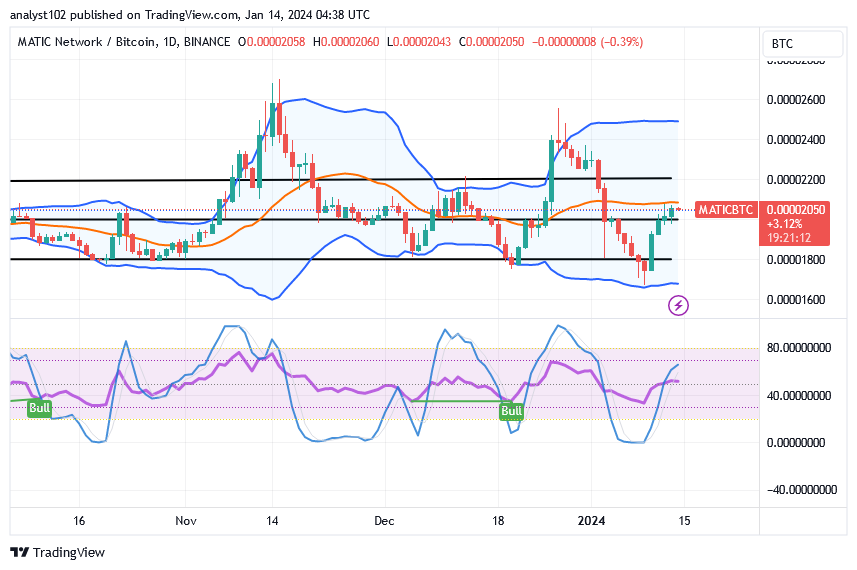
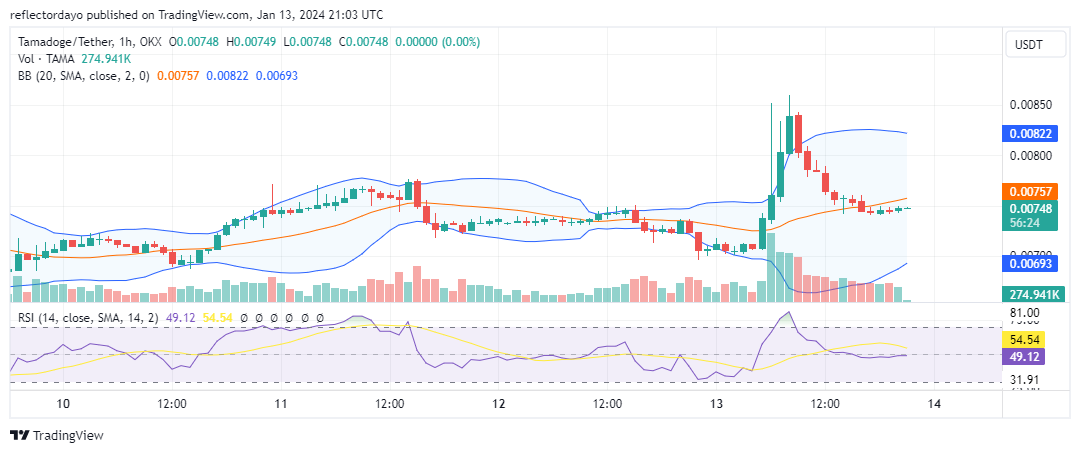
In the shorter timeframe, we observe a bearish market breakout, leading the price to descend towards the $0.00082 level subsequent to a struggle between bulls and bears around the $0.00084 mark. Should the bearish momentum persist in SPONGE/USD, the $0.0008 price level is anticipated to serve as a potential threshold for bullish intervention.

It’s time to reserve your spot in the V2 launch, $SPONGE holders!

Invest in the hottest and best meme coin. Buy Sponge ($SPONGE) today!

Solana’s Developer Network Displays Continual Progress

Solana asserts itself as the second-largest ecosystem by monthly active developers.

In 2023, Solana’s native SOL token emerged as one of the top-performing crypto assets. Simultaneously, the Layer 1 network’s developer ecosystem exhibited steady growth.

Notably, developer retention in the Solana ecosystem surged from 31% to over 50% within three months.

This enhanced retention was attributed to factors such as improved developer onboarding, the increasing popularity of the Solana blockchain, and expanding opportunities within the ecosystem.

Developer Retention Surges in the Solana Ecosystem
In a recent report, the Solana Foundation disclosed that the evaluation of retention rates specifically focused on developers consistently committing over three consecutive months.

Additionally, every six months, 400-500 Solana developers, who completed various boot camps, joined the ecosystem, resulting in an impressive 500% growth in job listings over the year.GitHub data indicates that the enhanced retention rate led to a consistent monthly active developer count, ranging between 2,500 and 3,000 within the Solana ecosystem throughout 2023.

The foundation attributed this positive trend to advancements in tooling for various programming languages and the introduction of additional educational resources.However, they also acknowledged potential areas for improvement, particularly in testing and debugging.
Solana's Developer Network Displays Continual Progress
Despite its relative newness, with the Solana mainnet beta launching in March 2020, the report asserts that the Solana ecosystem has swiftly grown to secure the position of the second-largest in terms of total monthly active developers.

Growing Popularity
Solana faced challenges early in the year, linked to the FTX collapse, causing a significant decline in the SOL token’s value. Despite this setback, the asset experienced remarkable growth of over 800% in the past year, securing its position as the fifth-largest crypto asset by market cap.


The Solana ecosystem exhibited a noteworthy recovery in the latter months of 2023. Investment products tied to Solana demonstrated strong performance, attracting net inflows of $167 million, surpassing Ethereum, which trailed with a comparatively modest $78 million.

In December, Google searches for Solana outpaced those for Ethereum, with the highest popularity observed in Spain and the Philippines.

In order to place winning trades with us via Bybit, you can open an account here.


Polygon (MATIC/USD) Trade Is Lowering, Rebuilding a Baseline

Polygon Price Prediction – January 14

Activities of bulls in the market operations of Polygon versus the purchasing weight of the US coin have been over a couple of sessions put under a check that has led the current bargaining actions to lowering and rebuilding a baseline between the paths of the upper and lower Bollinger Bands.

The stochastic oscillators are going to be instrumental in the determination process of when the price is potentially going to bounce back into an uprising motion. Buyers should now exercise caution in light of the possibility of erratic price drops versus the lower Bollinger Band near the $0.75 mark. That being said, should that scenario materialize, Traders will have another excellent opportunity to get ready to pay close attention to the dip purchasing process, even though it might take some time before they see a desired rebound.

MATIC/USD Market
Key Levels:
Resistance levels: $0.95, $1.05, $1.15
Support levels: $0.75, $0.70, $0.65

MATIC/USD – Daily Chart
The MATIC/USD daily chart showcases that the crypto-economic price is lowering, rebuilding a baseline above the lower Bollinger Band.

The Bollinger Band trend lines are systemically positioned northward to depict the values of $1.10 and $0.80 as the key resistance and support, respectively. The stochastic oscillators are having a slight southbound-crossing mode on the blue part to indicate that a fall is tentatively ongoing.
Polygon (MATIC/USD) Trade Is Lowering, Rebuilding a Baseline

As the price hovers around $0.872, which indicator should buyers of MATIC/USD trades follow?

The ideal technical trade indicator that buyers in the market operations of MATIC/USD are expected to follow has to be stochastic oscillators with the formation of a bullish candlestick to back up an ideal execution of a longing entry order, given that the price is lowering, rebuilding a baseline.

Before the market can resume its upward trajectory to the north, a slow motion force has been causing it to visit some of its final lower points. Bulls may be kept in check for a bit below the middle Bollinger Band in the interim, as a bouncing pattern is anticipated to emerge soon.

The stochastic oscillators’ repositioning indicates that there will likely be more declines below the $0.95 resistance line for some time. Right now, it seems like sellers are trying to drive the price back down toward $0.80 or even $0.75.
Polygon (MATIC/USD) Trade Is Lowering, Rebuilding a Baseline
MATIC/BTC Price Analysis
In comparison, the Polygon market is preparing to lower before rebuilding energy against the velocity of Bitcoin around the point of the middle Bollinger Band.

The Bollinger Band trend lines are yet to be widely opened to showcase wider range-bound zones.. The fact that there are certain clearly staged higher and lower positions are telling. The stochastic oscillators maintain a rising mode as they approach larger pushing-through values. In relation to the cryptocurrency used for countertrading, the base coin is trending south. The motion for an uprising will probably be postponed.

Note: Cryptosignals.org is not a financial advisor. Do your research before investing your funds in any financial asset or presented product or event. We are not responsible for your investing results.


You can purchase Lucky Block here. Buy LBLOCK

Polkadot Is Stuck and Fears More Rejection at $8.57

Polkadot (DOT) Long-Term Analysis: Bearish
Polkadot’s (DOT) price has been caught between the moving average lines but fears more rejection at $8.57. Buyers made two unsuccessful attempts to keep the price above the 21-day SMA. Their actions would have led to continued upward movement of the cryptocurrency. On the downside, bears have made two failed attempts, to break below the 50-day SMA. Polkadot is currently trading at $7.53.

Currently, neither bulls nor bears have the upper hand as the altcoin trades between the moving average lines. The altcoin is in decline and will fall further if the bears break below the 50-day SMA. The market will reach a low of $5.40. In the meantime, Polkadot is caught between the moving average lines.

Polkadot Is Stuck and Fears More Rejection at $8.57

Technical indicators:
Major Resistance Levels – $10, $12, $14
Major Support Levels – $8, $6, $4

Polkadot (DOT) Indicator Analysis
Since January 3, the price bars have remained between the moving average lines, indicating that traders are unconcerned with price movement. Meanwhile, the moving averages are sloping downward, indicating a decrease on the 4-hour chart.

What Is the Next Direction for Polkadot (DOT)?
Polkadot is in decline and may fall further as it fears more rejection at $8.57 . On the downside, selling pressure will increase if the bears breach below the 50-day SMA. The cryptocurrency will resume its slide below the moving averages. However, the existence of Doji candlesticks may relieve the selling pressure. Otherwise, the sideways trend may continue in the current range.

Polkadot Is Stuck and Fears More Rejection at $8.57
DOT/USD – 4 Hour Chart


You can purchase Lucky Block here. Buy LBLOCK

Note: Cryptosignals.org is not a financial advisor. Do your research before investing your funds in any financial asset or presented product or event. We are not responsible for your investing results

Arbitrum Price Prediction: ARB/USD May Dive Below $2.0 Support

Arbitrum Price Prediction – January 13

The Arbitrum price failed to cross above the resistance level of $2.2. As a result, ARB could begin a fresh decline below the $2.0 support.

ARB/USD Long-term Trend: Bullish (Daily Chart)

Key levels:

Resistance Levels: $2.80, $3.00, $3.20

Support Levels: $1.60, $1.40, $1.20

Arbitrum Price Prediction: ARB/USD May Dive Below $2.0 Support
ARBUSD – Daily Chart

ARB/USD touches its daily lowest level at $2.08 as more selling pressure is likely to play out if the bulls fail to push the coin upward. Today’s trading session has seen the Arbitrum price heading to the south for the past few days. Therefore, the coin hit a low of $2.08 a couple of hours ago.

Arbitrum Price Prediction: ARB Price Could see a Further Drop

The Arbitrum price may continue to follow a bearish fever if the sellers increase the pressure. However, with the Arbitrum price heading toward the south, the coin may likely create another support at $1.80. Meanwhile, the crypto market may experience a serious downtrend if the 9-day moving average slides below the 21-day moving average. On the other hand, if the Arbitrum price crosses above the upper boundary of the channel, it may locate the potential resistance at $2.80, $3.00, and $3.20 levels.

Nevertheless, the Arbitrum price was rejected at the important level of $2.21, however, with $2.50 as the new psychological barrier to the bull run, any movement below it is a bear territory, and bulls will need to stay on their toes. However, if a deeper correction follows here, it could be considered extremely unhealthy for ARB/USD as the critical supports are located at $1.60, $1.40, and $1.20. Meanwhile, the 9-day moving average remains above the 21-day moving average, which could suggest that bulls may come into play.

ARB/USD Medium-term Trend: Ranging (4H Chart)

Looking at the 4-hour chart, the Arbitrum price is moving sideways and the coin may spike above the 9-day and 21-day moving average if the bulls increase the pressure. However, the 9-day moving average is seen crossing below the 21-day moving average and the Arbitrum price may likely slide toward the lower boundary of the channel and could reach the critical support at $1.70 and below.

Arbitrum Price Prediction: ARB/USD May Dive Below $2.0 Support
ARBUSD – 4-Hour Chart

Meanwhile, if the bulls can hold the current price tight, ARB/USD may likely cross above the moving averages to face the upper boundary of the channel, crossing above this barrier could hit the potential resistance at $2.70 and above. The 9-day MA may need to stay above the 21-day MA so that more bullish signals could play out.

Place winning Arbitrum trades with us. Get ARB here

XRP Consolidates above $0.54 as Buyers Drive the Rise

XRP (XRP) Long-Term Analysis: Bearish
The price of XRP (XRP) has fallen below the moving average lines as buyers drive the rise. The altcoin has been consolidating above the $0.54 support since the market collapse on January 3. Nonetheless, buyers tried to keep the price above the moving average lines but were unsuccessful at $0.62. On the positive side, further upward movement of the cryptocurrency is improbable given the recent rejection.

XRP/USD will retest the existing support level at $0.54 on the downside. However, if the bear’s breach is below the current support of $0.54, selling pressure will return. XRP will decline significantly, reaching a low of $0.48. In the meantime, the altcoin will be forced to trade sideways between the current support levels of $0.54 and $0.62.

XRP consolidates above $0.54 as buyers drive the rise
XRP/USD – Daily Chart

Technical Indicators:
Major Resistance Levels – $1.00, $1.50, $2.00
Major Support Levels – $0.50, $0.30, $0.10


XRP (XRP) Indicator Analysis
The bearish momentum has lessened, but the price bars are still below the moving average lines. The altcoin’s current range of fluctuation is below the lines representing the moving averages. The moving average lines are sloping horizontally, even with the recent decline. The coin has been moving sideways throughout trading.

What Is the Next Direction for XRP (XRP)?
The crypto asset is currently trading below its moving average lines as buyers drive the rise. The cryptocurrency’s price ranges from $0.55 to $0.62. The altcoin is erratic as it awaits a positive trend. The negative momentum has decreased as of now. In addition, the tail of the long candlestick on January 12 shows significant buying pressure at the $0.48 support level.

XRP consolidates above $0.54 as buyers drive the rise
XRP/USD – 4 Hour Chart


You can purchase crypto coins here. Buy LBLOCK

Note: Cryptosignals.org is not a financial advisor. Do your research before investing your funds in any financial asset or presented product or event. We are not responsible for your investing results

Lucky Block Price Prediction: LBLOCK/USD Keeps Hovering Around $0.000044 Level

Lucky Block Price Prediction – January 13

The Lucky Block price prediction shows that LBLOCK indicates sideways movement as the coin fails to head toward the upside.

LBLOCK/USD Long-term Trend: Ranging (Daily Chart)

Key levels:

Resistance Levels: $0.000080, $0.000082, $0.000084

Support Levels: $0.000011, $0.000009, $0.000007

Lucky Block Price Prediction: LBLOCK/USD Keeps Hovering Around $0.000044 Level
LBLOCKUSD – Daily Chart

LBLOCK/USD is hovering at $0.000044 but the coin has not been able to reclaim the resistance level of $0.000050 above the 9-day and 21-day moving averages. At the moment, the Lucky Block price may begin to follow the sideways movement, but the daily chart shows that the formation of a bullish movement could play out.

Lucky Block Price Prediction: LBLOCK Price Could Consolidate to the Upside

As the Lucky Block price moves toward the east, it is likely to remain below the 9-day and 21-day moving averages if the bulls fail to push the coin to the upside. This could mean that the Lucky Block is not yet ready for the upside as the buyers gather momentum.

According to the chart, recovery may set in bit by bit as the bulls may bring LBLOCK/USD above the resistance level of $000050. However, a sustainable movement towards the north may reach the resistance level of $0.000060, which could allow for an extended recovery in the direction of the potential resistance levels at $0.000080, $0.000082, and $0.000084. On the downside, any bearish movement may cause the Lucky Block price to hit the supports at $0.000011, $0.000009, and $0.000007.

LBLOCK/USD Medium-term Trend: Bearish (4H Chart)

Looking at the 4-hour chart, the Lucky Block price is hovering within the 9-day and 21-day moving averages. LBLOCK/USD may cross below the lower boundary of the channel if the bearish movement increases. However, should the price cross above the moving averages and head toward the upper boundary of the channel; it could locate the resistance level of $0.000053 and above.

Lucky Block Price Prediction: LBLOCK/USD Keeps Hovering Around $0.000044 Level
LBLOCKUSD – 4-Hour Chart

Moreover, if the bearish movement increases, the support level of $0.000040 may not be able to hold the selling pressure. Therefore, LBLOCK/USD is likely to fall to $0.000037 and below if the price crosses the lower boundary of the channel. Nevertheless, the 9-day moving average remains below the 21-day moving average to confirm the bearish movement, so that buyers can buy the dips.

You can purchase Lucky Block here. Buy LBLOCK

Tamadoge (TAMA/USD) Witnesses Bullish Intervention at the $0.0075 Price Point

During the initial phase of today’s trading session in the TAMA/USD market, bullish momentum strengthened sufficiently to propel the market to a peak of $0.0086. Following this high, traders initiated profit-taking, causing a rapid decline towards the $0.0074 price level. However, bulls promptly intervened around the $0.0075 price point, resulting in a standoff between demand and supply at this level.

Key Levels

  • Resistance: $0.013, $0.014, and $0.015.
  • Support: $0.0070, $0.0068, and $0.0064.

Tamadoge (TAMA/USD) Witnesses Bullish Intervention at the $0.0075 Price Point

TAMA/USD Price Analysis: The Indicators’ Point of View

As demand and supply align at the $0.0075 price level, a potential consolidation trend could unfold. This expected consolidation may establish the level as a robust support, sustaining the ongoing TAMA/USD bullish recovery. The volume histogram of the trade indicator is showing a reduction in height, and the Relative Strength Index (RSI) indicates market momentum around its midpoint. These dynamics suggest a period of indecision, potentially leading to a consolidation trend centered around $0.0075.

It’s noteworthy that this $0.0075 level represents a higher price compared to the last support level near $0.007. The bullish recovery remains in progress, underscoring the resilience and strength of the current market trend.

Tamadoge (TAMA/USD) Witnesses Bullish Intervention at the $0.0075 Price Point

Tamadoge Short-Term Outlook: 1-Hour Chart

Examining the 1-hour chart, the market is currently situated around the midpoint of the indicators. Over the past five hours, each hourly candlestick reflects indecision as bullish and bearish forces are evenly matched. In the present 1-hour session, the candlestick pattern forms a four-price doji, signaling robust indecision in the market. Despite this, as indicated by the Bollinger Bands, the volatility level remains elevated.

If the ongoing consolidation trend persists, there is a possibility of the Bollinger Bands converging. Following a volatility squeeze, the potential outcome could be an upward movement in the price.

Play by yourself or place bets with other people.


Do you want a coin that will be 100 times more valuable in the next few months? That is Tamadoge. Buy TAMA today!

XRP Consolidates above $0.54 as Buyers Drive the Rise

Technical Indicators:
Major Resistance Levels – $1.00, $1.50, $2.00
Major Support Levels – $0.50, $0.30, $0.10

XRP (XRP) Long-Term Analysis: Bearish
The price of XRP (XRP) has fallen below the moving average lines as buyers drive the rise. The altcoin has been consolidating above the $0.54 support since the market collapse on January 3. Nonetheless, buyers tried to keep the price above the moving average lines but were unsuccessful at $0.62. On the positive side, further upward movement of the cryptocurrency is improbable given the recent rejection. The altcoin will retest the existing support level at $0.54 on the downside. However, if the bear’s breach is below the current support of $0.54, selling pressure will return. XRP will decline significantly, reaching a low of $0.48. In the meantime, the altcoin will be forced to trade sideways between the current support levels of $0.54 and $0.62.

XRP (XRP) Indicator Analysis
The bearish momentum has lessened, but the price bars are still below the moving average lines. The altcoin’s current range of fluctuation is below the lines representing the moving averages. The moving average lines are sloping horizontally, even with the recent decline. The coin has been moving sideways throughout trading.

What Is the Next Direction for XRP (XRP)?
The crypto asset is currently trading below its moving average lines as buyers drive the rise. The cryptocurrency’s price ranges from $0.55 to $0.62. The altcoin is erratic as it awaits a positive trend. The negative momentum has decreased as of now. In addition, the tail of the long candlestick on January 12 shows significant buying pressure at the $0.48 support level.


You can purchase crypto coins here. Buy LBLOCK


Note: Cryptosignals.org is not a financial advisor. Do your research before investing your funds in any financial asset or presented product or event. We are not responsible for your investing results