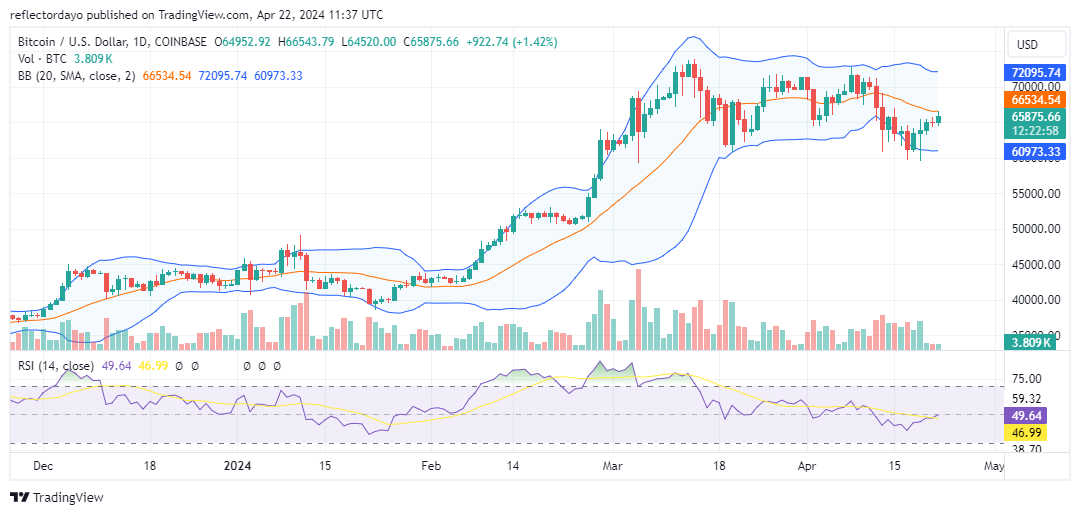
Since April 19th and 20th, coinciding with the Bitcoin halving event, there has been a noticeable equilibrium in supply and demand within the market. This equilibrium suggests a hesitancy among traders to determine the market’s next direction, likely in anticipation of the event’s outcome. Following the completion of the halving event, the market has exhibited a gradual upward trajectory in price. As of recently, the Bitcoin market has reestablished support above the $65,000 threshold, indicating a stabilizing trend. Presently, the market appears to be approaching equilibrium.
বিটকয়েন মার্কেট ডেটা
BTC/USD মূল্য এখন: $65,978
BTC/USD মার্কেট ক্যাপ: $1.3 ট্রিলিয়ন
বিটিসি/ইউএসডি সরবরাহকারী সরবরাহ: 19.7 মিলিয়ন
BTC/USD মোট সরবরাহ: 19.7 মিলিয়ন
BTC/USD CoinMarketCap র্যাঙ্কিং: #1
মূল স্তরগুলি
সহ্য করার ক্ষমতা: $ 70,000, 75,000 ডলার এবং 80,000 ডলার।
সহায়তা: $ 60,000, 55,000 ডলার এবং 50,000 ডলার।
সূচকের লেন্সের মাধ্যমে বিটকয়েন বাজার
The Bitcoin market is currently showing signs of an upward trend, albeit progressing at a measured pace. While price action indicates a gradual increase, resistance has become apparent near the $66,000 mark, slightly below the 20-day moving average. Despite the nuanced progress in the bull market, demand currently surpasses supply. However, a notable concern arises from the trading volume since April 19th. The volume of trade indicator reveals a series of three consistently small histograms since that date. Although, according to this ক্রিপ্টো সংকেত, trading volume has been low, demand continues to outstrip supply, resulting in market price rallies.
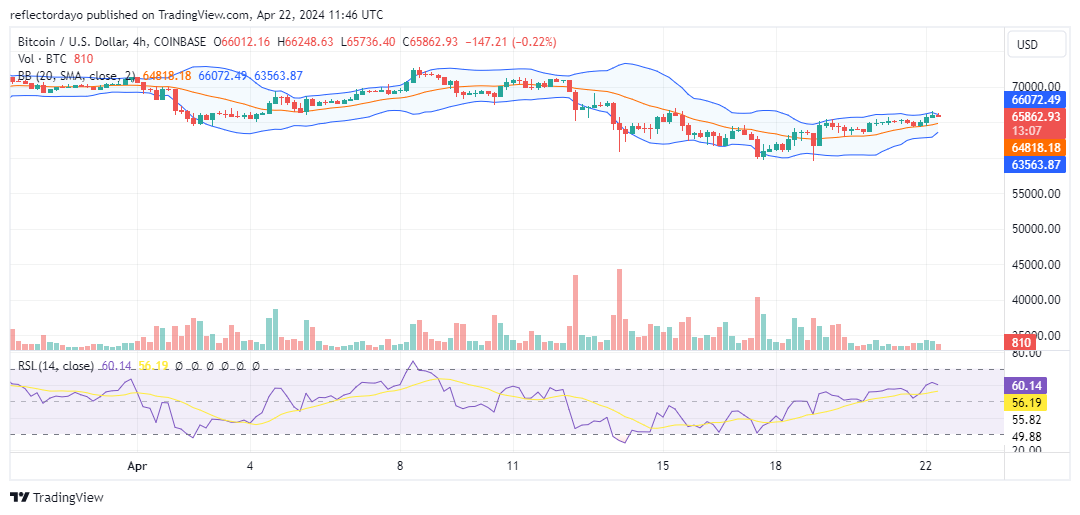
BTC/USD মূল্য পূর্বাভাস: 4-ঘন্টা চার্ট বিশ্লেষণ
4-ঘন্টার চার্ট বিশ্লেষণ করা হচ্ছে, we observe a resistance zone ranging from $66,000 to $66,500. Price action has stabilized within this range as bulls and bears engage in a balanced struggle. Notably, bearish positions around this level appear to be facing bullish pressure, evident in the consistent formation of higher lows by the bulls. A surge in trading volume could inject momentum into the market and potentially accelerate the ongoing bullish trend.
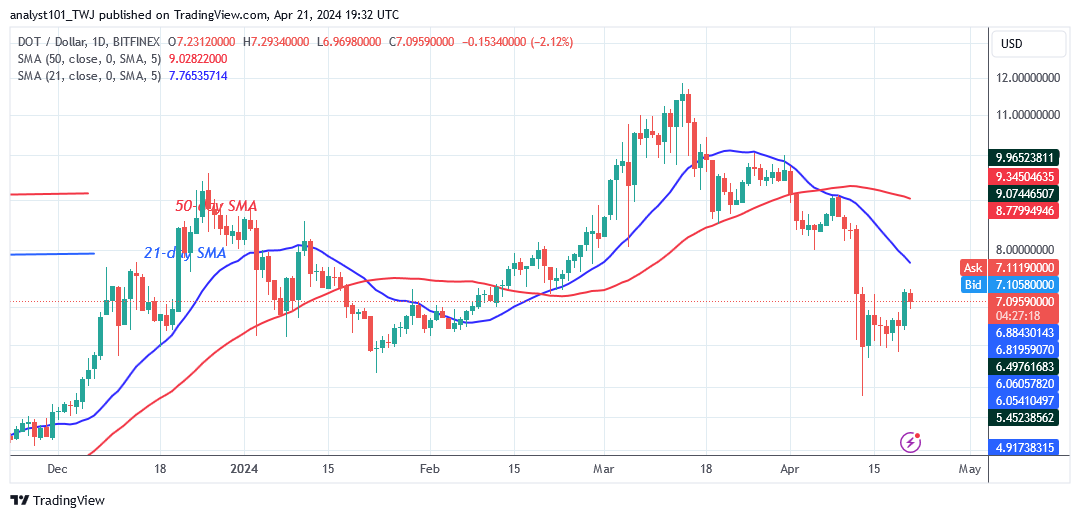
পোলক্যাডট (ডট) দীর্ঘমেয়াদী বিশ্লেষণ: জন্মদান পোলক্যাডোটস (ডিওটি) price has returned following the price drop on April 13, 2024, as purchasers recoup. The altcoin had previously plummeted to a low of $5.67 before bulls purchased the dips. The altcoin corrected upward and remained above the $6.20 support level. Over the last week, the altcoin has wavered between $6.20 support and below the moving average lines. The upward correction is encountering a first resistance at the high of $7.29.
Polkadot will resume its bullish trend if it rebounds and breaks above the moving average lines or the resistance level at $9.00. The bullish momentum will continue till the previous high of $11.85. However, if the bullish scenario is invalidated, the range-bound move will continue. polkadot বর্তমানে মূল্য $7.14.
ডট / ইউএসডি - দৈনিক চার্ট
প্রযুক্তিগত নির্দেশক: প্রধান প্রতিরোধের স্তরগুলি - $ 10, $ 12, $ 14 প্রধান সমর্থন স্তর - $ 8, $ 6, $ 4
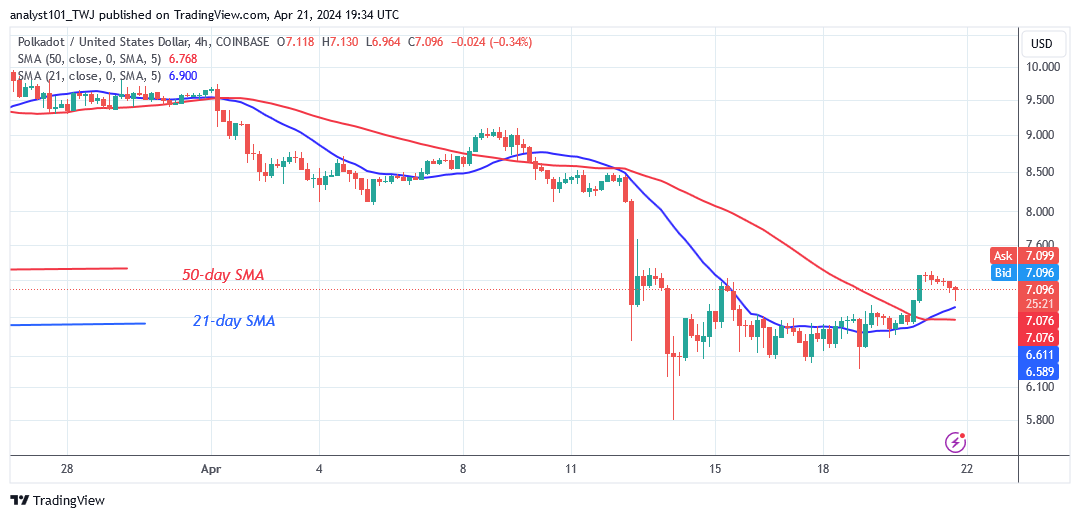
পোলক্যাডট (ডিওটি) সূচক বিশ্লেষণ Polkadot is gaining on the 4-hour chart since the price bars are higher than the moving averages. The rising movement has been hampered by the $7.25 opposition. The bullish momentum will be continued if the altcoin trades in the bullish trend zone or above the resistance level of $9.00.
পোলক্যাডট (ডিট) এর জন্য পরবর্তী দিকনির্দেশ কী? Polkadot is still trading above the $6.20 support level following the end of the bearish trend as purchasers recoup. The altcoin is currently trading between $6.20 and $7.25. When current price levels are breached, the cryptocurrency will trend. Meanwhile, ক্রিপ্টো সংকেত has remained range-bound pending the start of the trend.
বিঃদ্রঃ: ক্রিপ্টোসিনগালস.আরগ কোনও আর্থিক উপদেষ্টা নয়। কোনও আর্থিক সম্পদ বা উপস্থাপিত পণ্য বা ইভেন্টে আপনার তহবিল বিনিয়োগের আগে আপনার গবেষণা করুন। আমরা আপনার বিনিয়োগের ফলাফলের জন্য দায়ী না
Dash 2 Trade Price Forecast: D2TUSD Price Targets $0.01000 Supply amidst Market Surge, Enter Now! (April 22) Amidst the recent market sell-off, the D2TUSD price targets the $0.01000 level as the coin is currently recovering and also facing the upper channel. The coin will continue if the current support at $0.00378 holds. The crypto’s price may continue its upside moves to retest the $0.00505 previous high level which could further target the $0.01000 supply amidst market surge, provided buyers increase their actions in the market.
মূল স্তর: প্রতিরোধের স্তর: $ 0.00500, $ 0.00600, $ 0.00700 সমর্থন স্তর: $ 0.00350, $ 0.00300, $ 0.00250
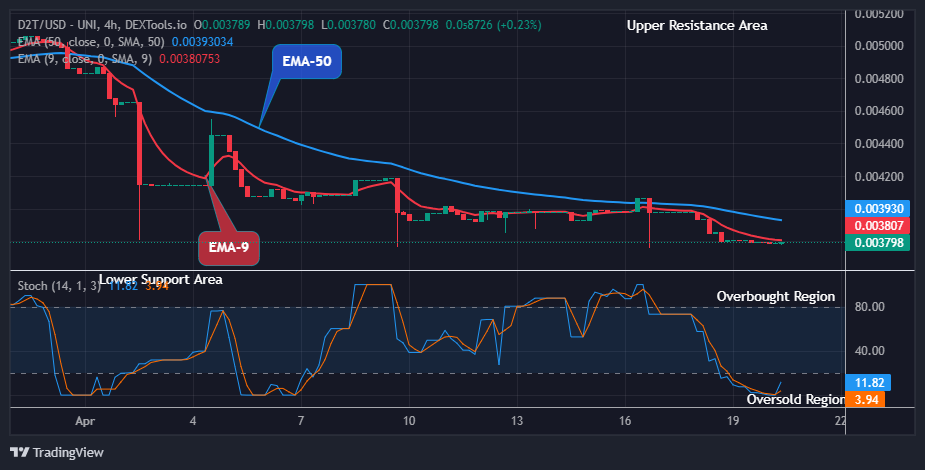
D2T (USD) দীর্ঘমেয়াদী প্রবণতা: বিয়ারিশ (4H চার্ট) ড্যাশ 2 ট্রেড price is in a bearish market at the moment. Further, the coin is trading slightly below the moving averages facing the resistance area. The sustained bearish pressure on the cryptocurrency at the $0.00378 support level during the previous session has dropped the price below the supply levels lately. However, the D2TUSD is regaining its strength back as we can see a new corrective move by the bulls at the support levels.
মুদ্রাটি সাম্প্রতিক সংশোধন থেকে পুনরুদ্ধার করছে কারণ ঊর্ধ্বমুখী রেস অনুসরণ করে সরবরাহ স্তরের কাছাকাছি নতুন কেনাকাটা আবির্ভূত হয়েছে।
ইতিবাচক অনুভূতি সঙ্গে, ড্যাশ 2 ট্রেড price rallied up to the $0.00379 resistance value below the moving averages as a pullback and breached the $0.00378 barrier as the 4-hourly chart opens today.
Thus, a possible breakout from the $0.00379 neckline will accelerate the buying momentum and push the prices higher to hit the $ 0.00505 previous resistance levels. This will bolster more buying pressure on the crypto to the upper resistance levels.
Notably, the market is now pointing up below the 14% range of the daily stochastic. This means the crypto market is oversold and the emergence of bullish pressure is crucial at this moment.
তাই ষাঁড়ের দাম ঘুরে দাঁড়াবে বলে আশা করা হচ্ছে D2TUSD এবং লক্ষ্যমাত্রা হতে পারে $0.01000 সরবরাহ মূল্য তার উচ্চ সময়ের ফ্রেমে সামনের দিনগুলিতে বাজারের উত্থানের মধ্যে।
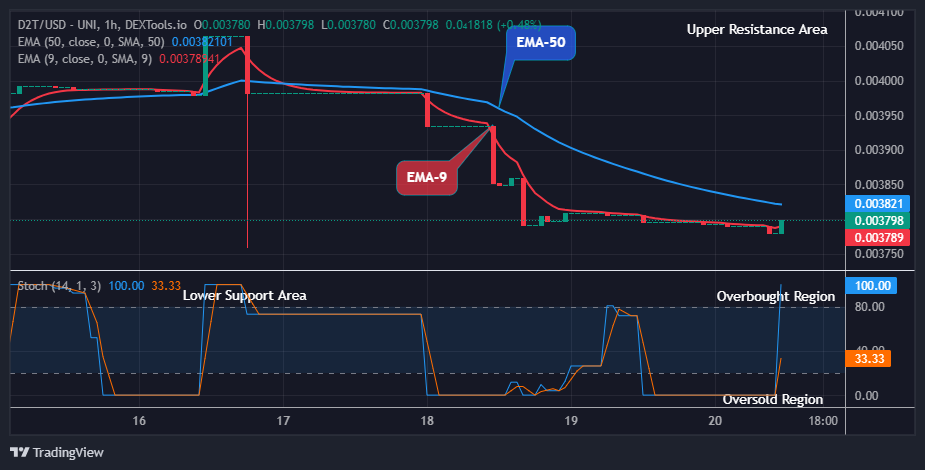
D2T (USD) মধ্যমেয়াদী প্রবণতা: বুলিশ (1H চার্ট) উপরের চার্টটি বিশ্লেষণ করলে আমরা তা দেখতে পারি D2TUSD is in a bullish market zone. The price currently trades slightly above the EMA-9. This means that the coin is in an uptrend. এই জুটি আগের ক্রিয়াকলাপের সময় $0.00380 প্রতিরোধের স্তরে পৌঁছেছে এবং এর সাম্প্রতিক উচ্চতায় সরবরাহ প্রবণতা লাইনের উপরে মুদ্রার দাম বজায় রেখেছে।
At the time of writing this article, after completing the sideway moves, the ড্যাশ 2 ট্রেড buyers successfully pushed the coin price up to a $0.00379 high level above the EMA-9.
This is an indication of an upward momentum in the context of the strength of the market. Hence, with sustained buying, the coin price could challenge the previous resistance zone of $0.00406 level, indicating buyers’ attempt to prolong the bullish rally.
ইতিমধ্যে, বাজারের ঊর্ধ্বগতির মধ্যে এই জুটির একটি টার্গেট মূল্য $0.01000 সরবরাহ স্তর রয়েছে কারণ এটি দৈনিক স্টকাস্টিক উপরের দিকে নির্দেশিত দ্বারা নির্দেশিত হিসাবে উপরের প্রতিরোধে তার আপট্রেন্ড আন্দোলন অব্যাহত রাখে। সুতরাং, উল্লিখিত লক্ষ্যটি তার মধ্যমেয়াদী পরিপ্রেক্ষিতে শীঘ্রই পৌঁছতে পারে।
Perhaps the most helpful approach to improve your trading success is backtesting.
⚒️ ব্যাকটেস্টিং আপনার ট্রেডিং কর্মক্ষমতা উন্নত করার জন্য সম্ভবত সবচেয়ে মূল্যবান হাতিয়ার।
অনেক উপায়ে এটি একটি গেমচেঞ্জার, যা আপনাকে দেখতে দেয় যে কীভাবে আপনার কৌশলগুলি বাস্তব-বিশ্বের বাজারের পরিস্থিতিতে ন্যায্য হবে।
In our recent analysis of SPONGE/USD prices, we observed a notable level of stability in the market, particularly evident around the $0.00005 price point, specifically at $0.000048. Despite sideways movement persisting around the $0.000050 price threshold, there has been a slight bullish inclination observed. This shift is particularly noteworthy as it reflects a transition from the range between $0.000045 and $0.000050. Although relatively minor, this movement holds significant implications, indicating a pronounced willingness among traders to engage at this level.
মূল বাজার গতিবিদ্যা:
প্রতিরোধের স্তর: $0.0010, $0.0011, এবং $0.0012।
সমর্থন স্তর: $ 0.000035, 0.000030 ডলার এবং 0.000025 ডলার।
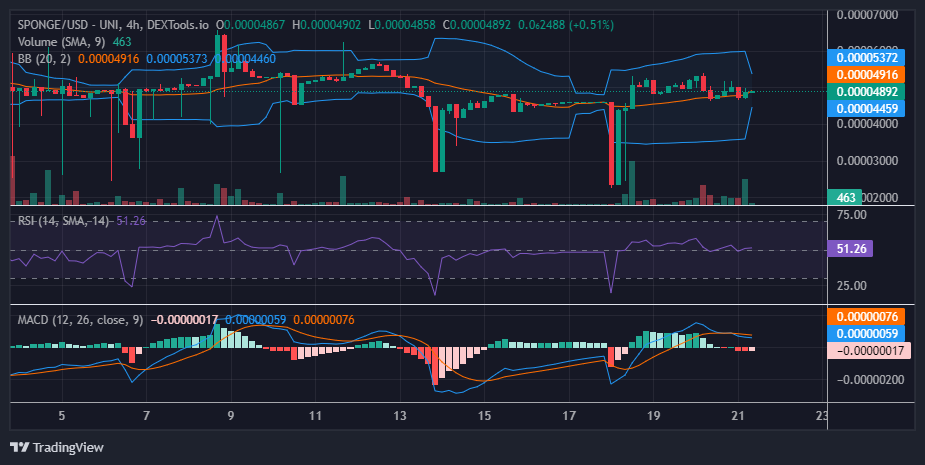
$SPONGE (SPONGE/USD) এর জন্য প্রযুক্তিগত বিশ্লেষণ করা:
Upon analysis of the 4-hour chart, we have observed a market exhibiting a sideways trend within the Bollinger Band indicator, characterized by a notable bandwidth. Despite this sideways movement, volatility around the $0.00005 price level appears substantial. However, a notable development is the sharp contraction of the band, suggesting a significant decrease in volatility. This ক্রিপ্টো সংকেত hints at an imminent breakout in স্পঞ্জ/ইউএসডি market prices, with indications leaning towards a potential upward movement. This expectation is reinforced by the observation of a higher low secured at the $0.000047 price level within the bullish trend, following the previous low at $0.000023. Moreover, considering the consistent and swift price recoveries below the $0.00005 price level, there appears to be a strong bullish sentiment prevailing in this range.
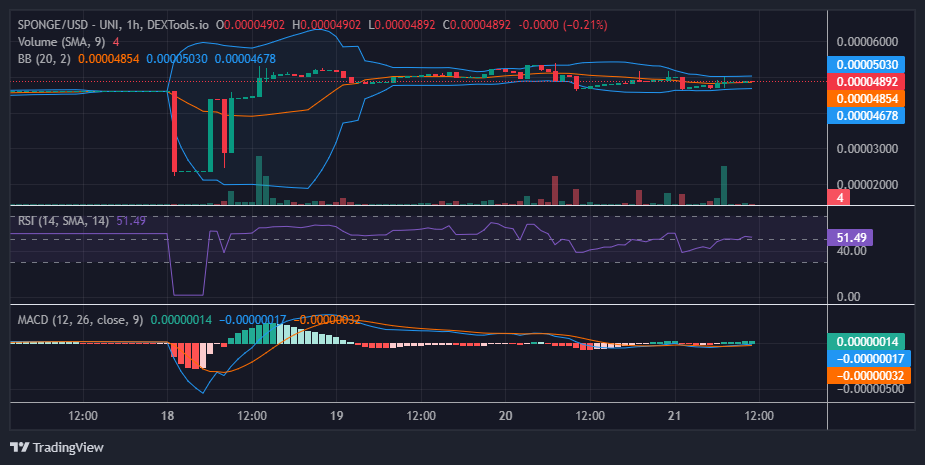
1-ঘণ্টার দৃষ্টিকোণ থেকে অন্তর্দৃষ্টি:
On a shorter timeframe, we’ve observed the price action consolidating within a narrow price channel, predominantly hovering around the $0.000048 level, accompanied by Bollinger Bands indicating a minimal bandwidth. Examination through the lens of the Relative Strength Index reveals the market is positioned at its midpoint. Presently, the market appears to be in anticipation of a catalyst, with indications suggesting a potential continuation of its bullish trajectory in the forthcoming price movements.
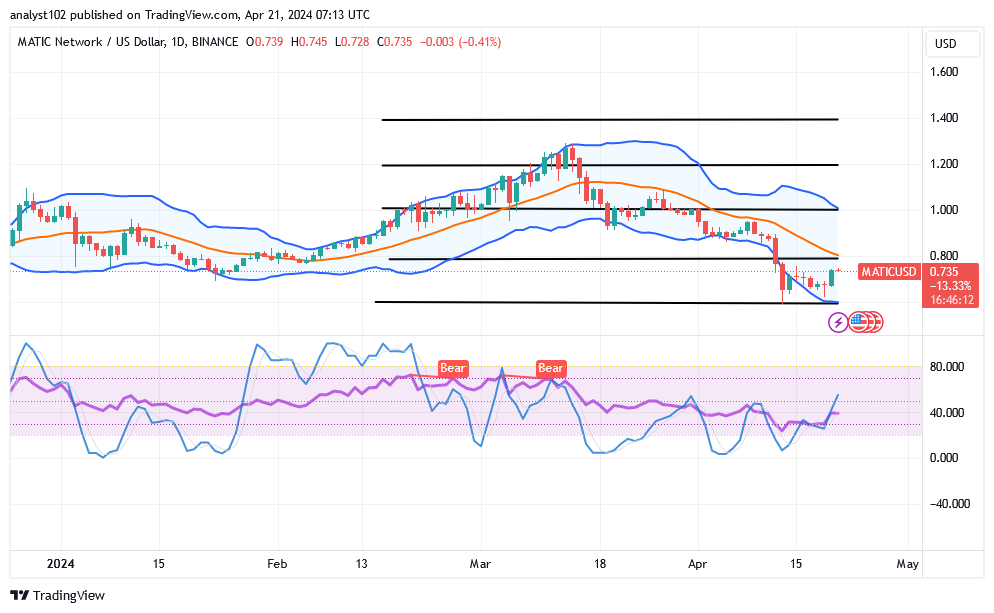
Over a couple of sessions now, there has been a slow motion to cause further drawbacks in the market worth of Polygon বাণিজ্য against the valuation of the US Dollar, as the situation presently has it that the price is on a base, attempting a recovery.
The $0.60 value line has created support when viewed from the angle of the lower Bollinger Band trend line. Additionally, it appears to be more resilient to any attempts by bears to accelerate drops. Technically speaking, it is also acceptable for players holding long positions to place orders along the lines of yesterday’s bullish candlestick.
MATIC/USD বাজার মূল স্তর: প্রতিরোধের মাত্রা: $$090, $1.10, $1.30 সমর্থন স্তর: $ 0.60, $ 0.55, $ 0.50
MATIC/USD - দৈনিক চার্ট The MATIC/USD daily chart reveals that the crypto-economic market is on a base, attempting a recovery after it approaches the point of $0.60.
The Bollinger Band trend lines have stretched to the south side, affirming that some lines found around the point of $0.60 will be instrumental in observing decent recouping entries for longing position orders. The stochastic oscillators are in an attempt to swerve northbound, placing them briefly past the point of 40, signaling that the pace of the movements is running in a tentative positive mood.
Would it be technically necessary for the MATIC/USD market to once again test the $0.60 line?
There might still be room for some moves tending to pull down in averaging the line of $0.60, as the present situation has it that the MAIC/USD price is on a base, attempting a recovery.
It is logically recommended that long-position movers buckle up to play alongside most active moves that are liable to propel the market points toward the point of the middle Bollinger Band. Be it in the near or long-term running style, the price is likely to increase beyond the point of $1.
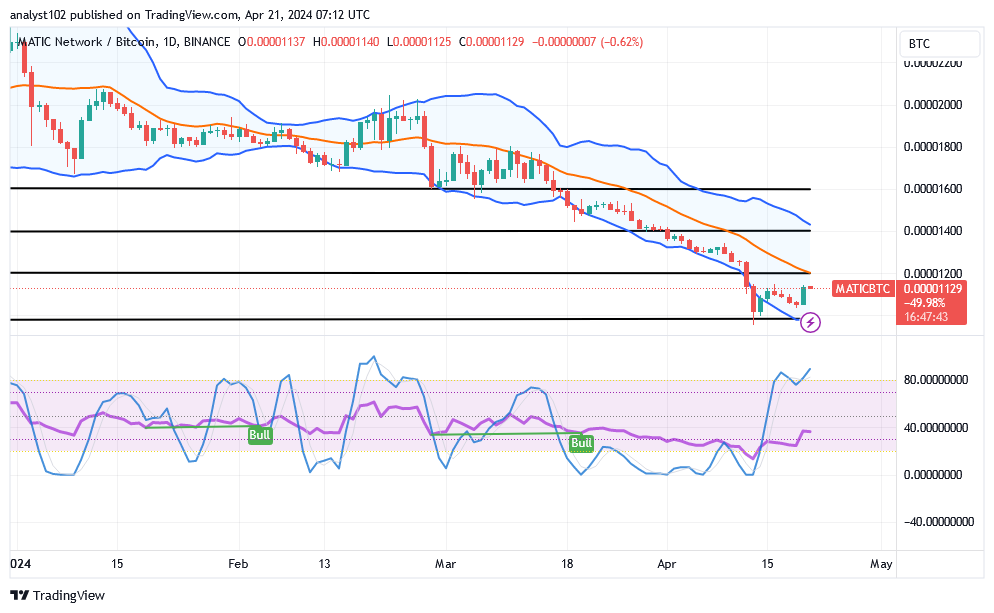
According to a closure psychological outlook, the middle Bollinger Band’s trending route is the main zone influencing the current correctional action. Bears need to reclaim their positions if that feeling continues, which calls for a test of the area surrounding that point combined with an active price rejection signal. MATIC/BTC মূল্য বিশ্লেষণ তুলনায়, বহুভুজ বাণিজ্য is on a basis versus the market line of Bitcoin, attempting to recover from the lower end of the indicators.
The trend lines of the Bollinger Band are currently searching for a strong baseliner on their lower side to prevent further declines in the near future. It has been possible for the stochastic oscillators to swing higher and enter the overbought zones. This suggests that, although giving the basic cryptocurrency more weight than its counterpart for the time being, some caution must be exercised.
বিঃদ্রঃ:ক্রিপ্টোসিনগালস.আরগ কোনও আর্থিক উপদেষ্টা নয়। কোনও আর্থিক সম্পদ বা উপস্থাপিত পণ্য বা ইভেন্টে আপনার তহবিল বিনিয়োগের আগে আপনার গবেষণা করুন। আমরা আপনার বিনিয়োগের ফলাফলের জন্য দায়ী না।
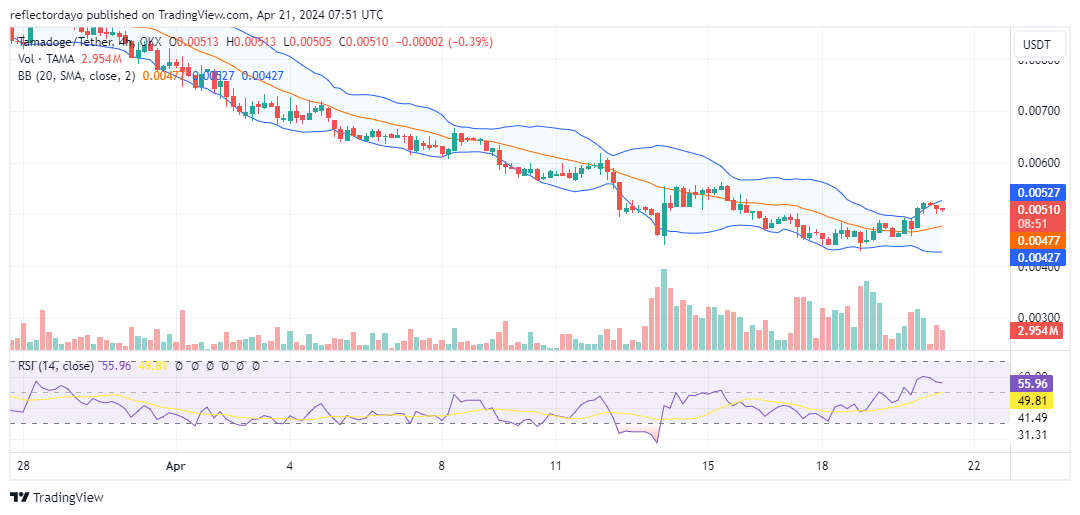
In the latest analysis of তামাদোগে prices, it was observed that persistent bearish pressure compelled bullish investors to seek solace at a nearby support level approximately at $0.0045. However, subsequent price movements indicated a subtle shift towards the pivotal $0.005 threshold, suggesting an emerging bullish sentiment. Subsequently, the market witnessed a breakthrough beyond the $0.005 level, signifying a strengthening bullish momentum. Presently, the ক্রিপ্টো সংকেত suggests that bullish investors are now seeking support levels beyond this threshold.
মূল স্তরগুলি
প্রতিরোধ: $0.013, $0.014, এবং $0.015।
সমর্থন: $0.0045, $0.0040, এবং $0.0035।
TAMA/USD মূল্য বিশ্লেষণ: সূচকের দৃষ্টিকোণ
The current market sentiment is characterized by bullish attempts to reclaim the $0.005 price level, formerly a support level that transitioned into resistance during the recent bearish trend. Upon closer examination of the chart, a recurring pattern of bearish price rejections at this level is evident. This consistent refusal of bearish pressure at the $0.005 threshold is anticipated to reinforce it as a robust support, capable of sustaining the bullish trajectory of the market. Notably, the upper Bollinger Bands are indicative of this bullish activity, exhibiting an upward trend. Similarly, the 20-day moving average is beginning to show signs of upward momentum, further affirming the bullish sentiment.
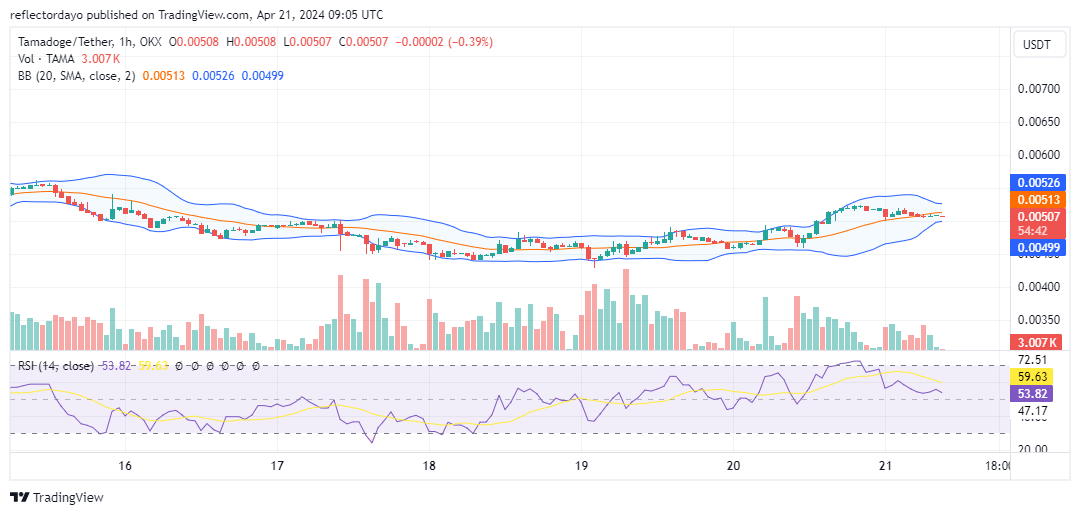
Tamadoge স্বল্প-মেয়াদী আউটলুক: 1-ঘন্টা চার্ট
From an analysis of the 1-hour chart‘s price action, a notable observation is the stabilization of the Tamadoge prices around the $0.005 mark. The emergence of repeated dojis at this level indicates a significant bullish presence and a firm commitment from buyers to drive the market upward. Additionally, the convergence of the Bollinger Bands suggests a balance between supply and demand, resulting in decreased volatility. This convergence reinforces the bullish sentiment in this area, hinting at a potential market rebound from this level.
Tamadoge কিনুন!
Day 2 of the Tamadoge Pursuit contest!
The top player on the High Score leaderboard gets an $100 of $সঠিক – on top of your regular share of prizes 🐶
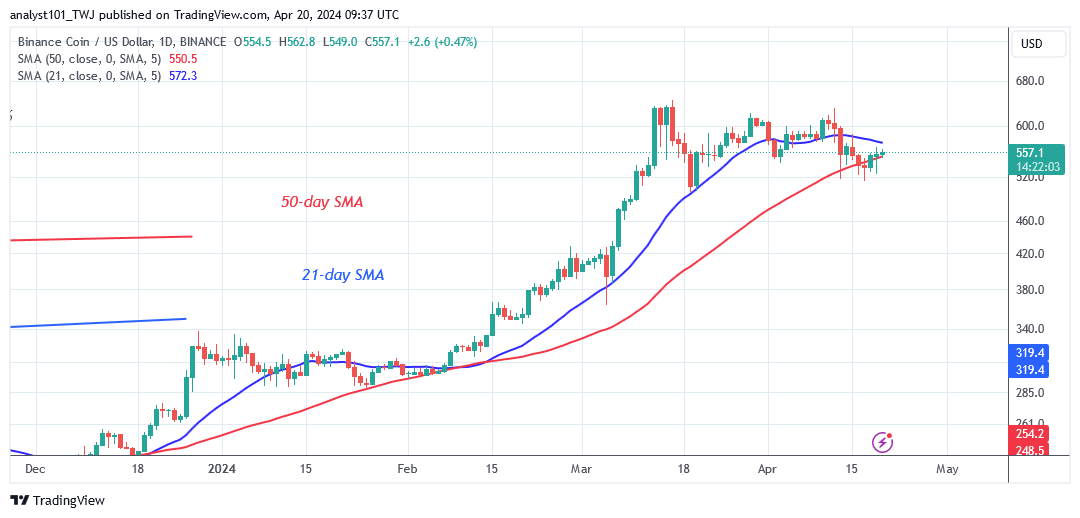
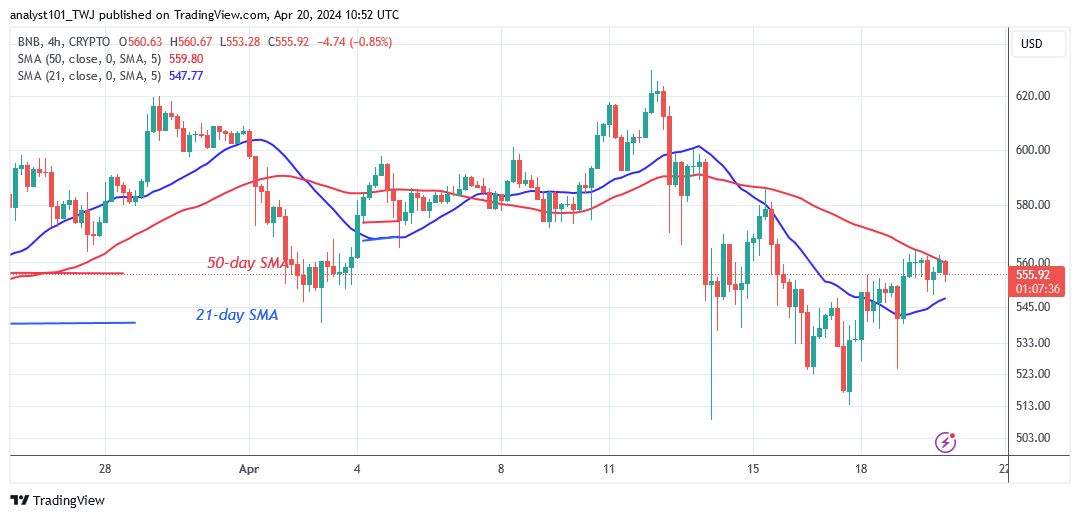
বিএনবি (বিএনবি) দীর্ঘমেয়াদী বিশ্লেষণ: রেঞ্জিং মার্চ 17, 2024 তে, BNB’s upswing stops, and the sideways trend returns. The altcoin reached a peak of $645 during the last rise before being pushed back. BNB fell above the 21-day SMA and entered a price range of $520 to $630. On the downside, bulls have halted the drop above the $520 level, with the altcoin rebounding above the present barrier.
However, if bears break the $520 support level, the altcoin would fall to a low of $420. Nonetheless, the rising trend is meeting an initial resistance at the moving average lines. A price rebound will push the altcoin above the moving average lines and the $630 resistance level. The positive momentum will continue to the high of $645. In the meantime, BNB / ইউএসডি লেখার সময় মূল্য $570।
বিএনবি / ইউএসডি - দৈনিক চার্ট
প্রযুক্তিগত নির্দেশক: প্রধান প্রতিরোধের স্তরগুলি - $ 600, $ 660, $ 720 প্রধান সমর্থন স্তর - $ 400, $ 340, $ 280
BNB (BNB) নির্দেশক বিশ্লেষণ BNB recovered, and the price bars now fall between the moving average lines. The trapping of the price bars implies that the current price levels will remain range bound within a range. The moving average lines have stayed range-bound, indicating a sideways trend.
বিএনবি (বিএনবি) এর পরবর্তী নির্দেশনা কী? BNB’s sideways trend returns due to the presence of Doji candlesticks. The Doji candlesticks controlled and guided the price movement. Furthermore, either the bulls or the bears must break the range-bound levels for the altcoin to trend. ক্রিপ্টোকারেন্সি সিগন্যাল stayed range-bound as bulls halted the decline above $520.
বিঃদ্রঃ:Cryptosignals.org একটি আর্থিক উপদেষ্টা নয়। কোনো আর্থিক সম্পদ বা উপস্থাপিত পণ্য বা ইভেন্টে আপনার তহবিল বিনিয়োগ করার আগে আপনার গবেষণা করুন। আপনার বিনিয়োগের জন্য আমরা দায়ী নই ফলাফল
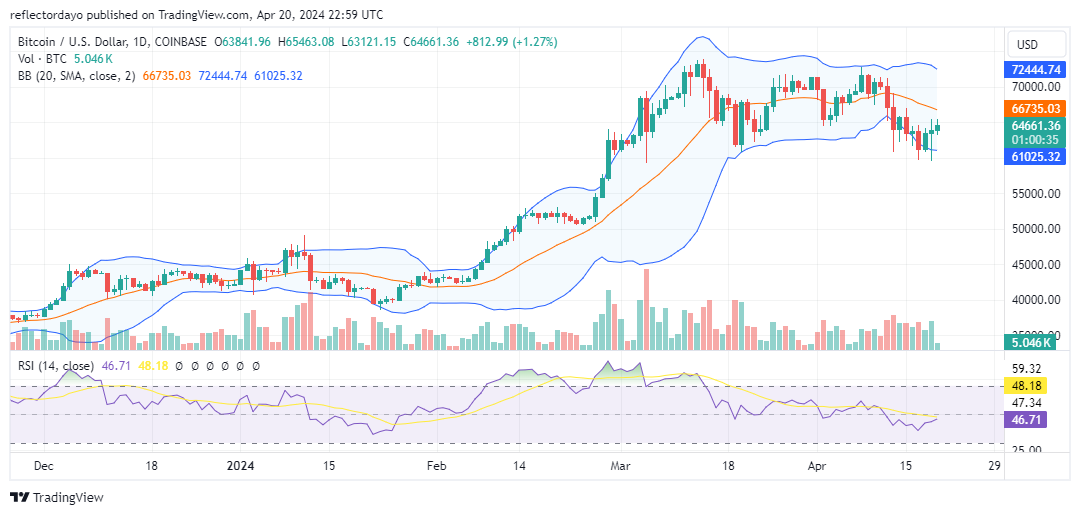
In anticipation of the Bitcoin (BTC) halving event over the past week, there has been a notable pause observed across the broader cryptocurrency market. However, as the week progressed, a decline became apparent, with market activity slowing in the lead-up to the event. Following the occurrence of the Bitcoin halving, there was a subsequent resurgence in market activity, indicating renewed vitality.
বিটকয়েন (বিটিসি)
প্রধান পক্ষপাত: বুলিশ
In today’s top five trending markets, Bitcoin maintains its leading position, as it did last week, primarily driven by anticipation surrounding the long-awaited halving event. This anticipation has spurred a notable increase in search volume throughout the week, solidifying Bitcoin as the most sought-after market.
Throughout the week, the Bitcoin (BTC) market faced significant bearish pressure, resulting in a downturn below the $65,000 price level. However, the key support level at $60,000 has demonstrated resilience, with bearish pressure showing no significant signs of strength around this level. In today’s market, we observe a rebound in price towards the key resistance level at $65,000, indicating a resurgence of bullish sentiment. While yesterday’s market exhibited indecision, today’s market reflects a noticeable spike in bullish sentiment, with increased pressure on the key resistance level.
বর্তমান মূল্য: $64,697
বাজার মূলধন: $ 1.3 ট্রিলিয়ন
লেনদেন এর পরিমান: 24 বিলিয়ন $
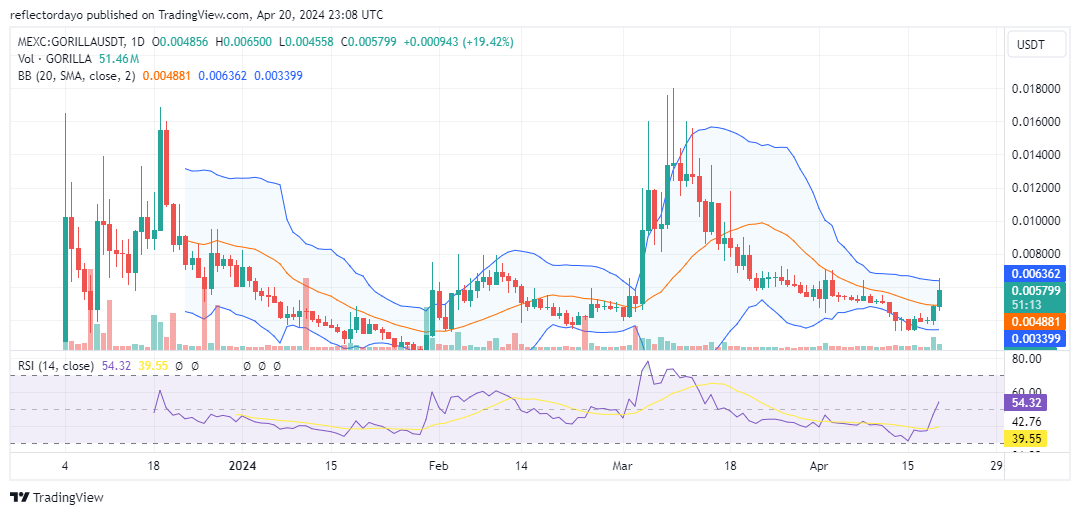
গরিলা (গোরিলা)
প্রধান পক্ষপাত: বুলিশ
The Gorilla market has experienced a downtrend since March 10, following a peak in price action at $0.0180. The bearish momentum persisted until it encountered a significant bullish support at $0.0040. The resilience displayed by the bulls around this price point has been notable, particularly amidst the turbulence witnessed across the crypto market this week.
Even in yesterday’s market, a bullish trend was evident, bringing prices in alignment with the 20-day moving average, and this momentum has carried over into today’s trading session. However, a notable presence of bears has been observed near a resistance level of $0.006. The emergence of both formidable resistance and support levels suggests a potential consolidation phase in the market.
For a complete shift towards a bullish trajectory, it’s imperative for bulls to solidify their position above $0.006. This will be pivotal in guiding the market towards a sustained bullish course.
বর্তমান মূল্য: $1.19
বাজার মূলধন: $ 4.8 মিলিয়ন
লেনদেন এর পরিমান: $ 1.2 মিলিয়ন
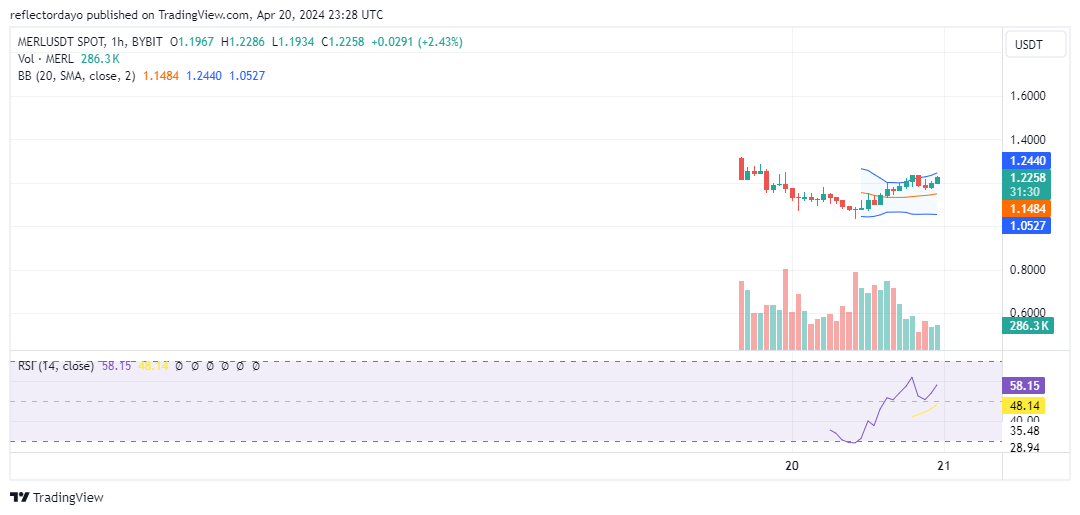
মেরলিন চেইন (MERL)
প্রধান পক্ষপাত: বুলিশ
The Merlin Chain market, as depicted in the chart utilized for this analysis, appears to have surged yesterday, April 19, possibly leveraging the typical hype associated with newly-entered markets, thereby securing the third position among the most searched markets for today.
Following significant price activity observed in the market yesterday, which saw prices soaring from $0.4 to a peak of $1.9 within the initial 4-hour session (from a 4-hour chart perspective, commencing around 8:00 am), the market began to stabilize, settling around the $1.22 price level.
Currently, based on the 1-hour chart perspective, the bulls have managed to maintain a slight advantage, retaining their position above the 20-day moving average. This suggests the potential for further robust price movements throughout the week. Bulls are striving to establish a support level around $1.20, with the upper Bollinger Bands indicating a positive response to this bullish activity.
বর্তমান মূল্য: $1.22
বাজার মূলধন: $ 291 মিলিয়ন
লেনদেন এর পরিমান: $ 122 মিলিয়ন
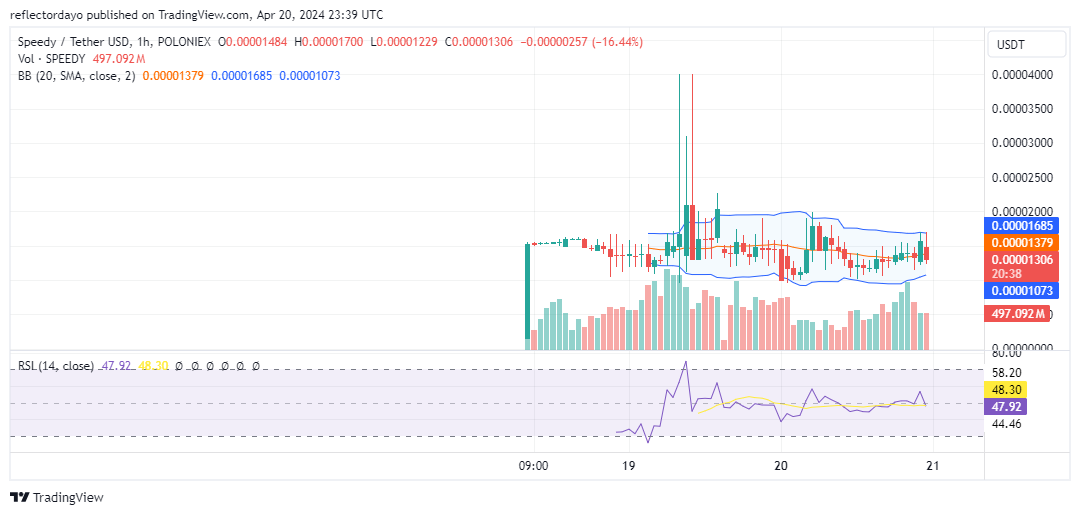
দ্রুত (SPEEDY)
প্রধান পক্ষপাত: বিয়ারিশ
Similar to the Merlin Chain market, this particular market also appears to have recently entered the scene, as indicated by the chart data emerging on April 18. Likely fueled by the excitement surrounding new market entries, the market has exhibited considerable volatility, witnessing erratic swings reaching highs of $0.00004 from a starting point of $0.000011. Presently, the market has found stability around $0.000014.
However, it’s worth noting that the presence of upper and lower shadows on the candlesticks, indicative of price action, suggests active engagement from both buyers and sellers in the market. This underscores the ongoing dynamics of supply and demand influencing market movements.
বর্তমান মূল্য: $0.0000144
বাজার মূলধন: $ 12.7 মিলিয়ন
লেনদেন এর পরিমান: $ 0.9 মিলিয়ন
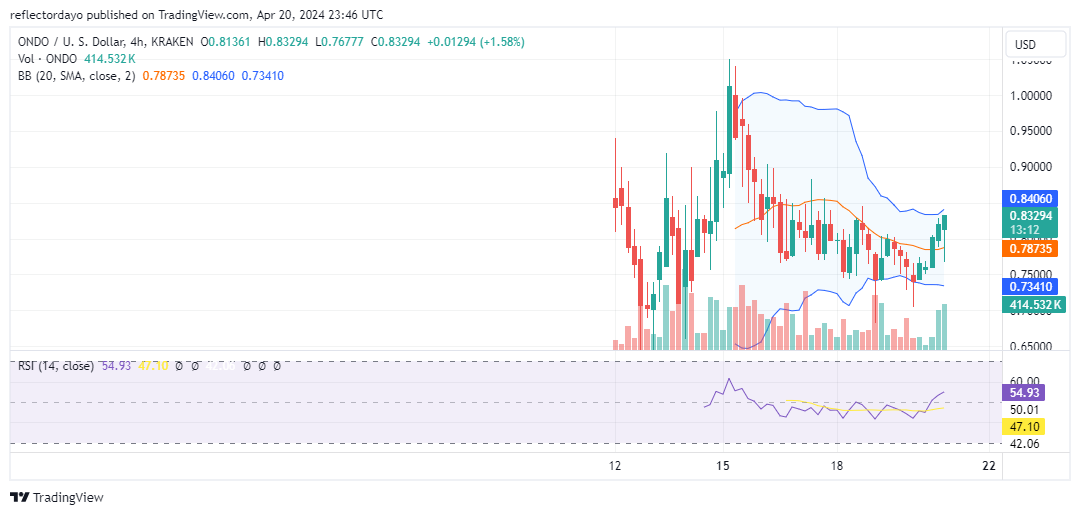
ওন্ডো (ONDO)
প্রধান পক্ষপাত: বুলিশ
The Ondo market experienced significant volatility throughout this week. Prior to this period, the market had been on an upward trajectory, culminating in a breach of the $1.00 price threshold on Monday. This breakthrough prompted a widespread sell-off as investors reacted to the market surpassing this crucial price point. Both the bullish momentum of the previous week and the subsequent bearish trend of this week contributed to the heightened volatility.
As the week progressed and the weekend approached, the intensity of the volatility began to subside, a trend notably reflected in the behavior of the Bollinger Bands indicator.
In today’s trading session, bullish sentiment has dominated the market, leading to a resurgence in prices as buyers entered the fray around the $0.75 price level. This upward movement has prompted a response from the upper Bollinger Bands, indicating a shift in market dynamics.
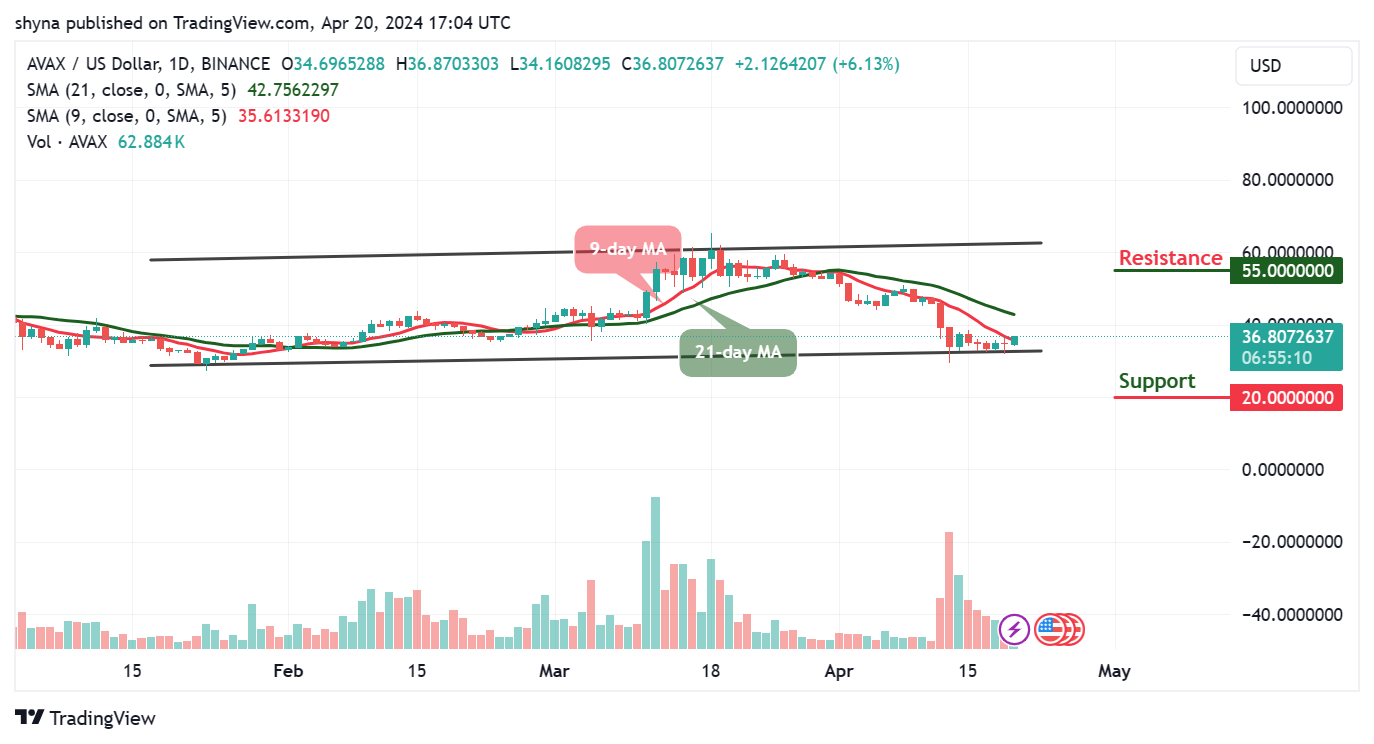
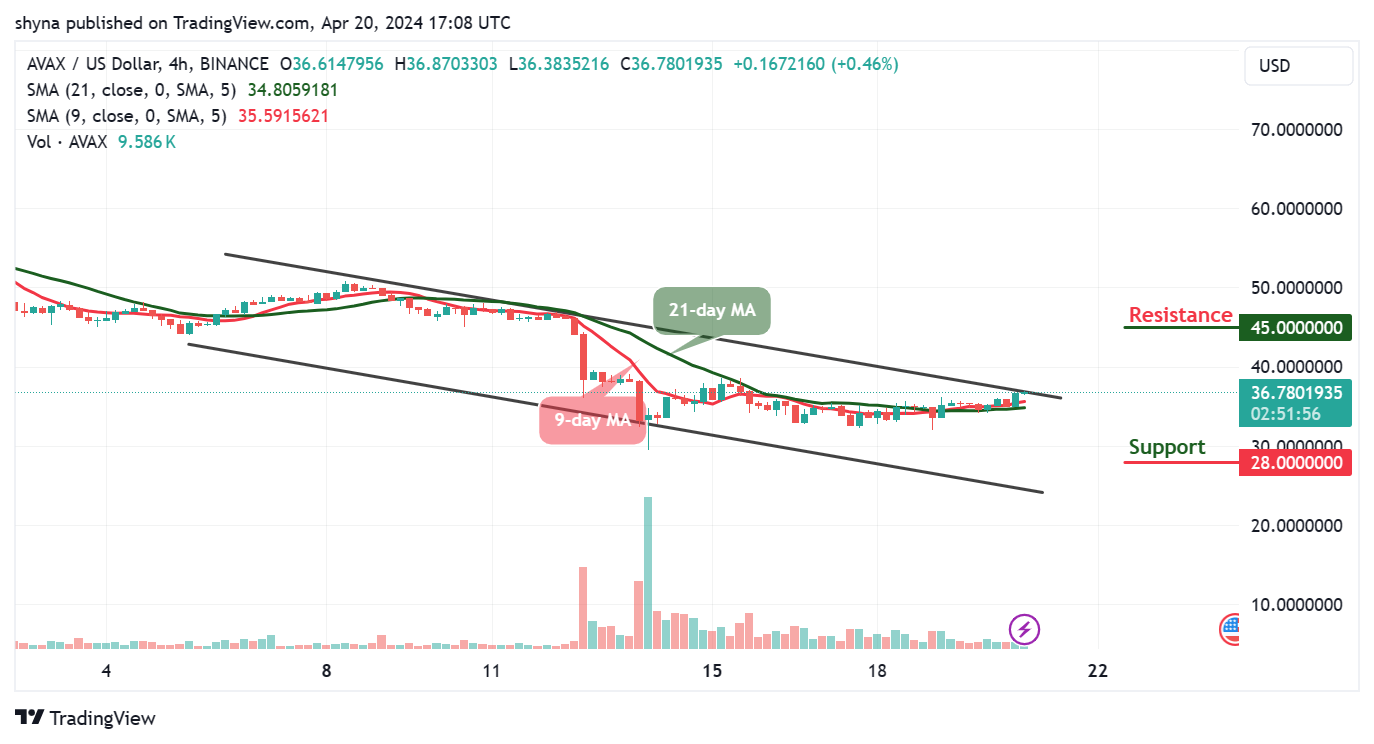
লেখার সময় হিসাবে, AVAX/USD is at $36.80. The coin is currently edging above the 9-day moving average, indicating bullish activity. While the overall trend remains range-bound, an upward trajectory is possible if buying pressure persists.
Avalanche Price Prediction: Will AVAX Head Higher?
AVAX is likely to breach the 9-day and 21-day moving averages around the $36.80 resistance level. However, the 9-day MA’s positioning below the 21-day MA could impede significant upward movement, potentially pushing the coin below the lower boundary of its current range.
Recovery may face hurdles, particularly around the $35 mark. Conversely, sustained bullish momentum could lead AVAX to test resistance levels at $55, $60, and $65. Conversely, a sharp market downturn would find critical support at $20, $15, and $10.
AVAX/USD মধ্যমেয়াদী প্রবণতা: বিয়ারিশ (4H চার্ট)
4-ঘন্টা চার্টে, AVAX/USD appears to be consolidating within a downward channel. Despite touching a daily high of $36.87 above the 9-day and 21-day moving averages during the European session, a single robust support level is observable at $30, with potential support further down at $28.
AVAXUSD - 4-ঘন্টার চার্ট
The 9-day MA remains above the 21-day MA, suggesting a possible upward trajectory. Should AVAX break above the upper boundary of its channel, resistance levels at $45 and beyond could be tested.