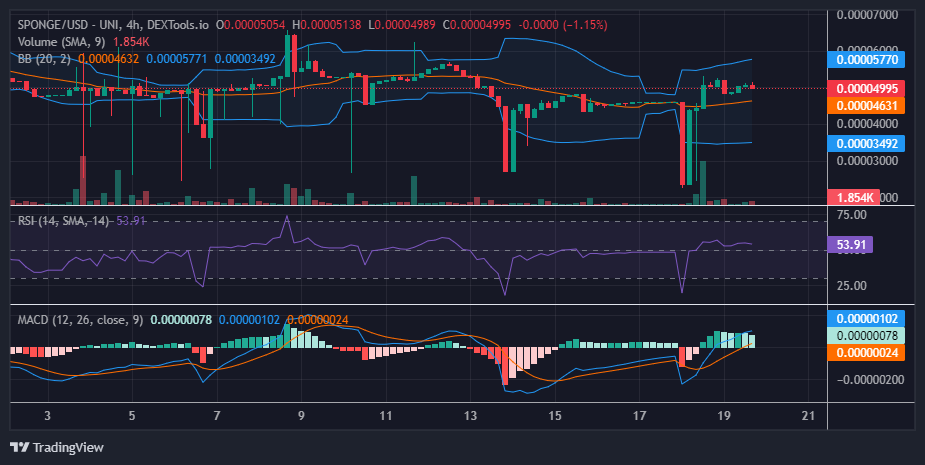
For a span of two days, the $SPONGE market remained stagnant at approximately $0.000044 as buyers and sellers found themselves in a deadlock. However, the market regained momentum when a sudden hyper-bearish move escalated market volatility since yesterday’s trading session. This, in turn, revived the bull market as traders began to buy the dip. This momentum continued into today as the market witnessed a notable shift in dynamics, marked by a substantial surge in price. This upturn followed the emergence of a Dragonfly Doji candlestick pattern around the $0.000044 price threshold, catalyzing a significant breakout. Consequently, bullish sentiment is poised to prevail, targeting the $0.00005 price milestone.
Dinamica Chjave di u Mercatu:
Livelli di resistenza: 0.0010 $, 0.0011 $ è 0.0012 $.
Livelli di Supportu: 0.000035 0.000030 $, 0.000025 XNUMX $, è XNUMX XNUMX $.
Scuprite in l'Analisi Tecnica per $ SPONGE (SPONGE/USD):
The Dragonfly Doji signals a noteworthy recovery in the bullish market following a sharp dip to the $0.000024 price level. However, market activity then stagnated around the $0.000044 mark before a breakout occurred. The strength of this breakout compelled bears to retreat to the $0.00005 price level. Despite their resurgence at this level, a near-support level has formed at $0.0000482, effectively halting further price declines.
Indicators suggest a marginal victory for the bulls, with the Relative Strength Index (RSI) indicating bullish momentum slightly above the 50 level. Additionally, the RSI line has consistently hovered around the 53 level for a few sessions. If this back-and-forth between bulls and bears persists, volatility may decrease, leading to Bollinger bands converging into narrower bands. Such a convergence could signal an imminent price breakout.
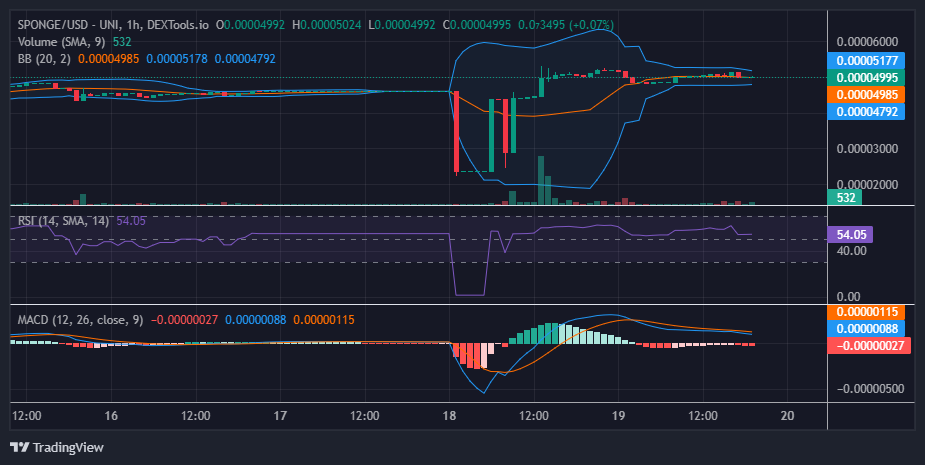
Insights da a prospettiva di 1 ora:
Da a perspettiva di u graficu di 1 ore, the price action is exhibiting sideways movement within a narrow range, slightly above the 20-day moving average. This consolidation phase suggests an impending climax in the ongoing tug-of-war between buyers and sellers, hinting at a potential breakout in the near future. Given this signale criptu, that is, the current position above the 20-day moving average, the breakout is anticipated to occur in the upside direction.
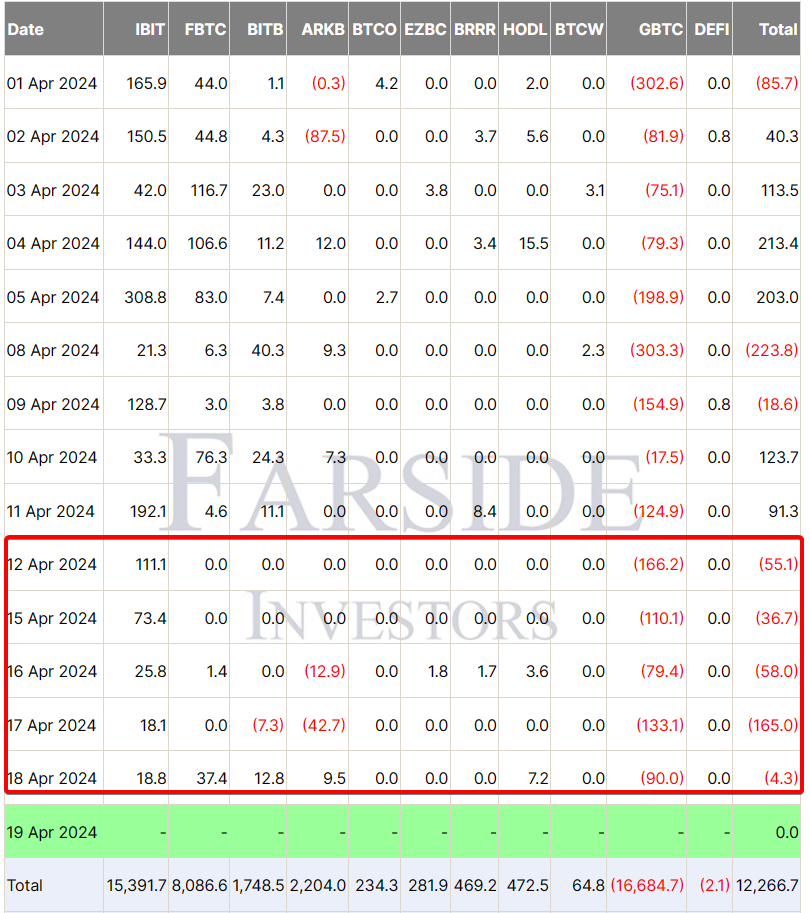
Spot Bitcoin (BTC) exchange-traded funds (ETFs) based in the U.S. are undergoing a notable trend, catching the attention of market participants. In the last five days, these ETFs have witnessed a consistent outflow, totaling $4.3 million as of Thursday. This development comes as the cryptocurrency community anticipates the upcoming mining reward halving, an event historically associated with a bullish market.
Net Outflows for Bitcoin ETFs Exceed $319 Million in 5 Days
According to industry reports from Farside Investors, as reported by CoinDesk, a net outflow exceeding $319 million has been observed from these ETFs since April 12. À mezu à elli Grayscale’s Bitcoin Trust (GBTC) has seen a significant decrease, losing $166.2 million in a single day (on April 12).Tuttavia, the negative trend was partially offset by inflows into Fidelity’s FBTC and BlackRock’s IBIT.
Image via Farside Investors
Grayscale’s underperformance can be attributed to its fee structure since its inception. While the outflows from GBTC are not overly concerning, the recent slowdown in inflows into other Bitcoin ETFs is noteworthy. For example, BlackRock’s IBIT experienced only $18.8 million in inflows on Thursday, a sharp contrast to the $308.8 million peak earlier in the month.
Matrixport’s market update highlights a slowdown in chiavi liquidity drivers, such as the growth of stablecoins and inflows into U.S.-listed Bitcoin ETFs. chistu suggests a saturation in demand for these financial products, as not even a 10-15% dip in Bitcoin prices has sparked significant net inflows.
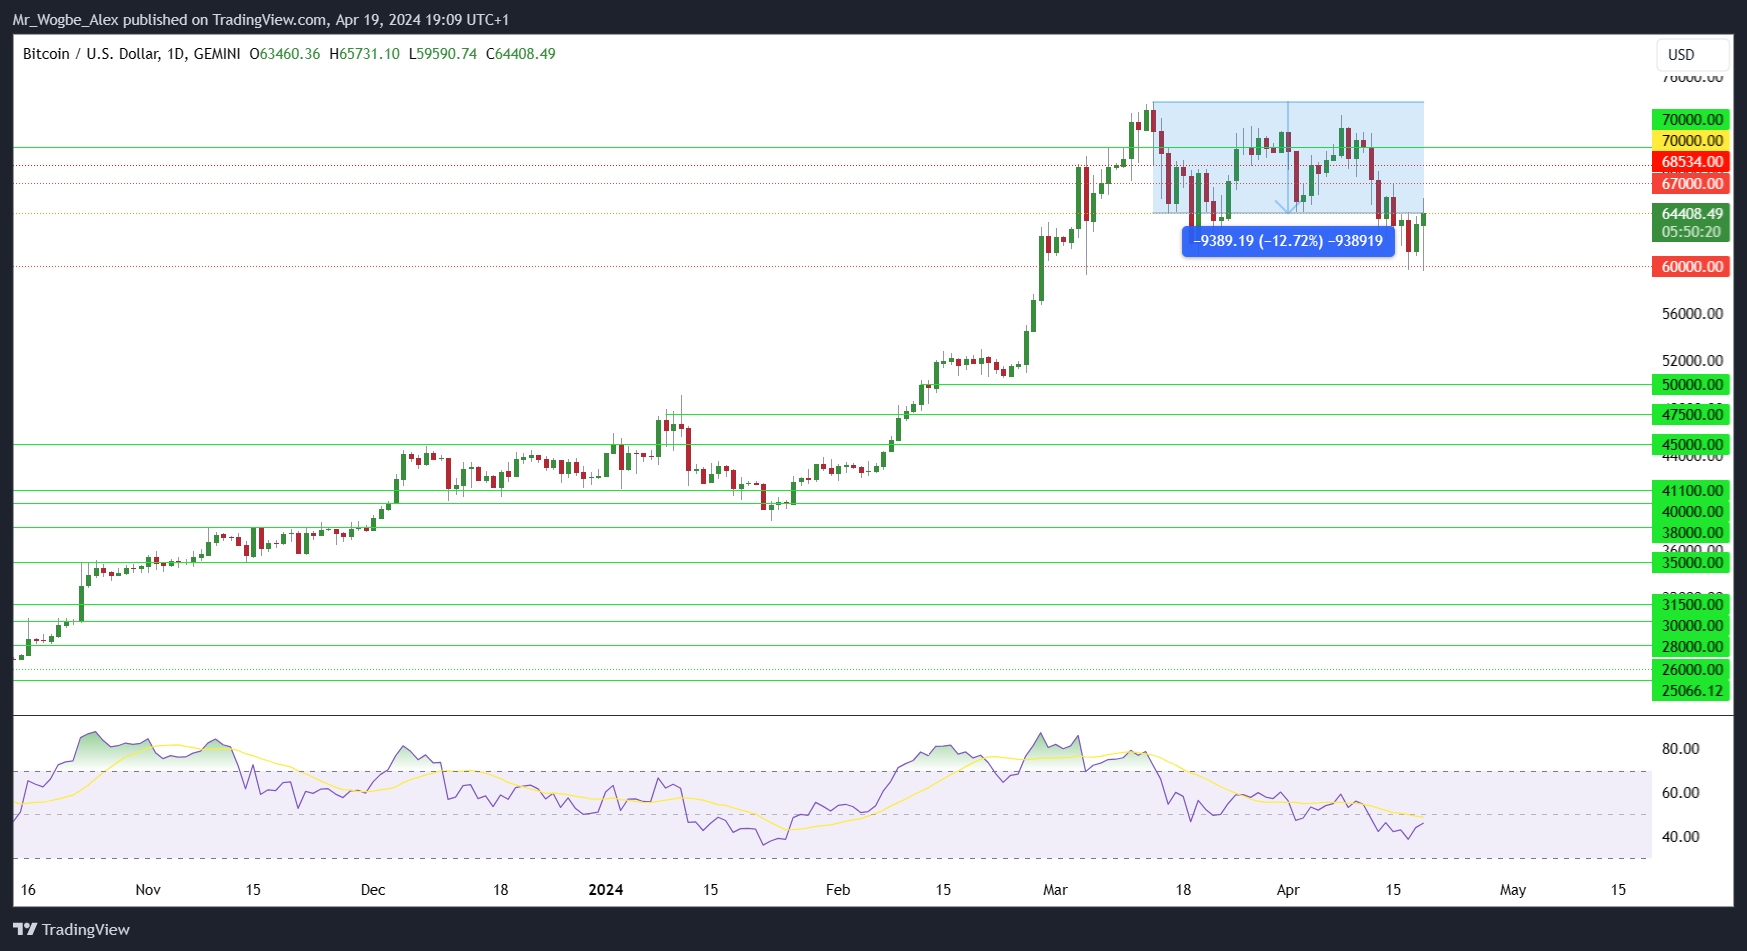
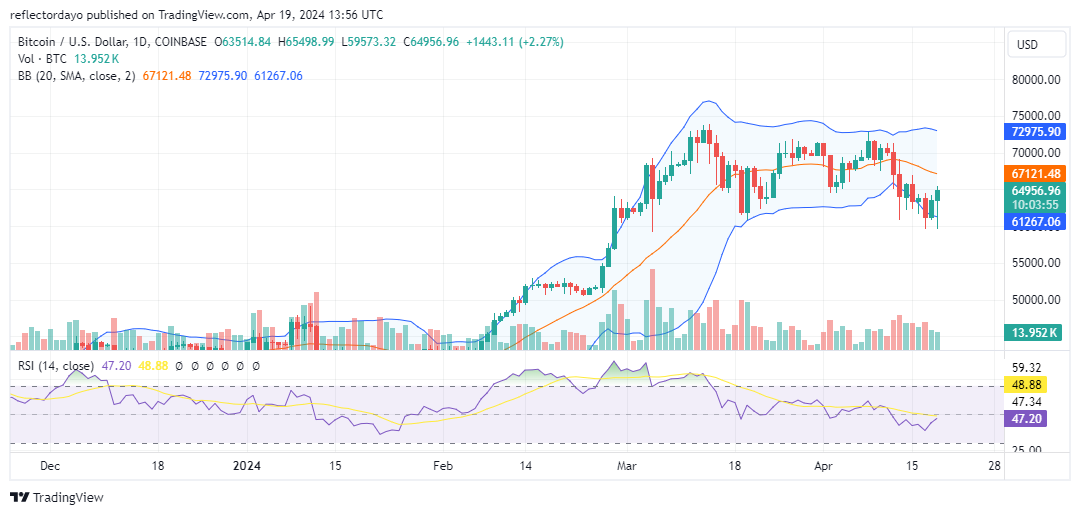
Bitcoin is currently trading at $64,400, reflecting a 12.7% decrease from its all-time high of over $73,797 last month.
Graficu di u ghjornu BTCUSD
Several factors contribute to this downturn, including impending U.S. tax payments, reduced expectations of Federal Reserve rate cuts, and geopolitical tensions, particularly between Iran and Israel.
The impending halving event, scheduled for late Friday, will reduce the per-block coin emission from 6.25 BTC to 3.125 BTC, halving the rate at which new Bitcoins sò creati. While past halvings have resulted in significant price rallies, the extent and duration of these increases have varied.
Despite the prevailing belief in the crypto community that the halving will drive Bitcoin’s long-term upward trajectory, financial giants like Goldman Sachs e JPMorgan offer differing views. JPMorgan, in particular, has hinted at the possibility of a more pronounced price correction post-halving.
As the market observes the halving with un mischju di excitement and caution, the movements in Bitcoin ETFs provide insights into investor sentiment leading up to this critical event. The coming days will reveal whether historical patterns persist or if the market is charting a new path.
Quandu u cummerciu di u mercatu di criptu, ùn deve micca esse "hit or miss". Salvate a vostra cartera cù cummercializazioni chì veramente rendenu risultati, cum'è a nostra prima signali criptò nantu à Telegram.
In the first half of March, the Bitcoin market surged into the price range of $60,000 to $75,000. Subsequently, as time progressed, the notable volatility subsided. Initially, it appeared that bullish momentum was establishing stronger support around the $65,000 level, exerting pressure on bearish positions at $75,000. However, by early April, increasing volatility favored bears, who occupied the $72,000 price level, while bulls faltered in maintaining the $65,000 level.
Consequently, they retreated to the support zone around the $60,000 price threshold. Presently, the market shows signs of rebounding from this level.
Oghje régime market is exhibiting signs of strength, as evident from the analysis of today’s trading activities represented by the candlestick chart. While today’s trading sessions have been marked by considerable volatility, the emergence of a hammer formation suggests that bullish sentiment is gaining momentum, indicating a potential shift in market control.
Currently, bullish forces are exerting pressure on the $65,000 resistance level, despite lingering bearish sentiment at this threshold. Breaking through this resistance level is crucial for the market, as it would negate the development of a bearish trend. This is particularly significant given the bearish performance observed earlier in the week, as indicated by the Bollinger Bands beginning to trend downward. However, surpassing this threshold would effectively nullify the emergence of an impending bearish trend.
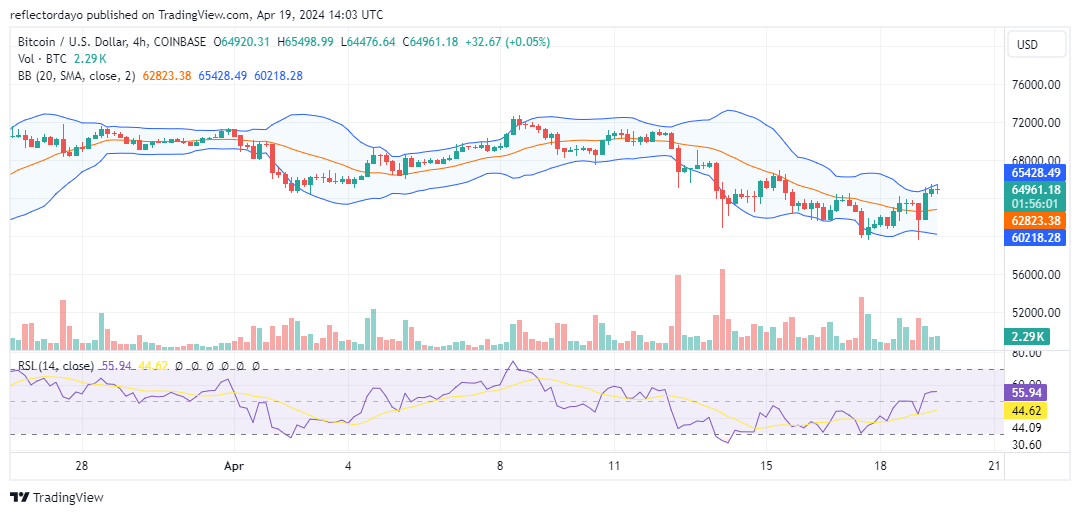
BTC/USD Price Prediction: 4-Hour Chart Analysis
The Bitcoin market has reached a stalemate as both buyers and sellers grapple for control at the $65,000 price level. Despite this signale criptu, volatility remains notably high, with the price fluctuating within close proximity to this threshold. A closer examination of the current 4-hour session reveals minimal support and resistance around the $65,000 mark, indicating a state of indecision among traders. This lack of consensus has left the market at a crossroads, with neither side able to push the price significantly below support or above resistance levels. It appears traders are awaiting a catalyst, possibly in the form of news, to prompt decisive action in the market.
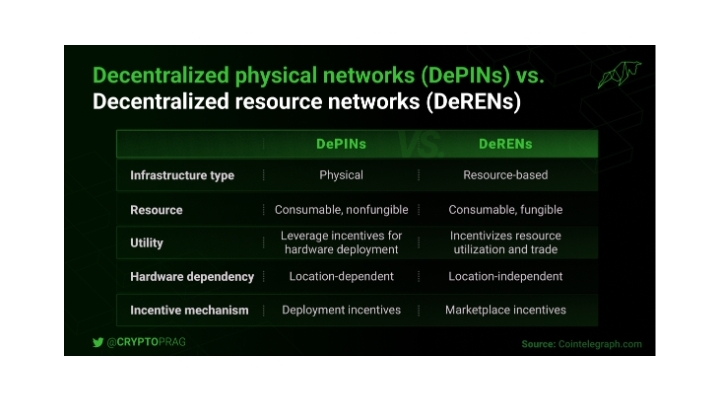
As the crypto realm expands, an often-overlooked domain is DePin, merging technology’s structural support for AI coins. Exploring DePin’s interplay with AI reveals a world of opportunity and innovation.
U Potenziale
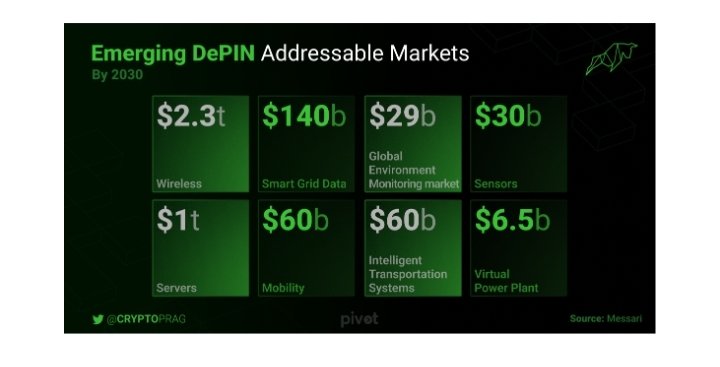
In 2023, Messari introduced Decentralized Physical Infrastructure Networks (DePin), envisioning a landscape where blockchain transforms real-world infrastructure deployment and management. Token incentives drive construction and maintenance, fostering a market predicted to reach $3.5 trillion by 2028.
Recent strides in DePin affirm Messari’s foresight, with projects advancing toward this lofty valuation.
Impostà a Scena
DePin revolutionizes infrastructure conception, construction, and interaction, hailed as the “next blockchain frontier.” It stands as a beacon of innovation in today’s crypto landscape.
But what sets it apart? Why does DePin captivate the brightest minds in crypto?
The answer lies in its dual nature: Prima, DePin harmonizes the realms of crypto and AI, offering a tangible application of both fields.
It embodies a real-world crypto use case, reshaping infrastructure development and fostering efficiency, accessibility, and innovation.
At its core, DePin employs blockchain to crowdsource infrastructure projects, tapping into collective intelligence, skills, and resources. Tokenization incentivizes and rewards contributions, fostering community engagement and investment.
Present Status of DePin
DePin’s current landscape spans over 650 projects across six core sectors: critical infrastructure computing, AI, wireless, sensors, energy, and services. Together, these initiatives boast a market capitalization surpassing $22 billion, generating around $15 million in on-chain annual recurring revenue (ARR).
Notably, the DePin network has witnessed a surge of over 600,000 nodes, indicative of significant growth trajectories.
Anticipated drivers of growth include market expansion to $3.5 trillion by 2028, escalating demand for high-quality streaming and online content, increased necessity for valuable datasets spanning various industries, and a growing need for online data storage solutions and software-based DePin networks.
Moreover, the supply side is primed for expansion, with a rise in nodes and the emergence of decentralized marketplaces connecting GPU owners with rendering power-seeking creators.
Notably, DePin networks derive revenue from tangible utility rather than speculative investments, ensuring transparent and real-time payment mechanisms traceable on the blockchain. Founders in this domain prioritize the development of open-source hardware and software solutions to accelerate the growth of valuable on-chain products and services, while diverse use cases continue to emerge within the Web3 ecosystem.
Exciting Projects on DePin
Now that you’re acquainted with DePin’s essence and operational framework, let’s delve into some of the most captivating ventures within the DePin sphere.
Aethir
Aethir crafts a distributed GPU-driven computational framework tailored for versatile enterprise applications.
It establishes a bridge between businesses harboring dormant GPU capabilities and sectors craving computational prowess, spanning realms like AI, virtual computing, cloud gaming, and cryptocurrency mining.
1. This approach optimizes resource allocation while providing a budget-friendly resolution for high-demand sectors, obviating the necessity for hardware investments.
2. At the core of Aethir’s ecosystem lies the $ATH token, serving as the conduit for transactions within this dynamic marketplace.
3. On the demand side, entities procure $ATH tokens to lease computational muscle, while suppliers and investors reap $ATH tokens as incentives.
4. Aethir’s dedication to reinvesting profits into acquiring $ATH fortifies its worth, positioning it as a sturdy investment choice.
Io.net
io.net offers entry to distributed GPU clusters tailored for machine learning, tackling challenges such as constrained accessibility, steep expenses, and subpar hardware selections found in centralized platforms.
1. Similar to Aethir, io.net consolidates dormant GPUs into a DePIN, furnishing substantial computational prowess for industries reliant on intensive computing tasks.
2. io.net elevates its portfolio with three distinct offerings: io.net Cloud for expandable GPU clusters, io.net Worker for computational oversight, and io.net Explorer for network analytics, furnishing a comprehensive solution tailored for both users and providers of GPU resources.
GamerHash
Introduced in 2017, GamerHash has surged by an impressive 2600% year to date, boasting a user base of 760K. Originally geared towards enabling gamers to accrue earnings via cryptocurrency mining, the platform has evolved significantly since its inception.
1. Expanding its horizons, it is now venturing into technical integrations and unveiling a fresh AI application. Its goal: is to furnish GPU capabilities for AI, 3D rendering, LLM models, and data analysis, all under the innovative DePin initiative.
2. Teaming up with AI L1 endeavors and top players in the DePin market, GamerHash is poised to emerge as a formidable B2C power supplier amid the prevailing GPU scarcity.
3. Significant achievements encompass surpassing 2 million transactions to gamers’ wallets, doling out rewards exceeding $15 million, and boasting active users whose hardware value eclipses $20 million.
4. The AI product evolution unfolds systematically, spanning from an initial proof-of-concept for GPU power contribution to the incorporation of gaming GPUs into computing marketplaces for generative AI model tasks. This strategic approach not only tackles the GPU shortage but also holds promise for resolving a significant industry challenge.
5. GamerHash’s proprietary token, GamerCoin ($GHX), boasts a total supply of 808 million tokens, with 80% already in circulation. Currently operational on both BSC and ETH networks, the platform has ambitious plans to extend its presence to Solana in the near future.
cunchiusioni
In the convergence of DePin, where crypto and AI unite, lies a blueprint for a future where technology transcends boundaries, reshaping the physical world around us. As DePin continues to evolve, it serves as a testament to the boundless potential of blockchain technology and the collaborative spirit driving innovation forward.
Embracing this paradigm shift, we embark on a journey toward a more interconnected, efficient, and equitable world, propelled by the synergies of crypto, AI, and decentralized infrastructure.
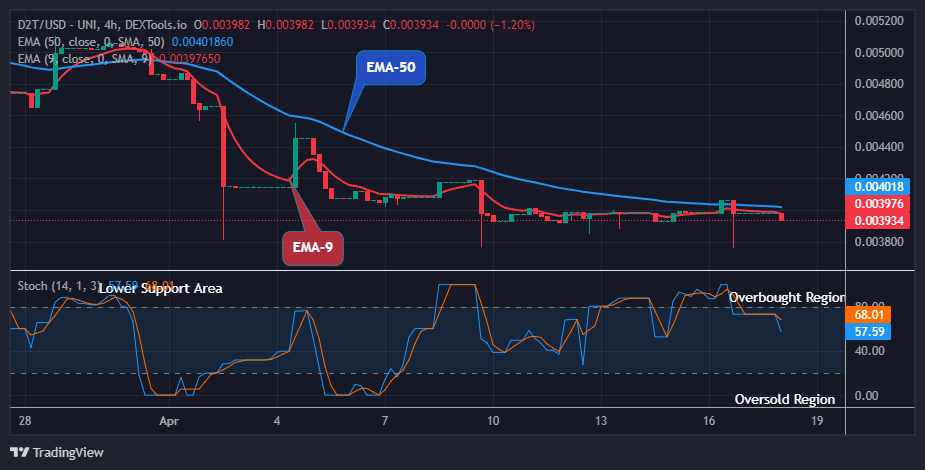
Dash 2 Trade Price Forecast: D2TUSD Will Jump Soon, Watch out for BUY! (April 19) D2TUSD will jump soon as the selling pressure is moving towards the exhaustion stage. The coin could be ready for an upward surge soon if adequate preparation is done by the bulls by exchanging hands with the sell traders at the current support level. Therefore, if the buy investors could prove harder and put a hold on the $0.00393 current support level, the bulls may drive the price action to hit the previous high of $0.00510 resistance value, which might extend further to a $0.01000 upper resistance level, registering a high potential for the coin buyers.
Livelli Chjave: Livelli di resistenza: 0.00500 $, 0.00600 $, 0.00700 $ Livelli di supportu: 0.00300 $, 0.00200 $, 0.00100 $
D2T (USD) Tendenza à longu andà: Bearish (4H) lu Dash 2 Trade price is trading below the supply levels in its higher time frame. The sustained bearish pressure in the past few hours has made the cryptocurrency price remain below the supply trend levels at its recent low. This will soon be invalidated as the trend is now approaching the oversold region of the crypto market. Intantu, u prezzu attuale di D2TUSD at a $0.00393 low value below the supply trend lines has not stale the market condition of the coin. Further, investors may seize the opportunity now buy the coin at a lower price and look for more gains ahead.
Meanwhile, the price of Dash 2 Trade could reverse soon as the coin price is now moving towards the oversold region. This will enable the coin buyers to resume afterward and push the price upwards, so we can now grow in confidence that a potential buy is coming near.
If this is attained by the bulls, the price jump could hit the $0.01000 resistance level in the coming days, indicating a strong supply zone for a potential BUY in its higher time frame.
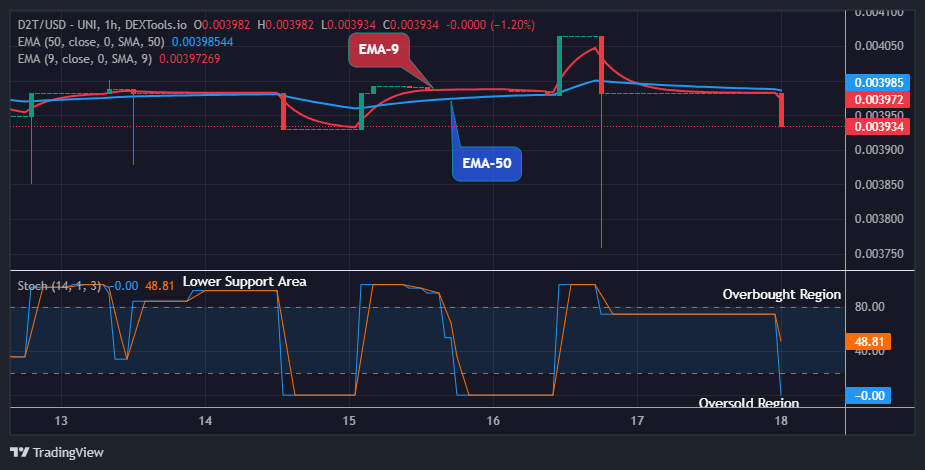
D2T (USD) Tendenza à Medium-Termine: Baissista (1H) A munita hè ancu cummerciale in un mercatu di tendenza bearish in a prospettiva à mediu termine. Questu hè duvuta à l'altu impattu di i cummircianti à cortu termine nantu à u flussu di prezzu. The persistent move by the sell traders in the previous action has dropped the coin price below the supply levels in recent times.
After a series of sideway moves, the bears drop the D2TUSD price down to a low of $0.00393 trend line below the moving averages shortly after the 1-hour chart opens today.
Further, an increase in the buying pressure might reverse the trend and push the price of Dash 2 Trade up to retest the previous high of $0.00406 mark, obtaining a higher footing to rise higher.
Intantu, più svantaghji sò improbabile cum'è u prezzu di u mercatu di D2TUSD has reached the oversold region. The coin will resume an uptrend soon and this may lead the price action to reach the $0.01000 upper high level in the upcoming days.
Possibly the most useful technique for enhancing your trading success is backtesting.
⚒️ Backtesting is perhaps the most valuable tool to improve your trading performance.
In many ways it’s a gamechanger, allowing you to see how your strategies will fair in real-world market conditions.
In un rapportu recente, l'analisti di JPMorgan mettenu in luce l'impattu anticipatu di u prossimu avvenimentu di Halving Bitcoin. Cum'è a cumunità di criptu aspetta cun ansietà questa tappa significativa, a quistione nantu à a mente di tutti hè: Cumu affetterà a criptografia più famosa di u mondu?
A metà di Bitcoin, chì si trova circa ogni quattru anni, hè un avvenimentu cruciale in l'ecosistema di criptocurrency. Duranti questu avvenimentu, i premii di emissione per i minatori di Bitcoin sò tagliati à a mità.
I minatori ricevenu attualmente 6.25 BTC per bloccu; dopu à a mità, sta ricumpensa diminuisce à 3.125 BTC per bloccu.
Comu hà dettu chì par Bloomberg, L'analisti di JPMorgan affirmanu chì u prezzu di u bitcoin attuale hà digià u prossimu halving priced in. In u so rapportu, dicenu, "Ùn aspittemu micca chì u prezzu di u bitcoin aumente dopu à a metà, postu chì hè digià statu prezzu." Questa perspettiva sfida l'idea chì i halvings inevitabbilmente portanu à l'aumentu di i prezzi.
🚨JUST IN: JPMORGAN ASPETTA #Bitcoin PREZZU PER CUTINÀ A IMMERSIONE DOPU A HALVING!
I motivi di JPMorgan per l'aspettativa prudente intornu à u Bitcoin Halving
Sicondu l'analisti di JPMorgan, i fatturi chì cuntribuiscenu à a pruspettiva prudente nantu à l'avvene Bitcoin a mità incrudunu:
Preoccupazioni di Condizione di Overbought: Malgradu i cali recenti, JPM teme chì régime resta in "condizioni di overbought". Questa valutazione hè basatu annantu à una analisi di l'interessu apertu in i futuri bitcoin.
Prezzu di volatilità-Ajustatu: U prezzu aghjustatu per a volatilità di JPMorgan per u bitcoin hè di $ 45,000 63,500. Paragunendu questu à u prezzu di u mercatu attuale di $ XNUMX XNUMX revela chì u bitcoin hè cummerciale à una prima, secondu l'analista.
Costu di Produzione: L'analista mette in risaltu chì u prezzu di Bitcoin supera u so costu di pruduzzione prughjettatu post-halving. Cù un costu prughjettatu di $ 42,000, u prezzu attuale di circa $ 63,500 suscite preoccupazioni.
Finanziamentu di Capital Venture: Malgradu u risurgimentu più largu in u mercatu di criptu, u finanziamentu di capitale di venture per i criptu di munita hè statu tepid questu annu. Questa mancanza d'investimentu sustanziale puderia sminuisce a crescita di i prezzi, per u rapportu.
Bitcoin Hashrate è Miner Consolidation
Inoltre, u halving hè previstu di impactà significativamente i minatori di Bitcoin. Siccomu i premii di emissione diminuiscenu, certi minatori ponu truvà e so operazioni micca prufittuali. In cunseguenza, pudemu aspittà una calata significativa di l'hashrate - a putenza di calculu dedicata à assicurà a rete.
Tuttavia, JPMorgan crede chì e cumpagnie minera publicamente listate sò prubabilmente resistenti à a tempesta megliu cà i ghjucatori più chjuchi. In listessu modu, a cunsulidazione trà i minatori hè prevista, cù l'imprese più grande chì duminanu u paisaghju.
In risposta à a prufittuità ridutta, l'imprese minieri ponu scopre a diversificazione. E regioni cù costi energetichi più bassi, cum'è l'America Latina o l'Africa, puderanu diventà destinazioni attraenti. Repurposing rigs minieri inefficienti per u valore di salvezza puderia ancu esse in l'agenda per i minatori in difficultà.
Mentre chì certi speculanu chì i minatori puderanu passà à a minera di criptovalute di Bitcoin hard fork, l'analisti di JPMorgan dichjaranu questu cum'è "assai improbabile". Questi rigs specializati sò ottimisati per a minera di Bitcoin, è l'avventura in altcoins più chjuchi prubabilmente rende pocu prufittu.
In riassuntu, u halving di Bitcoin hè stallatu per portà e sfide è opportunità. Cume a cumunità di criptu vigilà attentamente, a risposta di u mercatu in fine determinarà u destinu di l'oru digitale.
Quandu u cummerciu di u mercatu di criptu, ùn deve micca esse "hit or miss". Salvate a vostra cartera cù cummercializazioni chì veramente rendenu risultati, cum'è a nostra prima signali criptò nantu à Telegram.
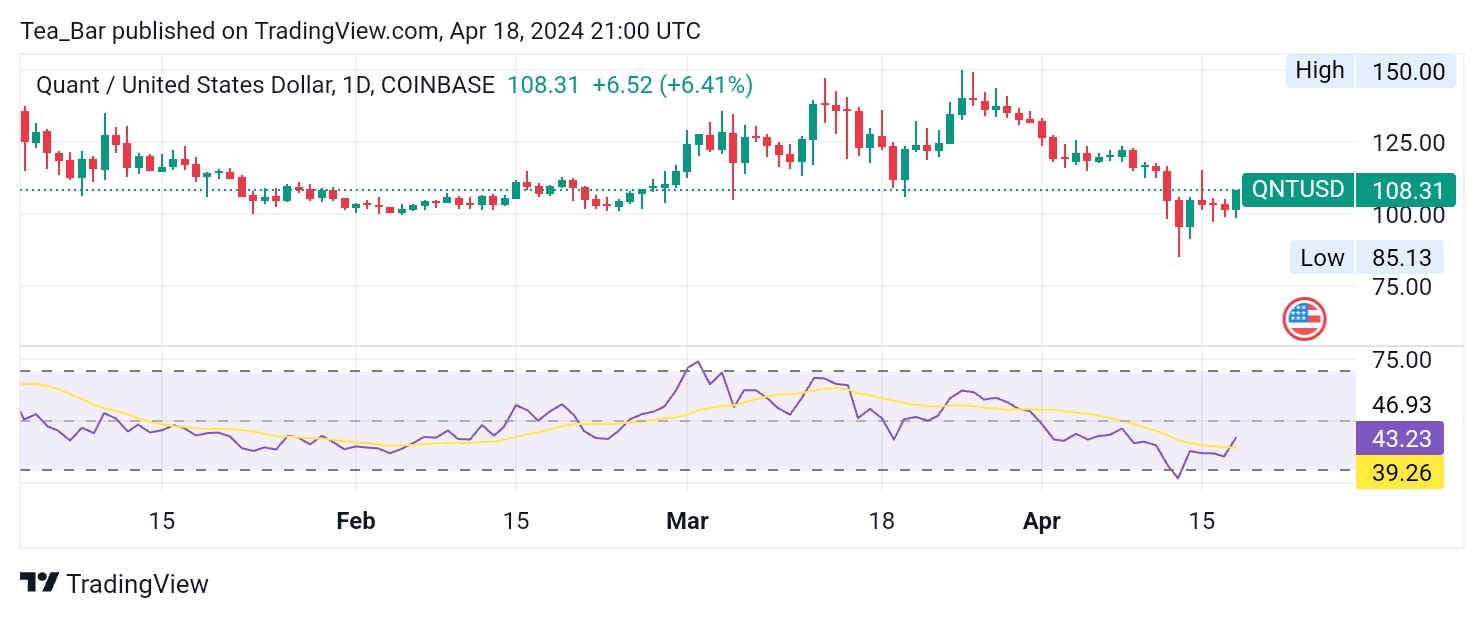
Quant (QNT) hà rimbursatu in modu impressiunanti da u so recente minimu di $ 85 solu cinque ghjorni fà, attualmente cummercializatu à $ 108. U token hà una capitalizazione di u mercatu di $ 1,289,345,778 USD è un volume di cummerciu di 24 ore di $ 18,415,618 USD.
Quant hè in crescita di 4.58% in l'ultime 24 ore è detene un ranking CoinMarketCap di #68. A forte dumanda è u sentimentu pusitivu circundanu u prugettu, alimentatu da u so focus in l'interoperabilità è strategica di blockchain partenariati.
Sia QNT pò sustene a so corsa di toro dipende da i tendenzi di u mercatu più largu è i sviluppi futuri, cumprese a chiarezza regulatoria è l'avanzamenti in a Quant Network.
QNT/USD Tendenza à longu andà: Bullish (Grafico di ogni ghjornu) Livelli chjave: Livelli di resistenza: 110 112 $, 114 XNUMX $, XNUMX XNUMX $ Livelli di supporto: 105 103 $, 100 XNUMX $, XNUMX XNUMX $ Quant (QNT) hà mostratu un forte rebote in u mercatu di ogni ghjornu, chì cresce da un minimu di $ 85 à $ 108. Stu muvimentu di u prezzu hè sustinutu da a lettura quotidiana di l'Indice di Forza Relativa (RSI) di 43.23.
Un RSI di 43.23 suggerisce chì u mercatu hè in una zona neutrale, chì indica u potenziale per più muvimentu in una regione bullish. Mentre chì u RSI hè vicinu à u limitu di oversold, furnisce u spaziu per u futuru crescita di u prezzu senza ghjunghje à a gamma di overbought.
Questu indicatore tecnicu mette in risaltu un ambiente di u mercatu equilibratu, induve QNT pò cuntinuà a so tendenza ascendante. In generale, l'attività di u mercatu di Quant riflette un sentimentu pusitivu sustinutu è u putenziale di crescita cuntinua.
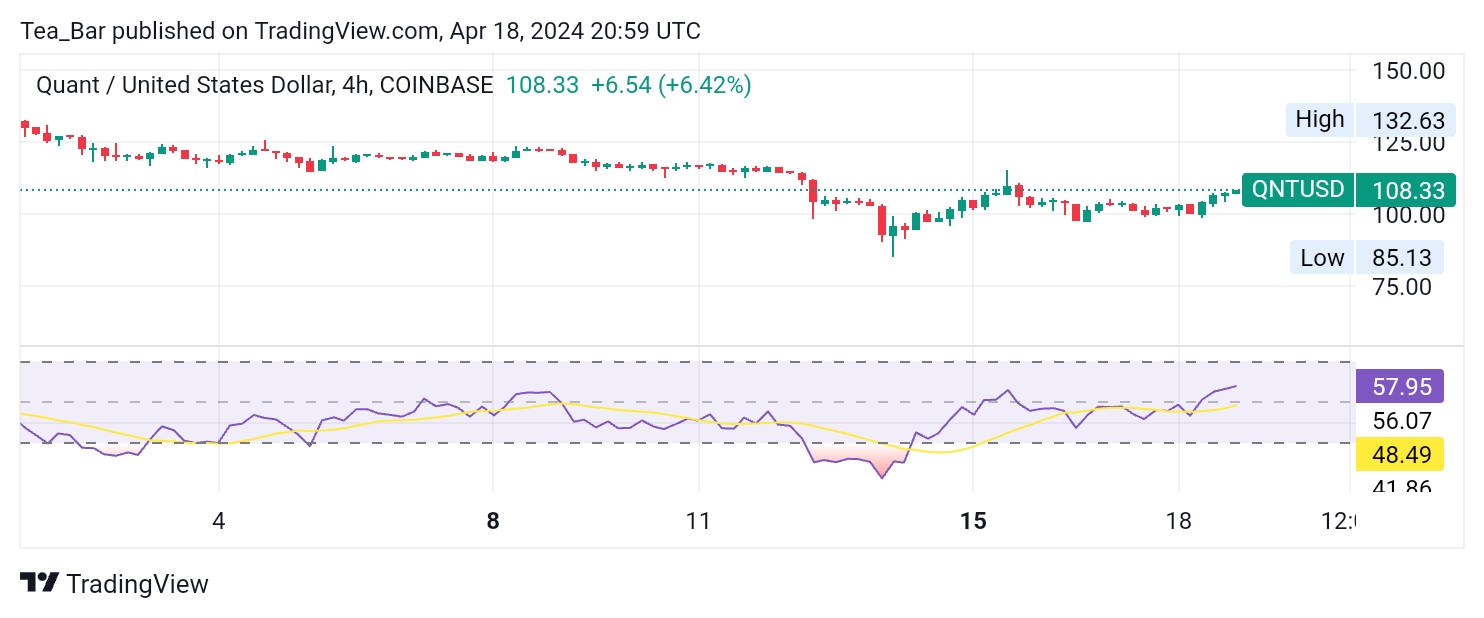
QNTUSD Tendenza à mediu termini: Bullish (graficu 4H) Quant (QNT) hà dimustratu un momentu in crescita notevuli in u mercatu di 4 ore. U 4-hour Relative Strength Index (RSI) si trova à 57.95, indicà à un mercatu cun moderatu bullishness.This valore RSI signala u putenziale di guadagnà supplementu di prezzu mentre si ferma in modu sicuru sottu à u limitu di overbought. A prospettiva intermediu di u mercatu hè ottimista, cù a crescita constante di Quant chì suggerisce una forte dumanda è aspettative pusitive per a crescita futura. U graficu di l'ora di 4 furnisce una snapshot di u sentimentu bullish sustinutu, aprendu a strada per più movimenti ascendenti à pocu pressu.
Quant (QNT) Posizionatu per a Traiettoria Bullish Continuata A ricuperazione rapida di u token da un minimu di $ 85 à $ 108, accumpagnatu da una capitalizazione di u mercatu chì supera i $ 1.28 miliardi è un forte volume di cummerciale di 24 ore, mette in risaltu un forte interessu è ottimisimu intornu à u prugettu. postura neutrale in u mercatu, chì indica u potenziale per l'apprezzazione di u prezzu cuntinuu.
Intantu, u RSI 4-hour di 57.95 palesa un momentu alcista moderatu, indicà à più guadagnà. L'enfasi di Quant blockchain l'interoperabilità è l'allianze strategiche prumove una onda d'entusiasmu intornu à e so prospettive future.
Questu, cumminatu cù un mercatu equilibratu è una dumanda coherente, indica chì QNT hè in traccia di un muvimentu ascendente sustinutu in i ghjorni à vene.
Piazza vincitore Quant trades cun noi. Pigliate QNT ccà.
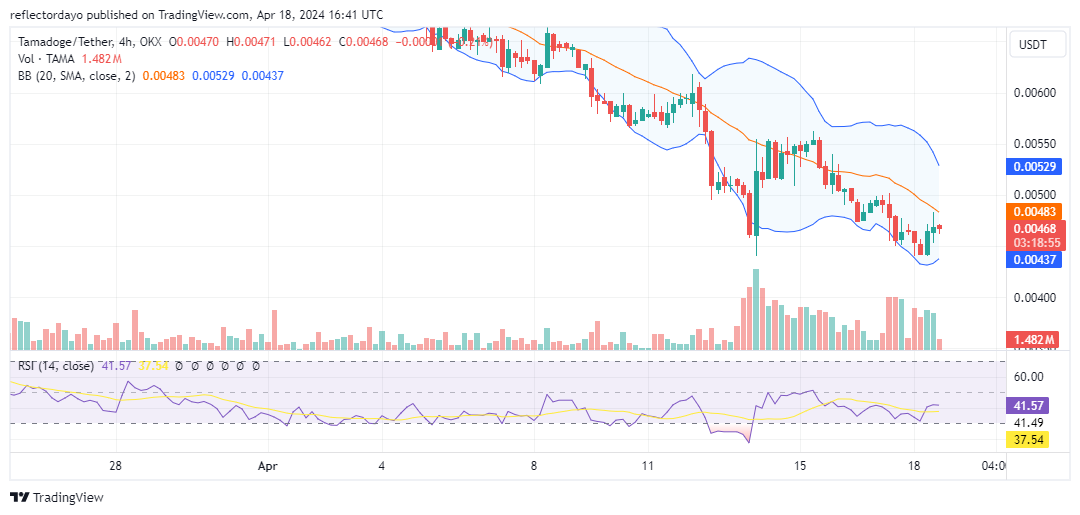
U mercatu di Tamadoge hà mostratu una volatilità elevata dopu à una calata sottu à u limitu di u prezzu di $ 0.00005, dopu à una longa lotta per a dominanza di u mercatu trà e forze bullish è bearish. Questa escalazione in a volatilità pò esse attribuita à u significatu di u livellu di $ 0.00005 cum'è una zona di supportu chjave; a so violazione hà suscitatu un sentimentu ribassista pronunciatu trà i cummircianti. In u risultatu, i toru sò stati custretti à riunificà intornu à a marca di $ 0.000045. Approfittendu di a volatilità aumentata, anu da allora sappiutu di riunisce un momentum significativu, dirigendu u mercatu versu un resurgimentu di u sentimentu bullish.
Livelli Chjave
Resistenza: $ 0.013, $ 0.014 è $ 0.015.
Supportu: $ 0.0045, $ 0.0040 è $ 0.0035.
Analisi di u prezzu TAMA / USD: Puntu di vista di l'indicatori
I tori anu cuminciatu à cunverge à u livellu di u prezzu di $ 0.000045, marcà una junction pivotal da quale sò iniziati una inversione di a trajectoria di u mercatu versu l'upside. Tuttavia, stu impetu bullish face una resistenza considerable. In a precedente sessione di cummerciale di 4 ore, u criptu signuL presentava un candelabro cù un corpu chjucu è ombre lunghe superiori è inferiori, chì indicanu un equilibriu trà a dumanda è l'offerta. Attualmente, a ricuperazione bullish pare capped around $ 0.000047, mentre chì i Bollinger Bands cuntinueghjanu à delineà un canali di prezzu di tendenza à a tendenza. U primu passu versu a riorientazione di u tamadoge u mercatu in una direzzione ascendente pò implicà una fase di consolidazione. In seguitu, cum'è u sentimentu bearish dissipate à questu livellu, un ascensu di prezzu hè anticipatu.
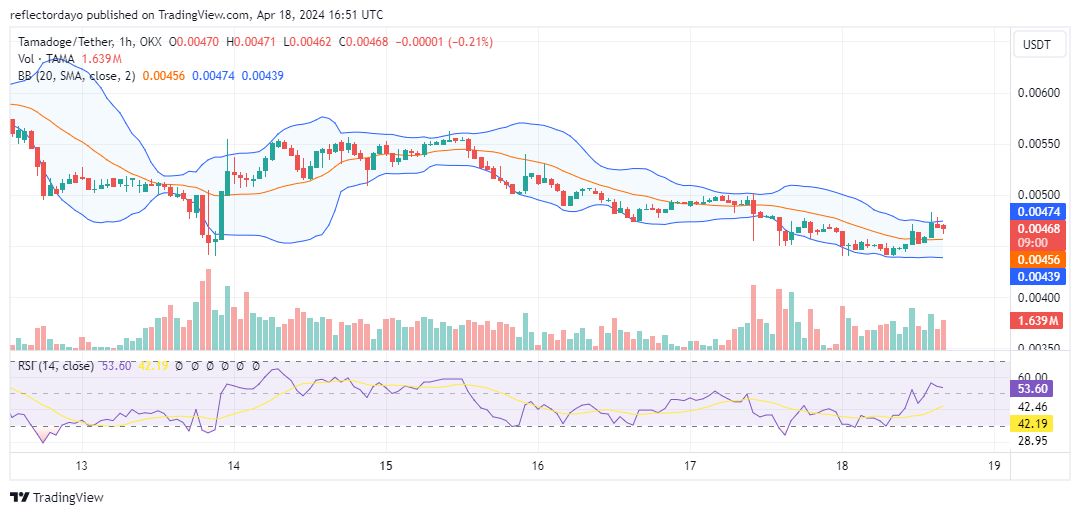
Tamadoge Outlook à Cortu Terminu: Graficu 1-Hour
U tempu di u mercatu di 1 ora indica ancu una tendenza chì varieghja. Quandu hà righjuntu u prezzu di $ 0.000045 durante a fase bearish, u mercatu hà mostratu un periodu di stagnazione, attribuita à una attività bullish significativa à questu livellu. Pocu dopu, una inversione bullish hè stata osservata, guidà u mercatu à l'alza. Tuttavia, a resistenza bearish hè apparsu à $ 0.000047. Attualmente, a pressione bullish hè evidenti à questu livellu di resistenza, cù l'azzione di prezzu chì mantene una pusizioni sopra à a media mobile di 20 ghjorni.
Ottene a vostra parte ghjusta di $ TAMA in questu ghjocu di corridore per guadagnà cù grafica vivace, caratteri umoristici è un ghjocu rapidu.
Tamadoge Pursuit hè ora fora 🐶🏃
Cù una grafica vibrante, caratteri stravaganti è un ghjocu veloce, guadagnate a vostra parte di $ TAMA nantu à questu ghjocu per guadagnà u ghjocu di corridore.
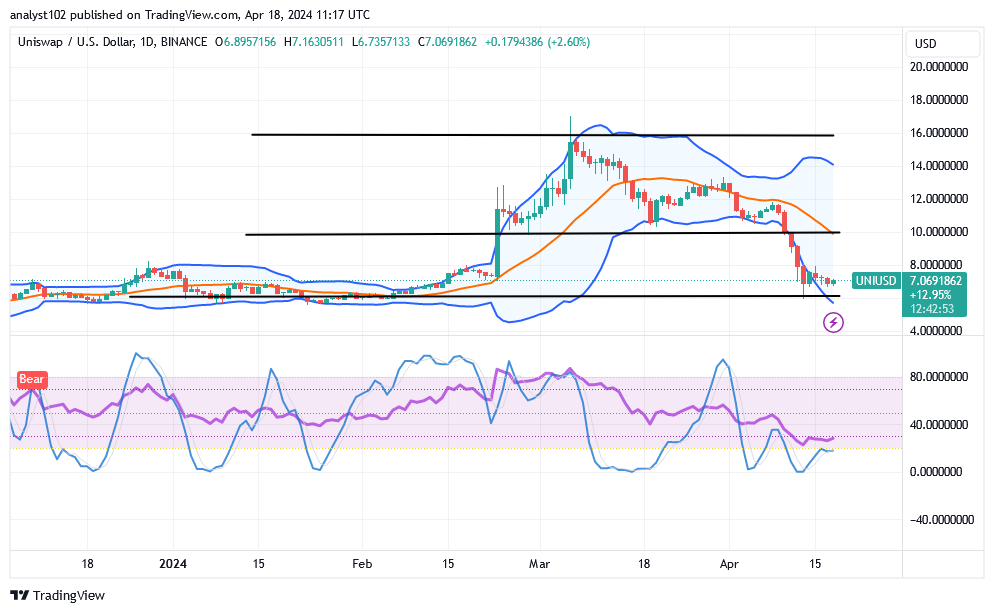
Un bellu momentu hè statu permessu di andà in modu di decadenza mentre i toru è l'orsi anu luttatu contr'à l'altri intornu à i punti imaginari di tendenza di l'indicatori, datu chì l'UNI / USD mercatu hè attualmente custruendu passi, stendu intornu à a linea di valore di $ 7.
Più di un paru di ghjorni fà, e forze à a direzzione sudu intornu à a linea di tendenza di a Bollinger Band più bassa sò state fatte per esse perdendu capacità gradualmente in una linea di pruvà à pruduce una probabile longa gamma di azioni di prezzu bassu chì sò principarmenti previste di dà in daretu. per liscia i chjassi versu assicurà aumenti stabili di questu.
Mercatu UNI / USD Livelli Chjave: Livelli di resistenza: 9 $, 11 $, 13 $ Livelli di supportu: 6 $, 5 $, 4 $
UNI / USD - Grafico Quotidianu U graficu di ogni ghjornu UNI / USD revela chì u mercatu criptu-ecunomicu custruisce passi attornu à a linea di $ 7, cum'è u prezzu si stende intornu à a linea.
L'oscillatori stochastichi sò stati osservati, annantu à qualchì sessione per esse swinging around some points not too far above the oversold region. È si immergenu soprattuttu in l'area parechje volte per significà chì e forze à a direzzione di riduzzione sò più debule.
Ci ponu esse strade supplementari per u svantaghju datu chì u mercatu BTC / USD hè attualmente cummerciale vicinu à $ 7?
Saria fora di u principiu tecnicu mètudu di cummerciu per i vinditori per andà più in là à u latu, datu chì u Marca UNI/USDt hè attualmente in custruzzione di passi, in giru attornu à u puntu di $ 7.
Certi indicatori sò notevolmente in svantaghju per toccu i punti di diminuzione massima chì sò psicologicamente ideali per i cumpratori per esse riformulati per ottene entrate decenti per fà rimonta. Fighjendu l'effettu di e currezzione, u mercatu hè statu fattu per mette in daretu per un'altra volta di muvimenti in direzzione crescente.
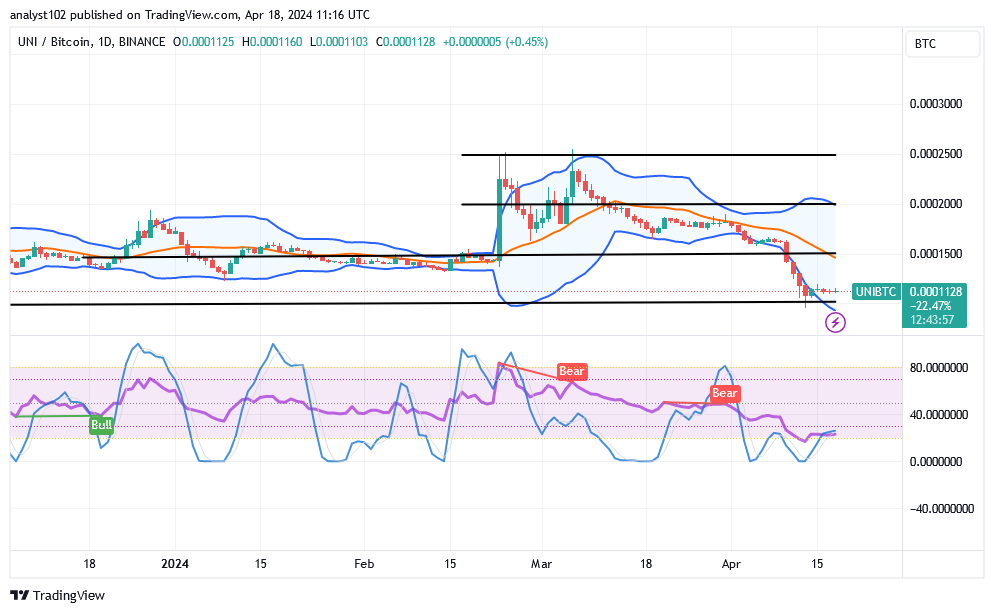
Avà, l'orsi anu bisognu di prudenza mentre si posizionanu in relazione à a linea di tendenza più bassa di Bollinger Band. Unu di i motivi chì sustenenu i pinsamenti lògichi hè chì una cundizione di lettura oversold hà rapprisintatu da l'oscillatori stochastichi per implicà chì seria più risicatu per i venditori di correre in modu sicuru in una manera di prufittu, ancu s'ellu ci sarà una linea di ritardi in l'azzioni di u prezzu. Analisi di Prezzi UNI / BTC In cuntrastu, u Cummerciu Uniswap hè attualmente custruendu passi contr'à a valutazione di Botcoin, stendu intornu à a banda di Bollinger più bassa.
L'oscillatori stochastichi sò stati veduti swinging around the oversold region with less out of the spots to the upside. . U cumpunente muvimentu più bassu di e linee di tendenza di a Bollinger Band hè stata in una cundizione pèrdita, chì indica chì ci hè pressione nantu à l'economia di criptu di basa per diminuisce. Tuttavia, ùn pare micca chì e tendenze sò diventate più severi per pudè calà liberamente. \ nota:Cryptosignals.org ùn hè micca un cunsiglieru finanziariu. Fate a vostra ricerca prima d'investisce i vostri fondi in qualsiasi attivu finanziariu o pruduttu presentatu o avvenimentu. Ùn simu micca rispunsevuli di i vostri risultati d'investimentu.