Quant Price Prediction: QNT/USD Fluctuates Below $150 Level
Don’t invest unless you’re prepared to lose all the money you invest. This is a high-risk investment and you are unlikely to be protected if something goes wrong. Take 2 minutes to learn more
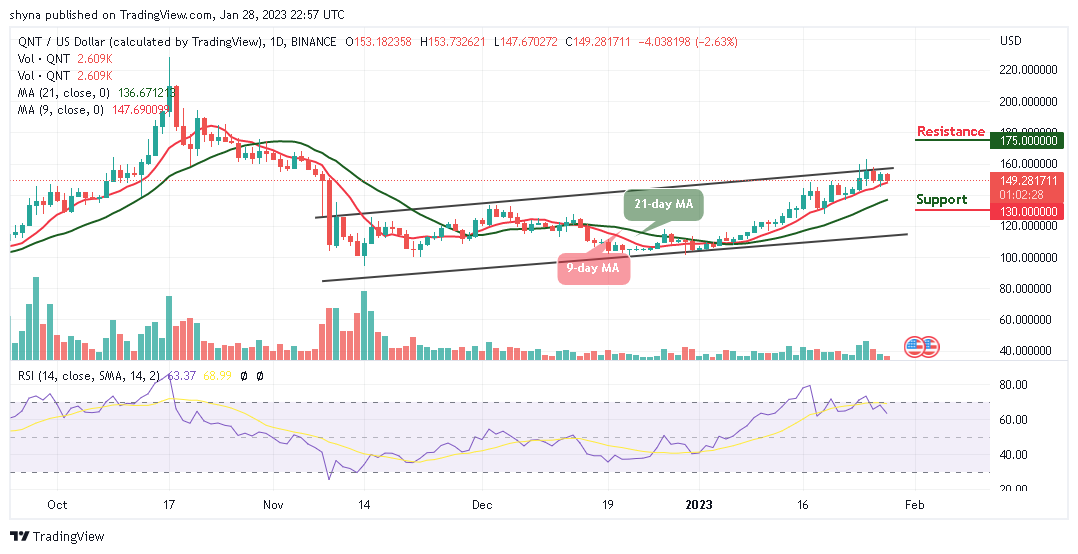
Quant Price Prediction – January 28
The Quant price prediction shows that QNT may create a low at $145 if the price dips for new buyers to come to play.
QNT/USD Medium-term Trend: Ranging (1D Chart)
Key Levels:
Resistance levels: $175, $185, $195
Support levels: $130, $120, $110
QNT/USD is currently trading at $149.28 above the 9-day and 21-day moving averages. The sellers could bring the coin towards the south, allowing the new buyers to step into the market while the existing buyers are expected to buy the dips.
Quant Price Prediction: QNT Price Could Retreat to Move Higher
The Quant price is moving sideways and it could be low for more buyers to enter the market. However, QNT/USD could drop more as the technical indicator Relative Strength Index (14) moves to cross below the 60-level. Meanwhile, the coin will experience new buyers coming into the market, but any further support could be located at $130, $120, and $110 respectively.
However, should the buyers hold the current level at $149.28 and push the coin higher; the bulls can expect immediate resistance to be located at $160. Any further bullish movement above the upper boundary of the channel could hit the resistance level of $175, $185, and $195.
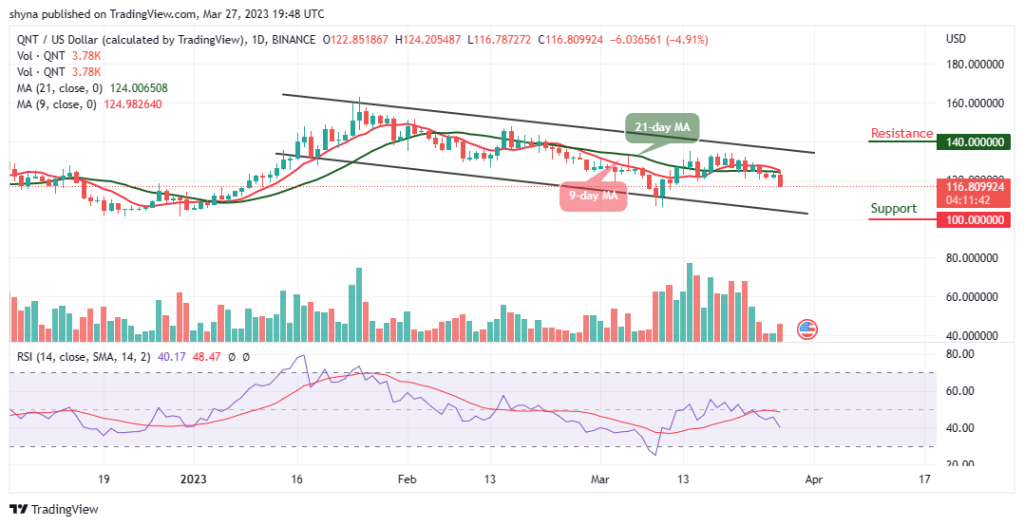
QNT/USD Medium-term Trend: Ranging (4-Hour Chart)
On the 4-hour chart, the Quant price remains below the 9-day and 21-day moving averages; this will allow new buyers to come into the market. Nevertheless, the existing buyers are also expected to buy the dip as bulls gather momentum to begin a new bullish movement.
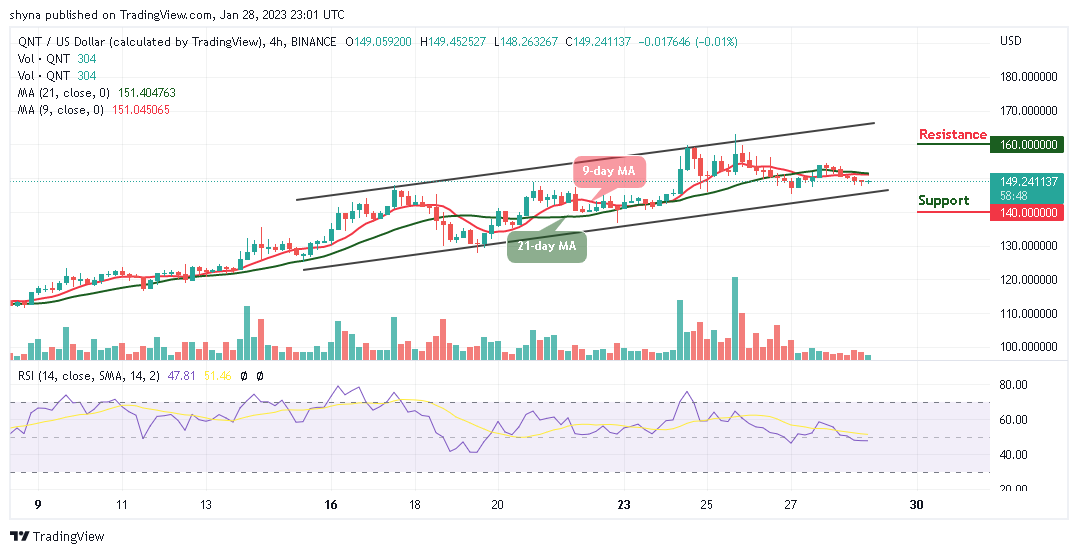
From above, if the buyers push the price above the 9-day and 21-day moving averages, the potential resistance level could be found at $160 and above. Moreover, should the coin slide below the lower boundary of the channel, the support level of $140 and below may come to play while the Relative Strength Index (14) moves below the 50-level.
Place winning Quant trades with us. Get QNT here