Bitcoin Halving: JPMorgan Analysts Expect BTC to Drop

In a recent report, JPMorgan analysts shed light on the anticipated impact of the upcoming Bitcoin halving event. As the crypto community eagerly awaits this significant milestone, the question on everyone’s mind is: How will it affect the world’s most popular cryptocurrency?

Bitcoin halving, which occurs approximately every four years, is a crucial event in the cryptocurrency ecosystem. During this event, the issuance rewards for Bitcoin miners are cut in half.

Miners currently receive 6.25 BTC per block; after the halving, this reward will decrease to 3.125 BTC per block.

Kiel raportita de Bloomberg, JPMorgan’s analysts assert that the current bitcoin price already has the upcoming halving priced in. In their report, they state, “We do not expect bitcoin price increases post-halving as it has already been priced in.” This perspective challenges the notion that halvings inevitably lead to price surges.

JPMorgan’s Reasons for Cautious Expectations Around the Bitcoin Halving

According to JPMorgan analysts, the factors contributing to the cautious outlook on the upcoming Bitcoin duonigi inkluzivas:

  • Overbought Condition Worries: Despite recent declines, JPM fears that bitcoin remains in “overbought conditions.” This assessment is based on an analysis of open interest in bitcoin futures.
  • Volatility-Adjusted Price: JPMorgan’s volatility-adjusted price for bitcoin stands at $45,000. Comparing this to the current market price of $63,500 reveals that bitcoin is trading at a premium, according to the analysts.
  • Produktokosto: The analysts highlight that Bitcoin’s price exceeds its projected production cost post-halving. With a projected cost of $42,000, the current price of around $63,500 raises concerns.
  • Riska Kapitala Financado: Despite the broader resurgence in the crypto market, venture capital funding for cryptocurrencies has been tepid this year. This lack of substantial investment could dampen price growth, per the report.

Bitcoin Hashrate and Miner Consolidation

Furthermore, the halving is expected to impact Bitcoin miners significantly. As the issuance rewards decrease, some miners may find their operations unprofitable. Consequently, we can expect a significant drop in hashrate—the computing power dedicated to securing the network.

However, JPMorgan believes that publicly listed mining companies are likely to weather the storm better than smaller players. Likewise, consolidation among miners is expected, with larger firms dominating the landscape.

In response to reduced profitability, mining firms may explore diversification. Regions with lower energy costs, such as Latin America or Africa, could become attractive destinations. Repurposing inefficient mining rigs for salvage value might also be on the agenda for struggling miners.

While some speculate that miners could switch to mining Bitcoin hard fork cryptocurrencies, JPMorgan’s analysts dismiss this as “highly unlikely.” These specialized rigs are optimized for Bitcoin mining, and venturing into smaller-cap altcoins would likely yield little profit.

In summary, the Bitcoin halving is set to bring both challenges and opportunities. As the crypto community watches closely, the market’s response will ultimately determine the fate of digital gold.

Kiam vi komercas la kriptan merkaton, ĝi ne devas esti "trafi aŭ maltrafi." Sekurigu vian biletujon per komercoj, kiuj efektive donas rezultojn, same kiel nia premio kriptaj signaloj ĉe Telegramo.


Ĉu vi interesas lerni kiel komerci kripton? Akiru ĉiujn informojn, kiujn vi bezonas ĉi tie
Will Quant (QNT) Maintain Its Bull Run After a Low of $85?

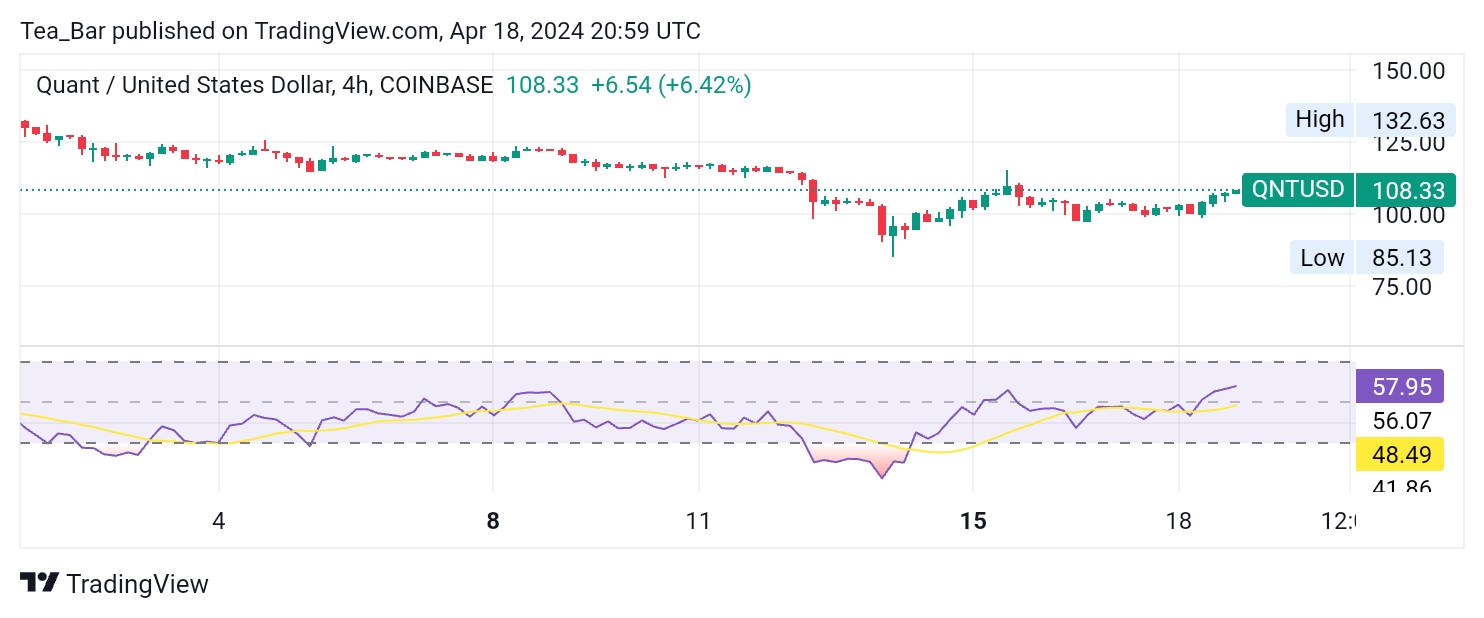
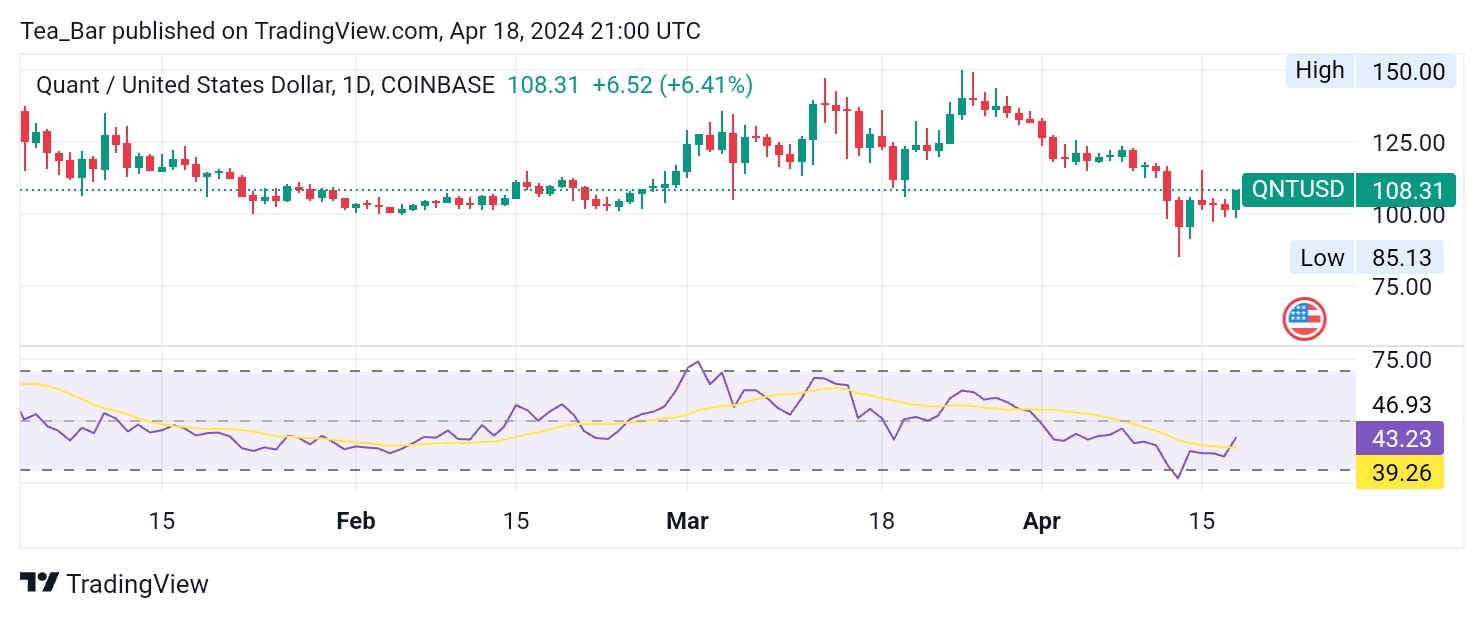
Quant (QNT) has rebounded impressively from its recent low of $85 just five days ago, currently trading at $108. The token has a market cap of $1,289,345,778 USD and a 24-hour trading volume of $18,415,618 USD.

Quant is up 4.58% in the last 24 hours and holds a CoinMarketCap ranking of #68. Strong demand and positive sentiment surround the project, fueled by its focus on blockchain interoperability and strategic partnerecoj.

Whether QNT can sustain its bull run depends on broader market trends and future developments, including regulatory clarity and advancements in the Quant Network.

Longtempa Tendenco de QNT / USD: Alcista (Taga Diagramo)
Ŝlosilaj niveloj:
Rezistaj Niveloj: $ 110, $ 112, $ 114
Subtenaj Niveloj: $ 105, $ 103, $ 100
Will Quant (QNT) Maintain Its Bull Run After a Low of $85?
Kvanto (QNT) has exhibited a strong rebound in the daily market, rising from a low of $85 to $108. This price movement is backed by the daily Relative Strength Index (RSI) reading of 43.23.

An RSI of 43.23 suggests the market is in a neutral zone, indicating potential for further movement to a bullish region. While the RSI is close to the oversold threshold, it provides space for future price growth without reaching the overbought range.

This technical indicator highlights a balanced market environment, where QNT can continue its upward trend. Overall, Quant’s market activity reflects sustained positive sentiment and potential for ongoing growth.

QNTUSD Medium-term Trend: Bullish (4H chart)
Quant (QNT) has displayed notable upward momentum in the 4-hour market. The 4-hour Relative Strength Index (RSI) stands at 57.95, pointing to a market with moderate bullishness.This RSI value signals potential for additional price gains while remaining safely below the overbought threshold.
Will Quant (QNT) Maintain Its Bull Run After a Low of $85?
The market’s intermediate-term outlook is optimistic, with Quant’s steady rise suggesting strong demand and positive expectations for future growth. The 4-hour chart provides a snapshot of sustained bullish sentiment, paving the way for further upward movement in the near term.

Quant (QNT) Positioned for Continued Bullish Trajectory
The token’s rapid recovery from a low of $85 to $108, coupled with a market cap exceeding $1.28 billion and a strong 24-hour trading volume, underscores robust interest and optimism surrounding the project.The daily Relative Strength Index (RSI) of 43.23 suggests a neutral stance in the market, indicating potential for continued price appreciation.

Meanwhile, the 4-hour RSI of 57.95 reveals moderate bullish momentum, pointing to further gains.Quant’s emphasis on blockchain interoperability and strategic alliances is fostering a wave of enthusiasm around its future prospects.

This, combined with a balanced market and consistent demand, indicates QNT is on track for sustained upward movement in the coming days.

Loku gajnan Quant-komercojn kun ni. Akiru QNT tie.

Tamadoge (TAMA/USD) Recovers From Below the $0.005 Price Level

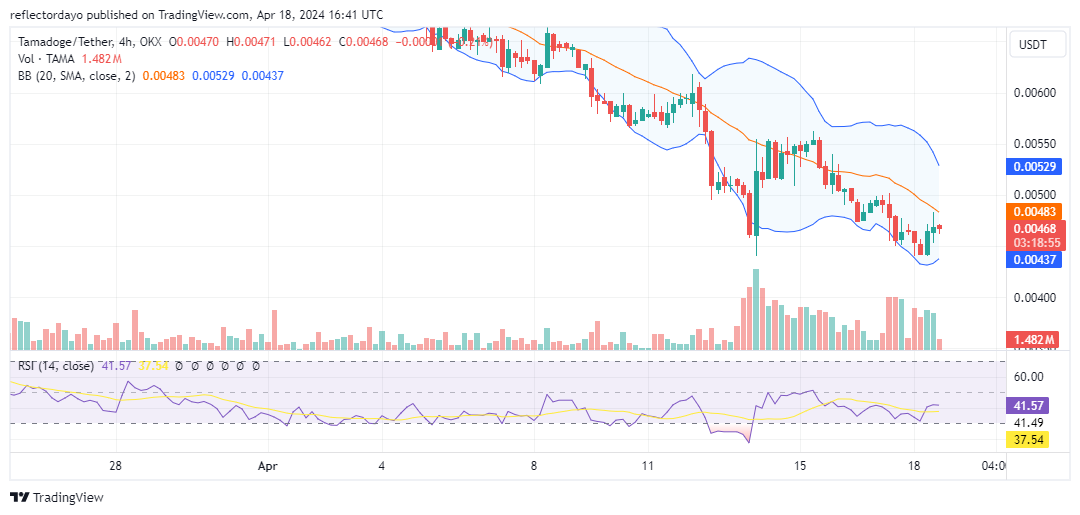
The Tamadoge market exhibited heightened volatility subsequent to a decline below the $0.00005 price threshold, following a protracted struggle for market dominance between bullish and bearish forces. This escalation in volatility can be attributed to the significance of the $0.00005 level as a key support zone; its breach elicited a pronounced bearish sentiment among traders. As a result, bulls were compelled to regroup around the $0.000045 mark. Leveraging the increased volatility, they have since managed to muster significant momentum, steering the market towards a resurgence in bullish sentiment.

Ŝlosilniveloj

  • Rezisto: $ 0.013, $ 0.014 kaj $ 0.015.
  • Subteno: $ 0.0045, $ 0.0040 kaj $ 0.0035.

Tamadoge (TAMA/USD) Recovers From Below the $0.005 Price Level

TAMA/USD Preza Analizo: La Vidpunkto de la Indikiloj

Bulls have begun to converge at the $0.000045 price level, marking a pivotal juncture from which they are initiating a reversal of the market’s trajectory towards the upside. However, this bullish momentum faces considerable resistance. In the preceding 4-hour trading session, the crypto signal featured a candlestick with a small body and long upper and lower shadows, indicating a balance between demand and supply. Currently, the bullish recovery appears capped around $0.000047, while the Bollinger Bands continue to delineate a downward-trending price channel. The initial step towards reorienting the tamadoge market in an upward direction may entail a consolidation phase. Subsequently, as bearish sentiment dissipates at this level, a price ascent is anticipated.

Tamadoge (TAMA/USD) Recovers From Below the $0.005 Price Level

Tamadoge Mallonga Perspektivo: 1-Hora Diagramo

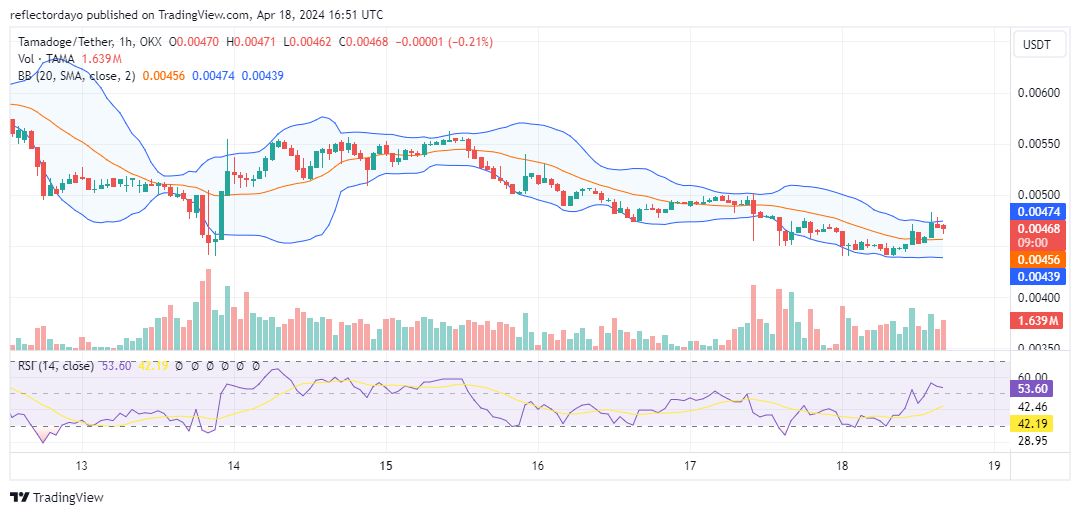
The market’s 1-hour timeframe also indicates a ranging trend. Upon reaching the $0.000045 price level during the bearish phase, the market exhibited a period of stagnation, attributed to significant bullish activity at this level. Shortly thereafter, a bullish reversal was observed, driving the market upward. Nevertheless, bearish resistance has emerged at $0.000047. Presently, bullish pressure is evident at this resistance level, with the price action maintaining a position above the 20-day moving average.

Get your fair share of $TAMA in this play-to-earn runner game with lively graphics, humorous characters, and quick gameplay.

Ĉu vi volas moneron, kiu estos 100 fojojn pli valora en la venontaj monatoj? Tio estas Tamadoge. Aĉetu TAMA hodiaŭ!

Uniswap (UNI/USD) Trade Is Building Footsteps, Hovering at $7

Unua Interŝanĝa Prezo - 18 aprilo

Quite some momentum has been allowed to go in the way of declines while bulls and bears have been struggling against others around indicators’ imaginary spots of trending, given that the UNI/USD merkato is presently building footsteps, hovering around the value line of $7.

Over a couple of days back, forces to the south direction around the lower Bollinger Band trend line have been made to be losing capacities gradually in a line of trying to produce a probable long range of low price actions that are majorly expected to give in back to smooth paths toward securing stable increases thereof.

UNI / USD-Merkato
Ŝlosilaj Niveloj:
Rezistaj niveloj: $ 9, $ 11, $ 13
Subtenaj niveloj: $ 6, $ 5, $ 4

UNI / USD - Ĉiutaga Diagramo
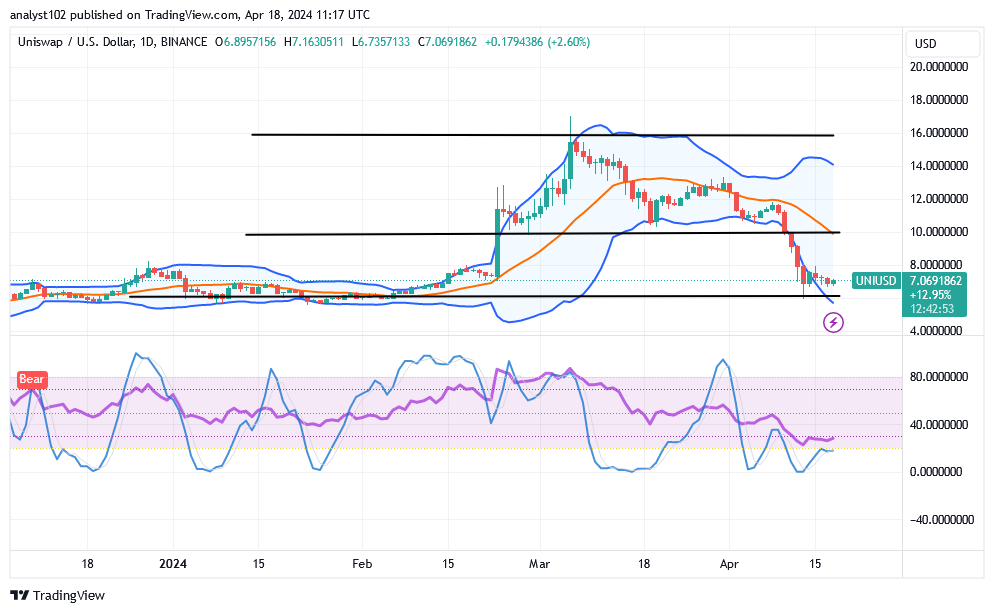
The UNI/USD daily chart reveals the crypto-economic market is building footsteps around the line of $7, as the price is hovering around the line.

The stochastic oscillators have been observed, over some sessions to have been swinging around some points not too far above the oversold region. And they do dip mostly in the area many times to signify that forces to the reduction direction are getting weaker.
Uniswap (UNI/USD) Trade Is Building Footsteps, Hovering at $7

Can there be additional avenues for the downside given that the BTC/USD market is currently trading near $7?

It would be out of technical principle method of trading for sellers to go further to the downside, given that the UNI/USD market is currently building footsteps, hovering around the point of $7.

Some indicators are at considerably to the downside to touch maximal decrease spots that are psychologically ideal for buyers to get reshape toward getting decent entries to make comebacks. Looking at the effect of he corrections, the market has been made to put in back for another round of moving into rising direction.

Right now, bears need to exercise caution while positioning themselves in relation to the lower Bollinger Band trend line. One of he reasons backing that logical thoughts is that an oversold reading condition has depicted by the stochastic oscillators to imply that it would be riskier for sellers to run safely on a profiteering manner even if there will be a line of delays in he price actions.
Uniswap (UNI/USD) Trade Is Building Footsteps, Hovering at $7
UNI / BTC-Prezo-Analizo
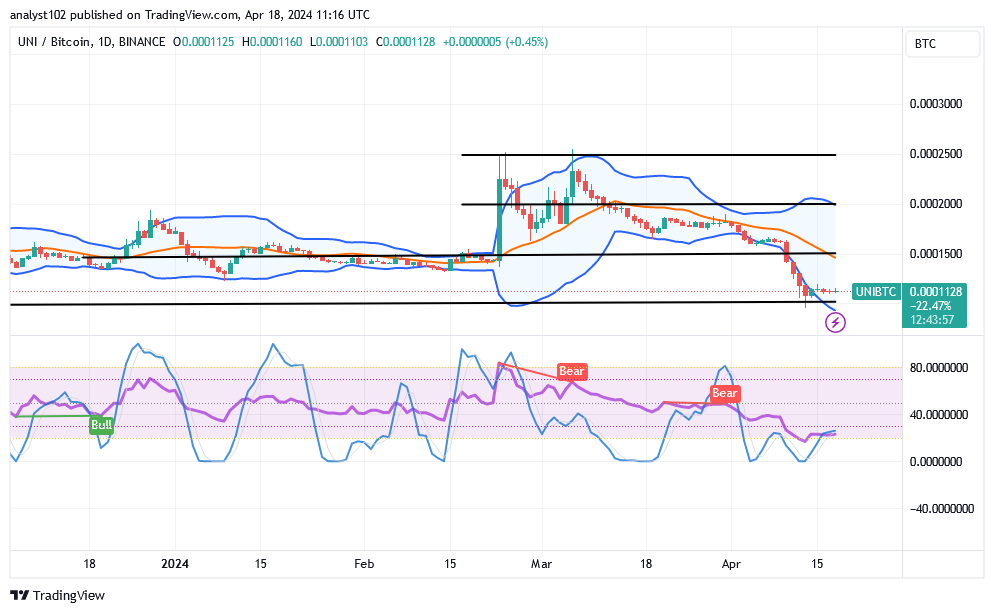
En kontrasto, la Uniswap komerco is currently building footsteps against the valuation of Botcoin, hovering around the lower Bollinger Band.

The stochastic oscillators have been seen swinging around the oversold region with less out of the spots to the upside. . The lower moving component of the Bollinger Band trend lines has been in a losing condition, indicating that there is pressure on the base crypto economy to decrease. Nevertheless, it doesn’t appear that the trends are becoming more severe in order to decline freely.
\
Noto: Cryptosignals.org ne estas financa konsilisto. Faru vian esploron antaŭ ol investi viajn financojn en iu ajn financa valoraĵo aŭ prezentita produkto aŭ evento. Ni ne respondecas pri viaj investaj rezultoj.


Vi povas aĉeti Lucky Block ĉi tie. Aĉetu LBLOCK

$SPONGE (SPONGE/USD) Shows Signs of Strength, Upward Trend Possible

Over the preceding two days, our observations revealed prolonged stability in the SPONGO/USD market, characterized by a consistent presence around the $0.000045 price level. During this period, price action remained stagnant, resulting in a flat trajectory. The equilibrium persisted due to an apparent deadlock between supply and demand, rendering both bulls and bears incapable of exerting significant influence. Notably, the market maintained a static state at the $0.000045 price level.

However, according to today’s kripta signalo, we noted sudden market developments indicating a potential shift in sentiment, hinting at the possibility of an impending upswing.

Ŝlosila Merkata Dinamiko:

  • Rezistaj Niveloj: $0.0010, $0.0011 kaj $0.0012.
  • Subtenaj Niveloj: $ 0.000035, $ 0.000030, kaj $ 0.000025.

$SPONGE (SPONGE/USD) Shows Signs of Strength, Upward Trend Possible

Enprofundiĝi en Teknikan Analizon por $SPONGE (SPONGO/USD):

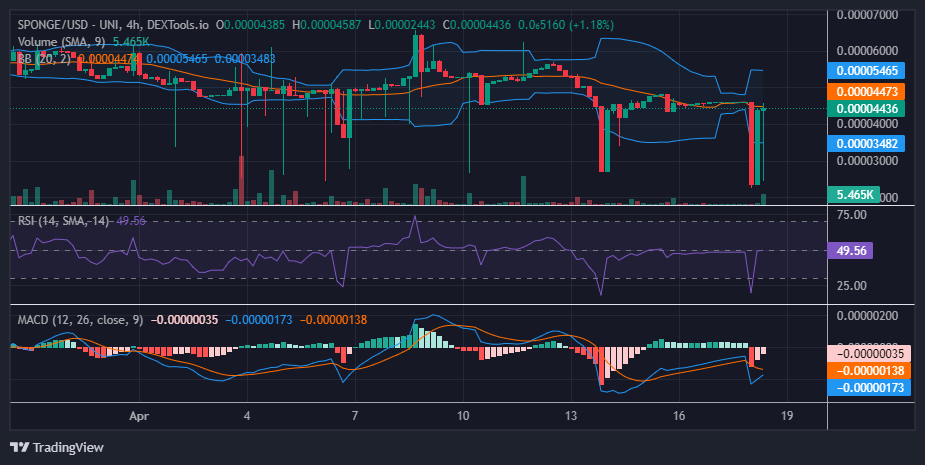
While the market gridlock persisted, a significant breakout occurred in the bear market during the initial trading session of the day, driving prices down to the $0.000023 level. Subsequently, the following trading session witnessed a surge in bullish sentiment, leading traders to capitalize on the dip and elevating the market back to the $0.000045 level. This rapid and volatile price swing repeated itself in the third trading session.

The resilience displayed by the bulls in swiftly recovering from the test of lower price levels underscores their strength within this price range. As the bull market gathers momentum, it is conceivable that subsequent tests of lower levels may result in the establishment of higher lows. Such occurrences could potentially catalyze a bullish breakout above the $0.000045 level, signaling the emergence of a bullish trend.

$SPONGE (SPONGE/USD) Shows Signs of Strength, Upward Trend Possible

Konsideroj de la 1-hora Perspektivo:

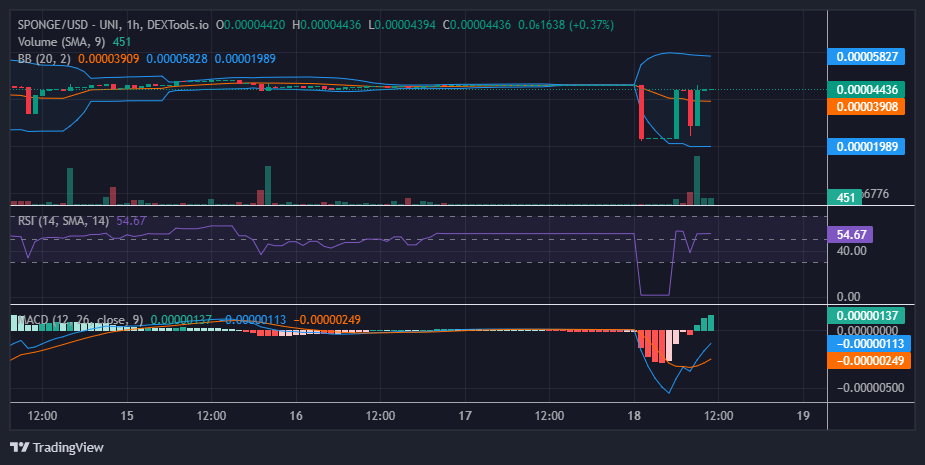
Higher lows have begun to emerge on the SPONGE/USD market chart, as observed from the 1-hour chart perspective. This development signifies a positive trend for bullish traders, indicating a gradual accumulation of bullish momentum. However, a slight adjustment in the resistance level, shifting from $0.000045 to approximately $0.000044, suggests a temporary claim by bears for this resistance threshold. Yet, given the persistent strength exhibited by the bulls, there is potential for this price level to eventually yield.

Wonderful news! Over 9.8 million $SPONGE coins have been staked as of right now!

Investu en la plej varma kaj plej bona mema monero. Aĉetu Sponge ($SPONGE) hodiaŭ!

Bitcoin (BTC/USD) Price Is Lowering, Conjecturing a Base

Antaŭdiro de Bitcoin-Prezo - 17 aprilo

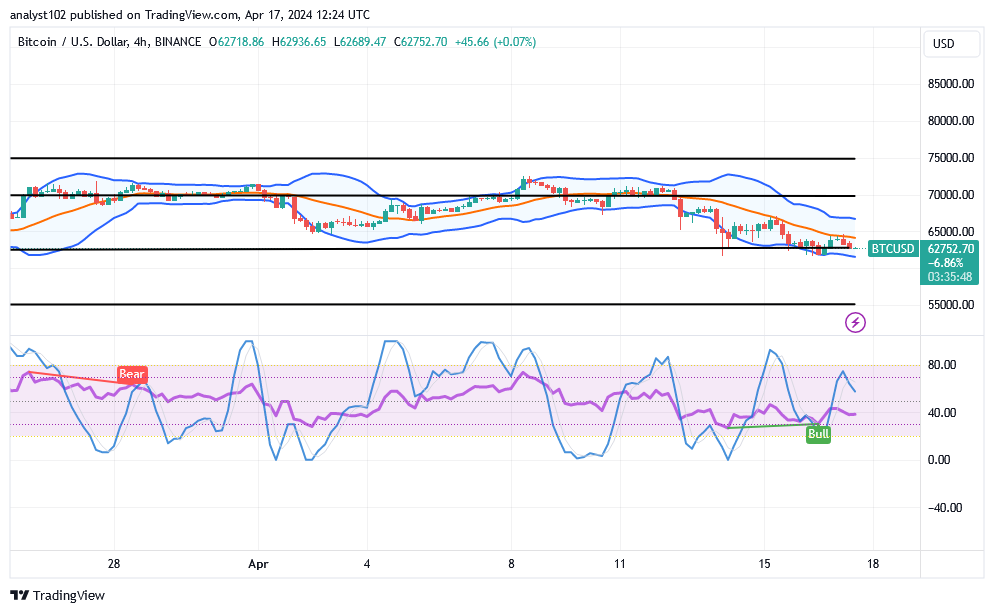
It has been significantly demonstrated that the process that could let bulls regain their stances in the BTC/USD komerco against bears has not been gaining a healthy weight, given that the crypto business is presently lowering and conjecturing a base reconstruction move around the point of $60,000.

If the correction movements that have taken center stage in the exchange lines continue, it would be a shocking move that would eventually see the price of the cryptocurrency drop much lower, to a support level of $50,000. However, given that the cycle of rebounding has been garnering a lot of attention this month, that scenario might not offer a highly technical arrangement setup to achieve excellent shorting entry.

BTC / USD-Merkato
Ŝlosilaj Niveloj:
Rezistaj niveloj: $ 70,000, $ 75,000, $ 80,000
Subtenaj niveloj: $ 55,000, $ 52,500, $ 50,000

BTC / USD - Ĉiutaga Diagramo
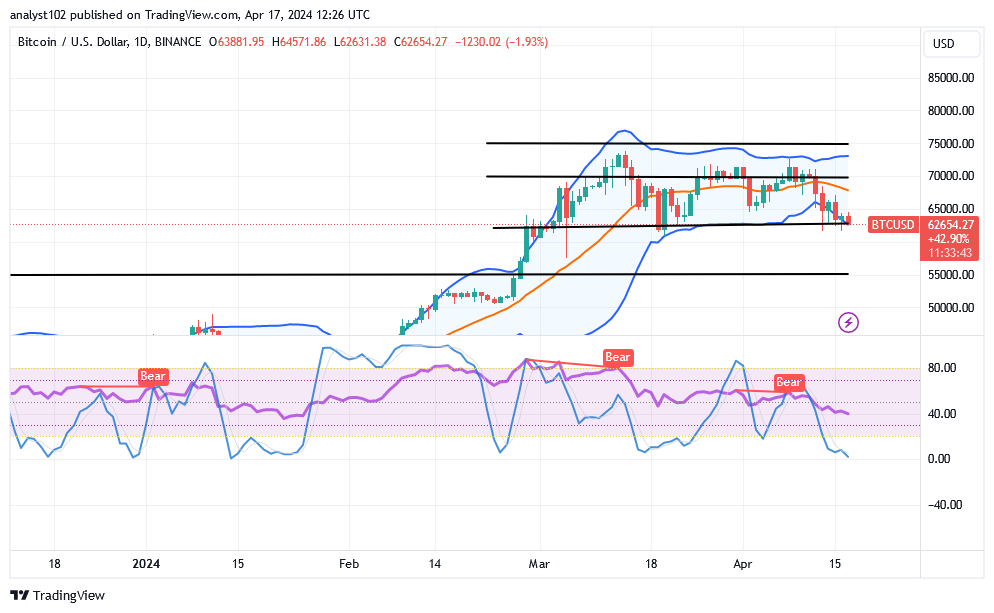
The BTC/USD daily chart reveals that the crypto market is lowering, conjecturing a low around the point of $60,000.

The Bollinger Band trend lines are positioned at higher trade zones, with their lower part being relatively stretched by the reactions of sellers. Variant low-falling forces have been made on the feature of candlesticks to denote that some falls are in place. The stochastic oscillators are in the oversold region, denoting that a consolidation movement is tentatively going on.
Bitcoin (BTC/USD) Price Is Lowering, Conjecturing a Base

As there has been a correction in the price of Bitcoin over USD, should sellers freely execute shorting orders at $60,000?

It might not be too safe for sellers to continue to execute selling position orders below the point of $60,000, as the BTC/USD-merkato is lowering, conjecturing a base even around the point mentioned.

Upon noticing a tiny upward spike signal, long-position movers with substantial equity may start to introduce a portion of their money to the smallest lot size. In order to run long-term, they will need to abandon their position and pay attention to the stochastic oscillators heading upward.

In the event that short-position movers in the Bitcoin/USD market manage to regain decent entry, the middle Bollinger Band trend line will be a more useful tool, particularly around the $70,000 resistance level. To provide a clear indication of a shorting order, there must be some pulls toward or toward the value line, together with rejection signals at the top end of the candlestick’s development.
Bitcoin (BTC/USD) Price Is Lowering, Conjecturing a Base
Diagramo de 4-hora BTC / USD
la BTC / USD 4-hour chart shows that the crypto market is lowering and conjecturing a base reformation around $60,000.

The Bollinger Band trend lines have managed to briefly bend southbound to connote that boundaries of getting back rebounds are being formed. In order to acquire a curved shape on the south side beyond the line of 80, the stochastic oscillators have veered upward. Psychologically, it would be acceptable to wait for index bounces before placing a buy order.


Noto: Cryptosignals.org ne estas financa konsilisto. Faru vian esploron antaŭ ol investi viajn financojn en iu ajn financa valoraĵo aŭ prezentita produkto aŭ evento. Ni ne respondecas pri viaj investaj rezultoj.


Vi povas aĉeti Lucky Block ĉi tie. Aĉetu LBLOCK

Super Trump (STRUMP/USD) Gathers Momentum: Bullish Sentiment Emerges at $0.0023

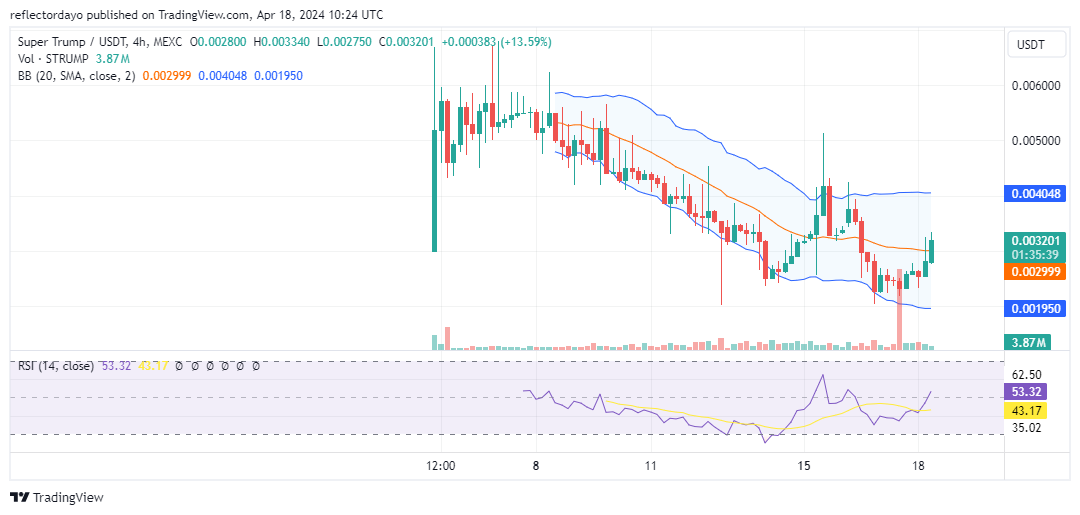
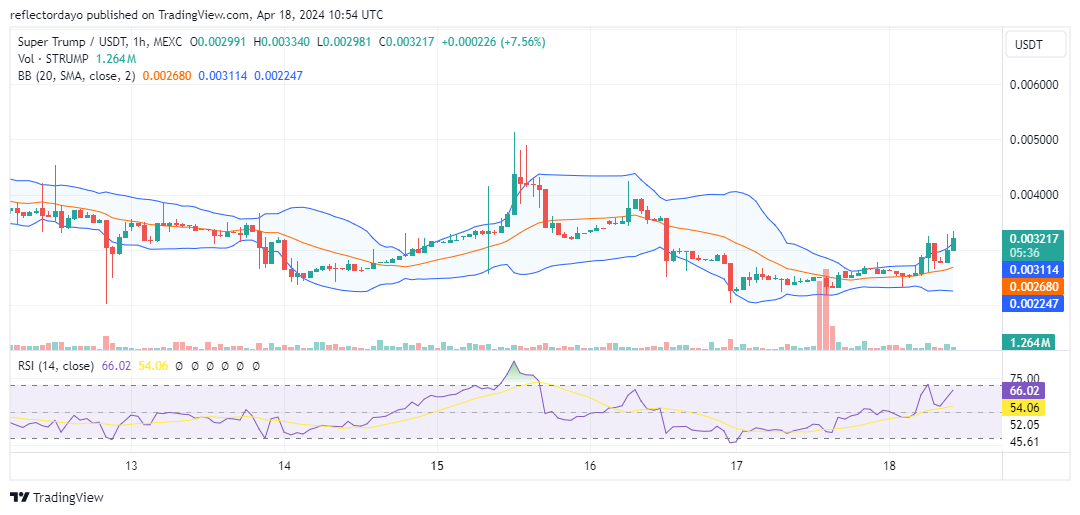
Based on the chart utilized for this analysis, it appears that the Super Trump market experienced a market peak in early April. Subsequently, significant selling pressure emerged, initiating a downward trend following an initial peak at $0.0068. The sustained selling pressure rendered the support level at approximately $0.003 insufficient to reverse the market trajectory. Such formidable selling activity necessitated a reconsolidation of bullish forces around $0.0023. Currently, there are indications of a market reversal towards the upside from this point onward.

Super Trump Market Data

  • STRUMP/USD Price Now: $0.0032
  • STRUMP/USD Market Cap: $5.4 million
  • STRUMP/USD Circulating Supply: 1.79 billion
  • STRUMP/USD Total Supply: 2.34 billion
  • STRUMP/USD CoinMarketCap Ranking: #1245

Super Trump (STRUMP/USD) Gathers Momentum: Bullish Sentiment Emerges at $0.0023

Ŝlosilniveloj

  • rezisto: $ 0.0035, $ 0.0040, kaj $ 0.0045.
  • subteno: $ 0.0023, $ 0.0020, kaj $ 0.0018.

 Super Trump Through the Lens of Indicators

Initially, on April 12, the Super Trump market tested the $0.002 price level. Subsequently, on April 14, bullish activity around the $0.0025 price level once again redirected the price trajectory. However, bears reemerged at the $0.005 price level, instigating a renewed bearish trend. Nevertheless, bulls demonstrated resilience yet again, reversing the market’s direction at $0.0023.

Observations of the Bollinger Bands indicate a market within a wide range, suggesting a state of ranging. To establish a clear trend, a breakout is expected either above $0.005 or below $0.0020. The current market volatility is underscored by the Relative Strength Index, which reflects significant fluctuations. Notably, there is a gradual buildup of bullish momentum.

Super Trump (STRUMP/USD) Gathers Momentum: Bullish Sentiment Emerges at $0.0023

STRUMP Price Prediction: 4-Hour Chart Analysis 

Examining the market through a finer lens reveals a systematic progression by the bulls; the kripta signalo evidently portrays the establishment of marginally higher lows. Their momentum is further underscored by their successful breach above the $0.0030 price threshold, potentially transforming prior resistance into support. Consequently, the prevailing trend indicates a retreat by the bears in response to the mounting bullish momentum.

Komercu kriptajn monerojn sur BYBIT!

Aĉetantoj de APEUSD Planas Reakiri Forton Inter Rigidaj Merkataj Kondiĉoj

Market Analysis – The Bears Look Forward to More Flow

APEUSD buyers plan to recover strength amidst rigid market conditions. The APEUSD market has been experiencing a bearish trend. However, recent developments suggest that buyers are planning to regain their strength and push back against the downward pressure. 

Ŝlosilaj Niveloj de APEUSD

Rezistaj Niveloj: $ 2.7100, $ 2.4900 
Support Levels: $2.3100, $.15700

Aĉetantoj de APEUSD Planas Reakiri Forton Inter Rigidaj Merkataj Kondiĉoj

The bearish market flow in the APEUSD market has been evident in recent times. At the beginning of the month, sellers had an easy drop below the significant level of $1.860. This downward momentum continued as sellers managed to push the price down to the $1.5700 level. However, the buyers at this level attempted to initiate a recovery, but their efforts were not sufficient. It is possible that the lack of interest from investors hindered their progress.
 
Following the consolidation above the $1.5700 market zone, sellers gained the upper hand once again. The price dropped significantly, reaching as low as the $0.9900 market zone. This dominance by sellers indicates strong bearish sentiment in the APEUSD market. However, it is important to note that the buyers have recently started to make a resupply in an attempt to fight back.
 
The price oscillator is currently declining, indicating a downward trend in the market. This suggests that sellers are still determined to continue their strike. Additionally, the momentum indicator is dropping, further reinforcing the notion that sellers are fighting back.

Aĉetantoj de APEUSD Planas Reakiri Forton Inter Rigidaj Merkataj Kondiĉoj

Merkata Atendo 

The battle between buyers and sellers in the APEUSD market is currently centered around the significant level of $1.2000. This level holds great importance as it represents a potential turning point for the market. If the buyers manage to overcome the selling pressure and push the price above this level, it could signify a shift in market sentiment and a potential reversal of the bearish trend.

Despite the efforts of buyers and sellers, the APEUSD market remains rigid. Traders should anticipate more price flow as the battle between buyers and sellers continues.

Vi povas aĉeti Lucky Block ĉi tie. Aĉetu LBLOCK

notocryptosignals.org ne estas financa konsilisto. Faru vian esploron antaŭ ol investi viajn financojn en iu ajn financa valoraĵo aŭ prezentita produkto aŭ evento. Ni ne respondecas pri viaj investaj rezultoj.

Decentraland (MANAUSD) Signalas Bearish Breakout

Market Analysis: Bearish Breakout From a Consolidating Trend

In recent price action, MANAUSD is characterized by the converging of lower highs and higher lows, which reflects price in a period of consolidation. The consolidation resulted in the formation of a symmetrical triangle pattern, with the market breaking out to indicate a bearish bias.

Ŝlosilaj Niveloj de MANAUSD

Postulaj Niveloj: $ 0.4480, $ 0.3200
Provizaj Niveloj: $ 0.7030, $ 0.8130

Decentraland (MANAUSD) Signalas Bearish Breakout

MANAUSD reached a new major high in mid-March 2024, surpassing the $0.7030 supply level, suggesting an initial bullish trend. However, the price formed a symmetrical triangle pattern, indicating a decrease in bullish volatility. The price subsequently broke below the triangle, signaling a bearish reversal in the current price action.

The bearish breakout resulted in a significant decline after breaking through the $0.4480 demand level, clearing the liquidity below and leaving no room for any potential retracement. The sharp drop in price led to the formation of a Fair Value Gap (FVG) in the 4-hour timeframe. The daily Relative Strength Index shows that the price is well below the 30.0 overbought region, indicating a potential for a pullback that is expected to fill the open Fair Value Gap.

Decentraland (MANAUSD) Signalas Bearish Breakout

Merkata Atendo

Bearish momentum is expected to continue after a price retracement to the Fair Value Gap, with the market anticipated to drop further below $0.3200.

Vi povas aĉeti Lucky Block ĉi tie. Aĉetu LBLOCK

Noto: cryptosignals.org ne estas financa konsilisto. Faru vian esploron antaŭ ol investi viajn financojn en iu ajn financa valoraĵo aŭ prezentita produkto aŭ evento. Ni ne respondecas pri viaj investaj rezultoj.