લિટેકોઇન ભાવની આગાહી - 23 એપ્રિલ
Bulls have been making some efforts toward formulating a basis above the point of $70 in the Litecoin વેપાર versus the valuation of the US dollar, as the current financial situation reports that the price hovers below $90, tending to pause.
Technically speaking, as at the time of this article, neither the seller’s nor the buyer’s capacity may develop in a clear way beyond its existing hovering range. However, bulls are likely to remain in control even outside the confines of the Bollinger Bands if the market’s price moves away from the current direction in the long run.
એલટીસી / યુએસડી માર્કેટ
કી સ્તરો:
પ્રતિકાર સ્તર: $ 90, $ 100, $ 110
સપોર્ટ સ્તર: $ 70, $ 65, $ 60
એલટીસી / યુએસડી - દૈનિક ચાર્ટ
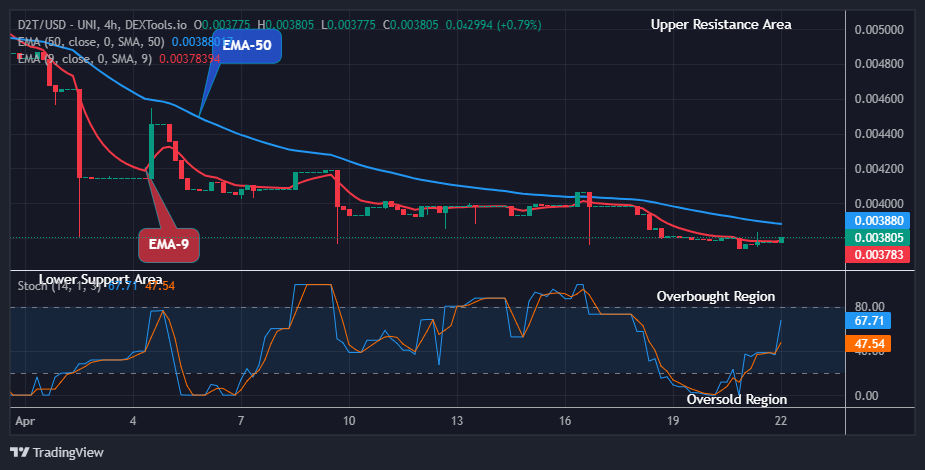
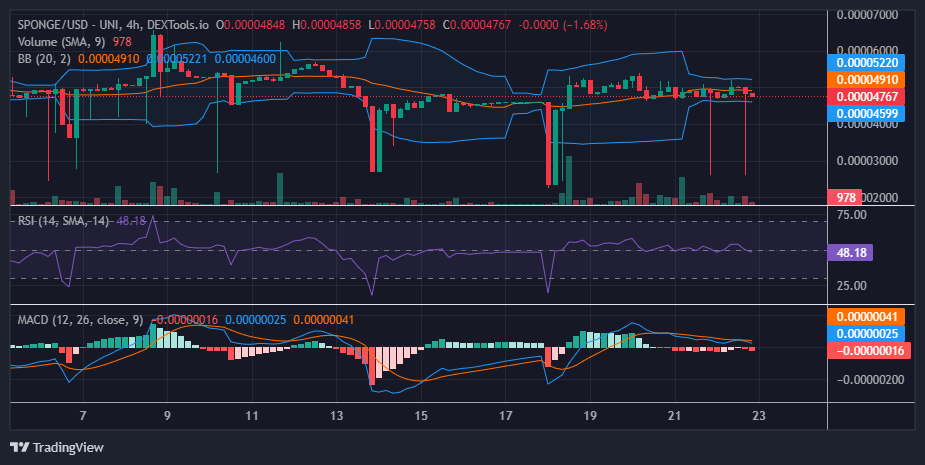
The LTC/USD daily chart showcases that the crypto-economic trade hovers below $90, tending to pause.
The Bollinger Band trend lines have been making some attempts at trying to curve back northward from the lower end. The candlesticks formation around the lower Bollinger Band has been generating signs toward getting a firm base for the price to make formidable upsurges. The stochastic oscillators have systemically stretched northbound, placing around 40 to 50 points.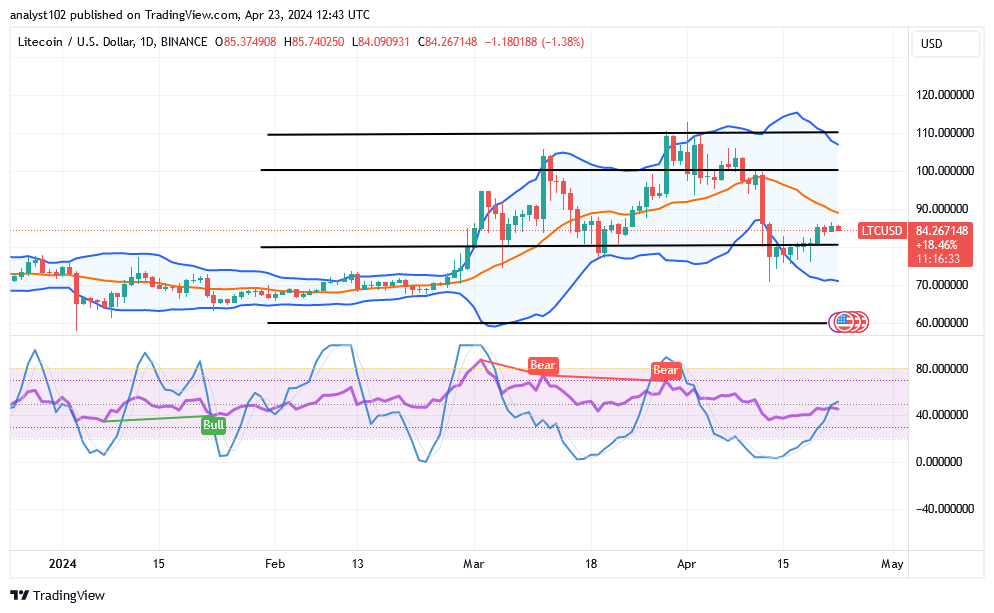
If the price of LTC/USD market will have to go further under, which support id likely to hit?
If there’ll be more room for the LTC/USD બજાર to shift under, the support value line around $70 will likely be revisited, given that the crypto-economic market hovers below $90 as of the writing of this piece, tending to pause.
The stochastic oscillators are in crucial zones that indicate the road on which the price may revert to a downward path, so the LTC/USD market long-position pushers will need to exert a great deal of work to push the market line northward from its current trading spot. However, over time, there is a chance that the price will continue to rise above the $70 mark.
As it has been observed, the resistance line of $90 has not to be breached northward if the activities of bulls have to be decimating in a way. If the price touches the middle Bollinger Band with an active falling force will generate decent entries for shorting position orders if buyers turn out to get weakened around the indicator.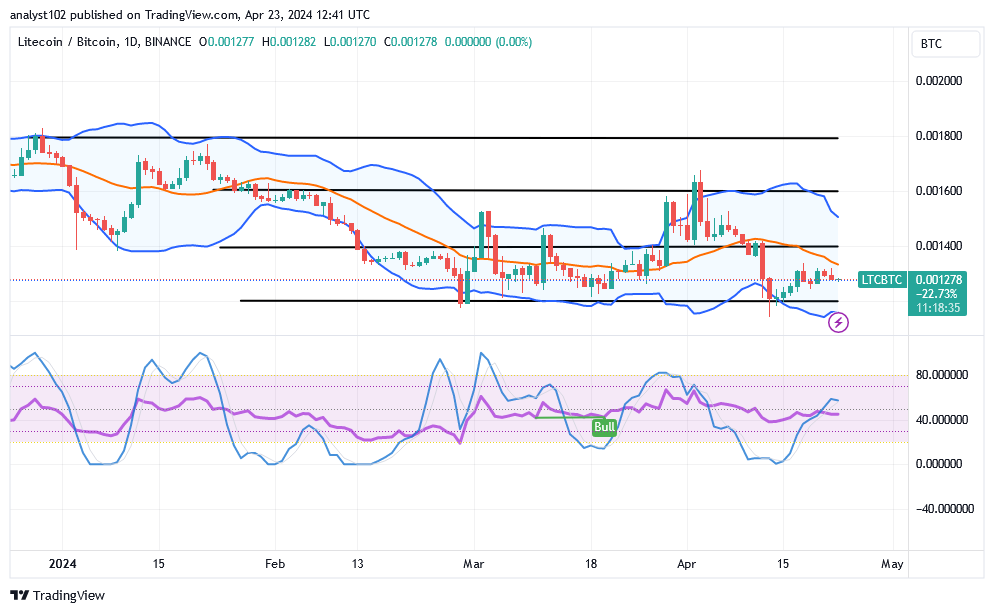
એલટીસી / બીટીસી ભાવ વિશ્લેષણ
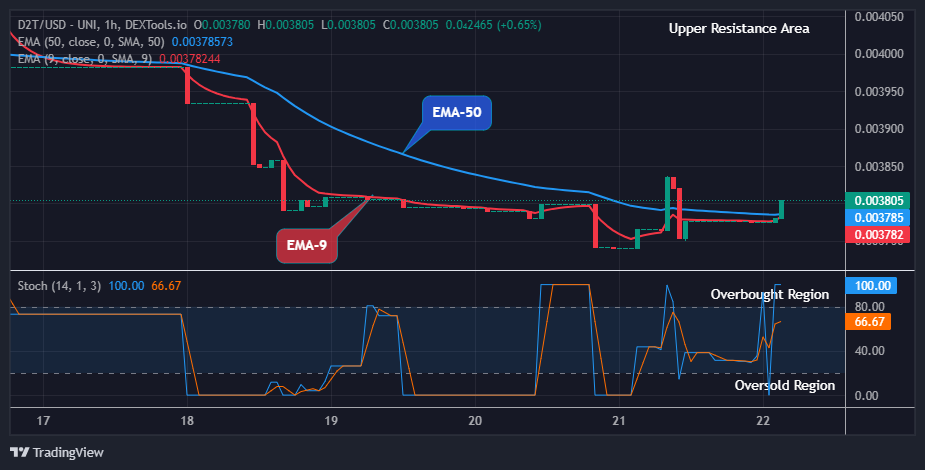
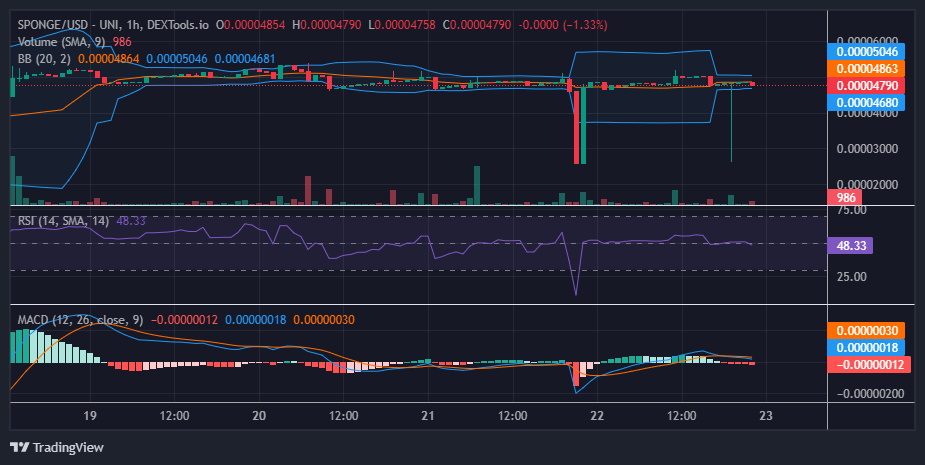
In contrast, the Litecoin market hovers below the middle Bollinger Band against the point of Bitcoin, tending to pause.
In order to produce the line where rebounding price actions in the weight of the base cryptocurrency to counter its counterpart instrument can occur, the Bollinger Band trend lines are being moved to their bottom portion. The fact that the stochastic oscillators are in a northbound-crossing state indicates that the foundational cryptocurrency is preparing to gain greater traction. This indicates that the general conclusion is still that purchasing forces will win in the majority of the ensuing turbulent moves.
નોંધ: Cryptosignals.org એ નાણાકીય સલાહકાર નથી. કોઈપણ નાણાકીય સંપત્તિ અથવા પ્રસ્તુત ઉત્પાદન અથવા ઇવેન્ટમાં તમારા ભંડોળનું રોકાણ કરતા પહેલા તમારું સંશોધન કરો. અમે તમારા રોકાણ પરિણામો માટે જવાબદાર નથી.
તમે અહીં લકી બ્લોક ખરીદી શકો છો. LBLOCK ખરીદો
 MANAUSD એ એપ્રિલ 2024ના મધ્યમાં નોંધપાત્ર ઘટાડો અનુભવ્યો હતો, જેના કારણે કિંમત $0.4250ની માંગના સ્તરને સહેજ ભંગ કરે છે અને હાલની તરલતા નીચે લઈ જાય છે. તરલતા લેવામાં આવતાં, કિંમત નિષ્ફળ નીચી બની હતી, જે વેચાણ દબાણમાં ઘટાડો સૂચવે છે, જે સંભવિતપણે ભાવમાં વધારો તરફ દોરી શકે છે.