Litecoin (LTC/USD) Market Hovers Below $90, Tending a Pause

Prediksi Harga Litecoin - 23 April

Bulls have been making some efforts toward formulating a basis above the point of $70 in the Litecoin perdagangan versus the valuation of the US dollar, as the current financial situation reports that the price hovers below $90, tending to pause.

Technically speaking, as at the time of this article, neither the seller’s nor the buyer’s capacity may develop in a clear way beyond its existing hovering range. However, bulls are likely to remain in control even outside the confines of the Bollinger Bands if the market’s price moves away from the current direction in the long run.

Pasar LTC / USD
Tingkat Kunci:
Level resistance: $ 90, $ 100, $ 110
Level dukungan: $ 70, $ 65, $ 60

LTC / USD - Grafik Harian
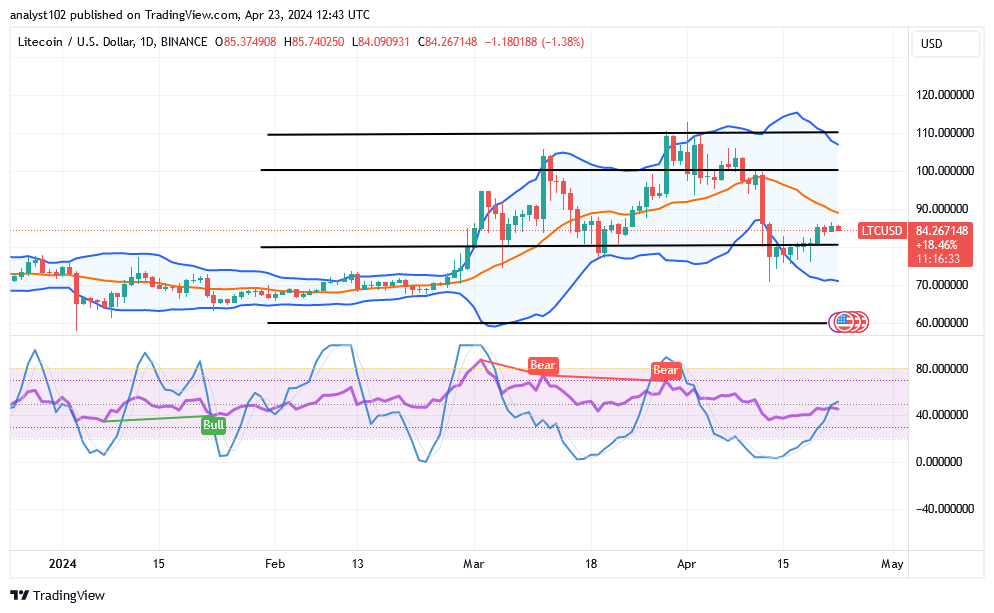
The LTC/USD daily chart showcases that the crypto-economic trade hovers below $90, tending to pause.

The Bollinger Band trend lines have been making some attempts at trying to curve back northward from the lower end. The candlesticks formation around the lower Bollinger Band has been generating signs toward getting a firm base for the price to make formidable upsurges. The stochastic oscillators have systemically stretched northbound, placing around 40 to 50 points.
Litecoin (LTC/USD) Market Hovers Below $90, Tending a Pause

If the price of LTC/USD market will have to go further under, which support id likely to hit?

If there’ll be more room for the Pasar LTC / USD to shift under, the support value line around $70 will likely be revisited, given that the crypto-economic market hovers below $90 as of the writing of this piece, tending to pause.

The stochastic oscillators are in crucial zones that indicate the road on which the price may revert to a downward path, so the LTC/USD market long-position pushers will need to exert a great deal of work to push the market line northward from its current trading spot. However, over time, there is a chance that the price will continue to rise above the $70 mark.

As it has been observed, the resistance line of $90 has not to be breached northward if the activities of bulls have to be decimating in a way. If the price touches the middle Bollinger Band with an active falling force will generate decent entries for shorting position orders if buyers turn out to get weakened around the indicator.
Litecoin (LTC/USD) Market Hovers Below $90, Tending a Pause
Analisis Harga LTC / BTC
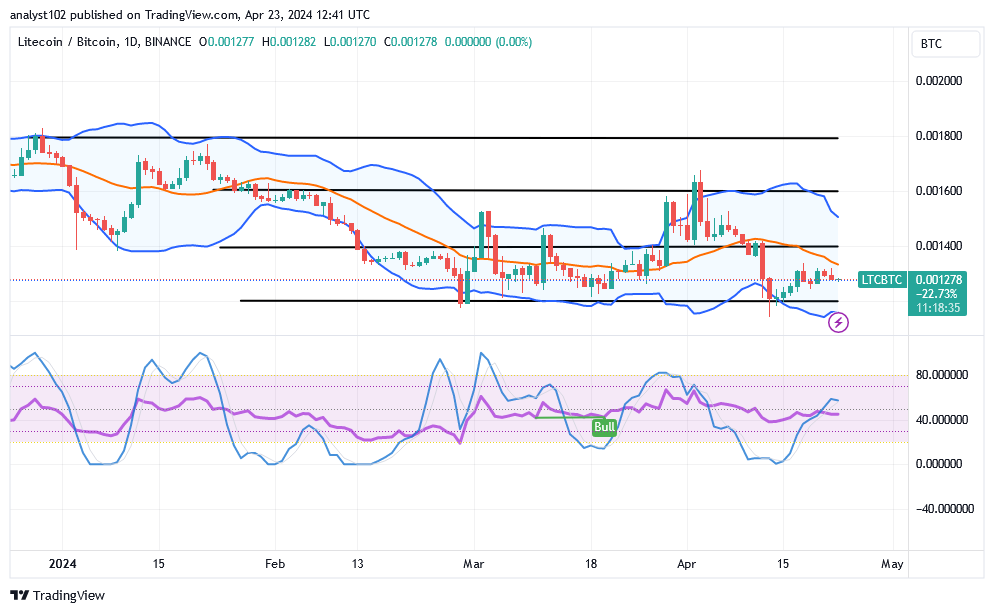
In contrast, the Litecoin market hovers below the middle Bollinger Band against the point of Bitcoin, tending to pause.

In order to produce the line where rebounding price actions in the weight of the base cryptocurrency to counter its counterpart instrument can occur, the Bollinger Band trend lines are being moved to their bottom portion. The fact that the stochastic oscillators are in a northbound-crossing state indicates that the foundational cryptocurrency is preparing to gain greater traction. This indicates that the general conclusion is still that purchasing forces will win in the majority of the ensuing turbulent moves.

Catatan: Cryptosignals.org bukan penasihat keuangan. Lakukan penelitian Anda sebelum menginvestasikan dana Anda dalam aset keuangan atau produk atau acara yang disajikan. Kami tidak bertanggung jawab atas hasil investasi Anda.


Anda dapat membeli Lucky Block di sini. Beli LBLOCK
Prediksi Harga Perdagangan Dash 2 untuk Hari Ini, 24 April: D2TUSD Mengubah Arah ke Atas

Dash 2 Trade Price Forecast: D2TUSD Changes Direction to the Upsides (April 24)
Grafik D2TUSD price is mounting the upside ladder again while recovering from the low dips by the sell traders. The crypto is currently showing positive signs that the bulls are still active.
However, the currency pair could grow further if the buy traders can break up the $0.00505 previous high level, maintaining a further growth potential for the buy traders.

Tingkat Kunci:
Level resistance: $ 0.00500, $ 0.00600, $ 0.00700
Level dukungan: $ 0.00300, $ 0.00200, $ 0.00100

D2T (USD) Tren Jangka Panjang: Bearish (4H)
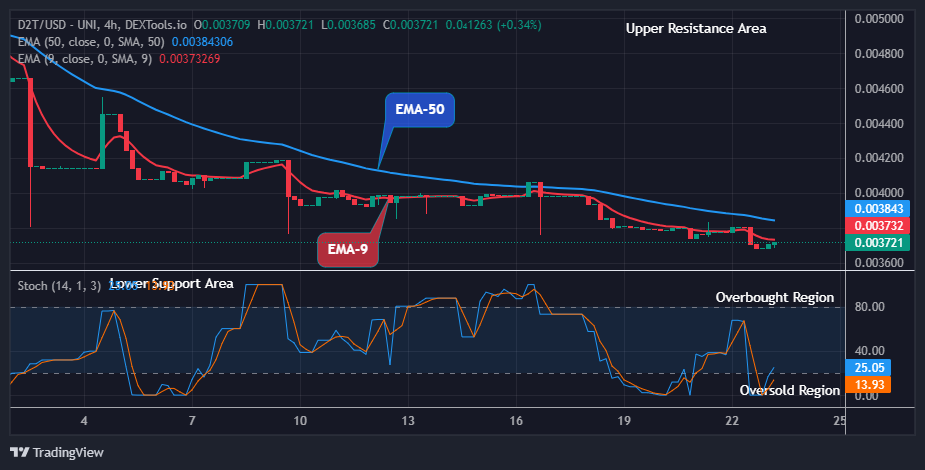
Grafik D2TUSD pair is making its way to the resistance area in its long-term outlook. The price bars can be seen below the resistance trend levels confirming its bearishness, trying to change its direction to the upsides by resisting the sell traders.
Prediksi Harga Perdagangan Dash 2 untuk Hari Ini, 24 April: D2TUSD Mengubah Arah ke Atas
The sustained bearish pressure at the $0.00368 support level in the previous action has made the crypto price remain below the supply trend lines in its recent high.

Today, the bulls changed their orientation and aggressively moved the D2TUSD price up to the $0.00372 supply value below the moving average lines as the 4-hourly chart opens.

Thus, the bullish correction at the mentioned supply value returns the buy investors to the market for the next increase race. This breakout is possible to give buyers a significant footing to bolster further rally. Meanwhile, traders can buy the token during the current trend at a lower rate for more gains ahead.

Selain itu, Dasbor 2 Perdagangan price remains in an uptrend on the daily signal. Therefore, the bulls could aim at the psychological level of $0.01000 resistance value in the days ahead as the crypto changes direction to the upside in its long-term perspective.

D2T (USD) Tren Jangka Menengah: Bullish (1H)
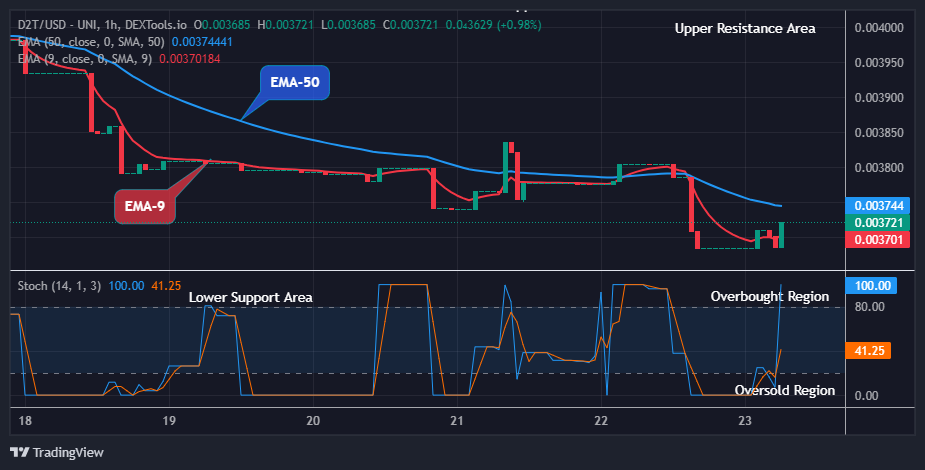
On the medium-term outlook, the market price of D2TUSD is currently trading in a bullish market zone. This is due to the high inflows of the buy traders.
Prediksi Harga Perdagangan Dash 2 untuk Hari Ini, 24 April: D2TUSD Mengubah Arah ke Atas
The bullish impact on the crypto to the $0.00380 supply level during the previous action has sustained its firmness above the supply levels in its recent price level.

Today, after completing the downward pressure at the $0.00368 support level, the bulls made an upward move to the $0.00372 high value above the moving average-9 lines as the 1-hourly chart opens. The cryptocurrency looks promising as the bulls remain dominant in the market at the moment.

If the bulls should increase their price action, and bullish momentum is sustained far above the previous resistance 0.00398 level, further bearish sentiment will be hibernated.

In addition, the daily stochastic indicates an upward trend, this means that the buy investors may likely continue with the bull run and the target might be the $0.01000 resistance level soon in its medium-term perspective.

Possibly the most useful technique for enhancing your trading success is backtesting.


Ingin koin yang memiliki potensi pengembalian besar? Koin itu adalah Dash 2 Trade. Beli D2T sekarang.

Arus Keluar Crypto Bertahan untuk Minggu Kedua Di Tengah Kekhawatiran Suku Bunga

Crypto investment products have witnessed a second consecutive week of crypto outflows totaling $206 million, as reported by CoinShares. This decline coincides with a slight decrease in trading volumes of Exchange-Traded Products (ETPs), now kedudukan at $18 billion. Interestingly, these figures represent only 28% of total Bitcoin trading volumes, contrasting sharply with the 55% recorded just a month earlier.

Analysts attribute this waning interest among ETP and Exchange-Traded Fund (ETF) investors to the Federal Cadangan indication of maintaining current high-interest rates for an extended period.

US Records Notable Crypto Outflows: $244 Million Trickle Out of Bitcoin ETFs

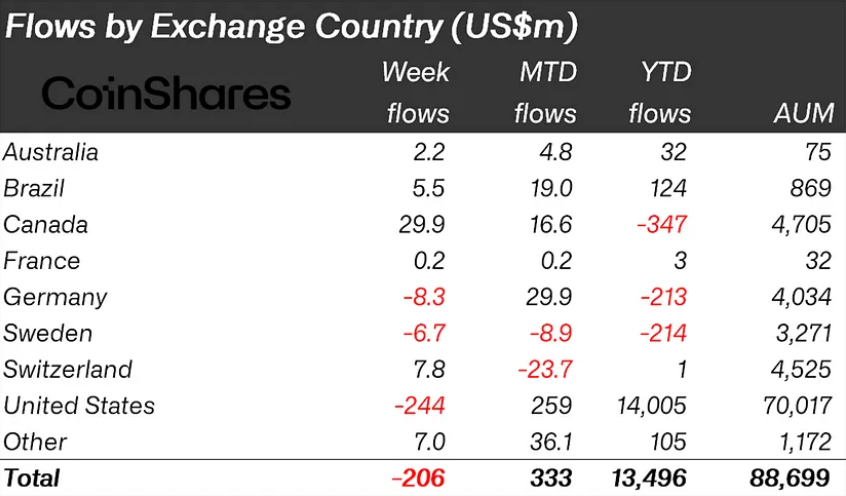
In the United States, sentiment remains predominantly negative, with ETFs experiencing outflows of $ 244 jutaEstablished ETFs have dipukul hardest, while newly issued ETFs continue to attract capital, albeit at a slower pace compared to previous weeks. In contrast, Canada and Switzerland have seen inflows of $30 million and $8 million, respectively. Germany, however, reported minor outflows totaling $8 million.

Arus Keluar Crypto Bertahan untuk Minggu Kedua Di Tengah Kekhawatiran Suku Bunga
Gambar melalui CoinShares

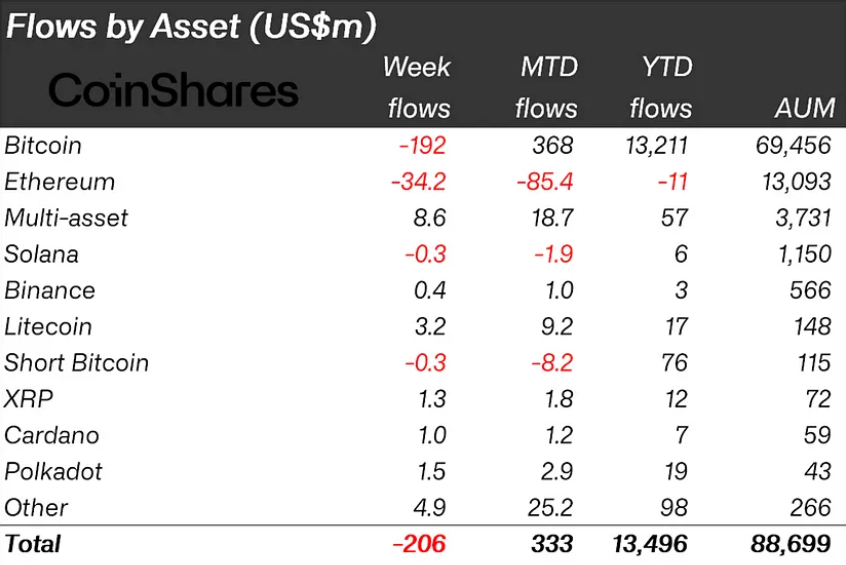
Bitcoin, mata uang kripto terkemukajuga telah melihat outflows, sebesar $192 juta. Surprisingly, this has not led to a significant increase in short-Bitcoin positions, with only a $0.3 million outflow from such positions. Ethereum, on the other hand, has continued its six-week streak of outflows, berjumlah $34 juta. 

There has been renewed interest in the altcoin sector, with inflows of $9 million last week. Litecoin dan Rantai have seen particularly significant inflows, with $3.2 million and $1.7 million, respectively.

Arus Keluar Crypto Bertahan untuk Minggu Kedua Di Tengah Kekhawatiran Suku Bunga
Gambar melalui CoinShares

Blockchain equities have faced pressure as well, marking their 11th consecutive week of outflows totaling $9 million. Concerns regarding the impact of the upcoming halving event on mining companies have contributed to investor apprehension.

Standard Chartered Maintains $150,000 Bitcoin Price Ramalan

Despite these challenges, Geoff Kendrick, head of digital assets research at Standard Chartered, remains optimistic about Bitcoin's prospects. He reaffirms the bank ambitious price target of $150,000 for Bitcoin by year-end, citing the influx of capital into U.S. Bitcoin ETFs as a kunci faktor. 

U.S. Bitcoin ETFs have attracted approximately $12 billion in net inflows since their inception in early 2024. Speaking to BNN Bloomberg, Kendrick said:

“The ETF inflows in the U.S. have really dominated the demand-supply metrics so far in 2024. This is significant in terms of the ETFs’ performance to date.”

This report highlights the intricate relationship between investor sentiment, regulatory expectations, and market dynamics in the ever-evolving landscape of cryptocurrency investments.

Saat memperdagangkan pasar kripto, hal itu tidak harus terjadi "kena atau tidak." Lindungi portofolio Anda dengan perdagangan yang benar-benar memberikan hasil, seperti premi kami sinyal crypto di Telegram.


Tertarik mempelajari cara berdagang kripto harian? Dapatkan semua informasi yang Anda butuhkan di sini

Decentraland (MANAUSD) Terbalik karena Harga Menghindari Titik Terendah Baru

Market Analysis – Prices Avoid New Lows

MANAUSD experienced a reversal as price action failed to register a new lower low. This indicates a potential shift in market sentiment as buyers are eager to take control.

Level Kunci MANAUSD

Tingkat Permintaan: $0.4250, $0.3270
Tingkat Pasokan: $0.5680, $0.7900

Decentraland (MANAUSD) Terbalik karena Harga Menghindari Titik Terendah BaruMANAUSD experienced a significant drop in mid-April 2024, causing the price to slightly breach the $0.4250 demand level and taking out existing liquidity below. Following the liquidity being taken, the price formed a failed low, indicating a decrease in selling pressure, which could potentially lead to a rise in price.

The 4-hour timeframe supports a bullish bias as it broke the structure upwards. The 4-hour Moving Average also aligns with the bullish bias, with the current price trading above it. Additionally, the daily Relative Strength Index shows the price below the 30.0 oversold region, indicating a potential buildup of bullish strength.

Decentraland (MANAUSD) Terbalik karena Harga Menghindari Titik Terendah Baru

Ekspektasi Pasar

The price is anticipated to increase quickly as liquidity below the $0.4250 level is being absorbed. It is expected that the supply level at $0.5680 will be surpassed as the price seeks to access liquidity situated above that level.

Anda dapat membeli Lucky Block di sini. Beli LBLOCK
Notecryptosignals.org  bukan penasihat keuangan. Lakukan riset sebelum menginvestasikan dana Anda dalam aset keuangan apa pun atau produk atau acara yang disajikan. Kami tidak bertanggung jawab atas hasil investasi Anda.

Compound (COMPUSD) Mengalami Pembalikan Bearish

Market Analysis – Price Strikes Major Resistance Zone

Compound (COMPUSD) has been embroiled in a protracted battle with resistance, particularly around the $74.460 mark, spanning nearly two years. Despite persistent efforts, the price has struggled to breach this significant barrier, with the earliest signs of resistance emerging back in May 2022.

Conversely, the demand threshold at $30.270 has acted as a formidable line of defense against further price declines. Each encounter with this level has triggered bullish reversals, resulting in a prolonged period of price oscillation confined within the range of $74.470 and $30.270.

Level Kunci Majemuk

Tingkat Permintaan: $106.000 $87.540, $74.460
Tingkat Suplai: $ 30.270, $ 26.000, $ 25.000

Compound (COMPUSD) Mengalami Pembalikan Bearish

March brought an unexpected twist to the narrative as market bulls capitalized on the favorable conditions presented by the bullish crypto season, driving the price above the resistance zone at $74.400. Yet, this bullish momentum proved fleeting, as the price encountered swift resistance around $97.540, leading to a rapid downturn.

Furthermore, a bullish parallel channel emerged, facilitating the invalidation of the long-term resistance zone at $74.460. However, the euphoria was short-lived as the price swiftly crashed below the parallel channel upon reaching the resistance zone of $97.550, signaling a potential shift toward bearish market sentiment.

Compound (COMPUSD) Mengalami Pembalikan Bearish

Ekspektasi Pasar

Adding to the bearish outlook, the price currently resides below the Moving Average (Periods 9 and 21), further affirming the prevailing bearishness in the market and sending cautious crypto signals. Analysts anticipate a continuation of the downward trajectory, with the price expected to decline further towards the previous low on the daily chart at $43.000.

Anda dapat membeli Lucky Block di sini. Beli LBLOCK
Notecryptosignals.org  bukan penasihat keuangan. Lakukan riset sebelum menginvestasikan dana Anda dalam aset keuangan apa pun atau produk atau acara yang disajikan. Kami tidak bertanggung jawab atas hasil investasi Anda.

Prediksi Harga Perdagangan Dash 2 untuk Hari Ini, 23 April: Harga D2TUSD Menemukan Resistensi di Tingkat Pasokan $0.00380

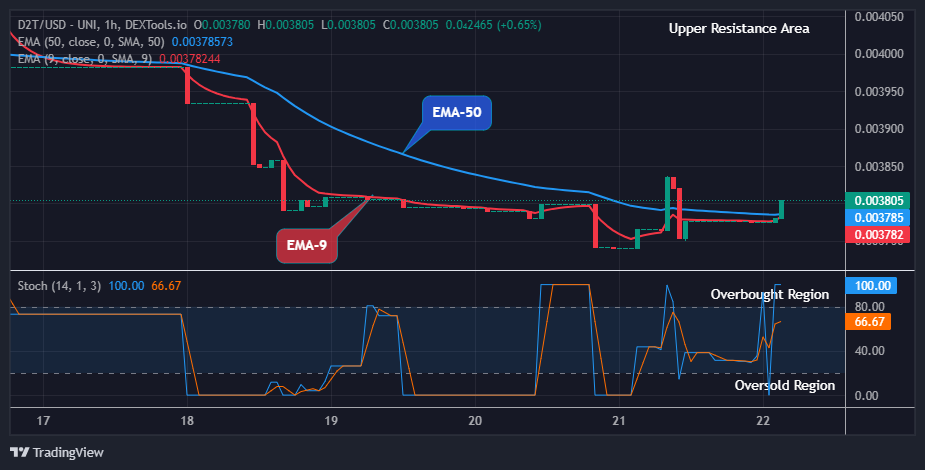
Dash 2 Trade Price Forecast: D2TUSD Price Finds Resistance at $0.00380 Supply Level (April 23)
Ada kesempatan untuk membeli D2TUSD pair as the price now finds resistance at the $0.00380 supply level while climbing the bullish ladder and going up at the moment. However, the price will move higher above the current resistance level, if buyers should exert more force into the price action in the market, the $0.00505 high trend line might be retested soon which may expose the coin price further to a $0.01000 upper high trend line, resulting to a good entry time for coin buyers.

Tingkat Kunci:
Level resistance: $ 0.00500, $ 0.00600, $ 0.00700
Level dukungan: $ 0.00350, $ 0.00300, $ 0.00250

D2T (USD) Tren Jangka Panjang: Bullish (Grafik 4 Jam)
D2TUSD is in a bullish trend market in its long-term view. The bulls are about to take over and push us higher. There are multiple possible targets at this point, but the pair looks quite bullish here as we can see the coin price trading above the EMA-50.
Prediksi Harga Perdagangan Dash 2 untuk Hari Ini, 23 April: Harga D2TUSD Menemukan Resistensi di Tingkat Pasokan $0.00380
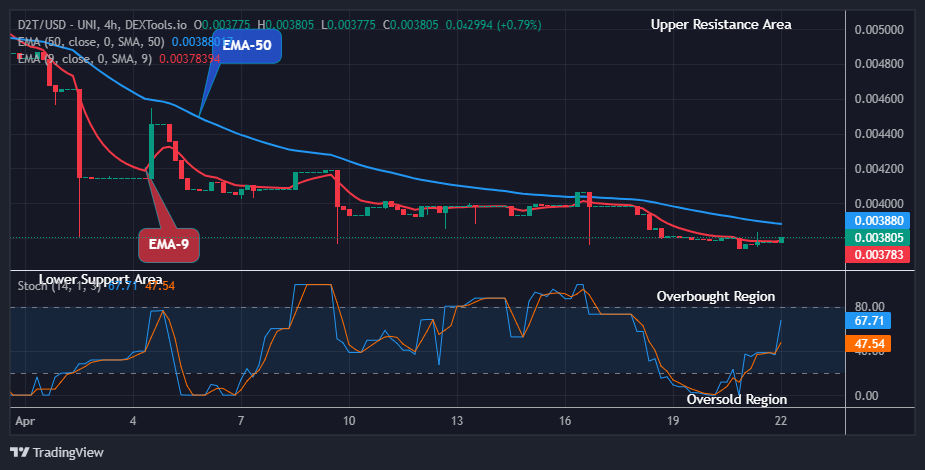
The bulls’ pressure on the cryptocurrency to the $0.00376 resistance level in the previous action has allowed it to retain its upward growth.

An increase to a $0.00380 high level above the EMA-9 approaching the overhead resistance as the 4-hourly chart opens today indicates that the traders are actively buying at this level.

This current trend will enable the price of Dasbor 2 Perdagangan to remain on the upside and rise or break out to the upside. This will enable buyers to hold a firm grip over the asset.

Furthermore, the market is pointing up on the daily stochastic; this will quicken the emergence of more buyers to move the price of D2TUSD up to a significant level on the upside which might hit the $0.01000 supply trend mark, thus bringing a positive sentiment among the coin traders and registering a buy signal for the coin traders as the market remain strongly bullish soon in its higher time frame.

D2T (USD) Tren Jangka Menengah: Bullish (Grafik 1 Jam)
Dasbor 2 Perdagangan market also trades in a bullish trend market in the medium-term outlook. This is due to the high impact of the long-term traders on the price flow.
Prediksi Harga Perdagangan Dash 2 untuk Hari Ini, 23 April: Harga D2TUSD Menemukan Resistensi di Tingkat Pasokan $0.00380
Tekanan bullish yang berkelanjutan ke level tertinggi $0.00377 pada aksi sebelumnya telah menyebabkan tertinggi koin baru-baru ini.

Earlier today, after completing the sideway moves, the D2TUSD buyers successfully pushed the coin price up to a $0.00380 supply level above the two moving averages shortly after the 1-hourly chart opened.

The current price at the $0.00380 resistance level suggests the returns of the buy traders in the market. The market participants are responding to this pattern, and its breakout should offer a good buy entry opportunity.

Oleh karena itu, pasangan yang menunjuk ke atas pada stochastic harian berarti bahwa tekanan beli dapat berlanjut, dan menunjukkan kemungkinan pemulihan level pasokan $0.01000 dalam beberapa hari mendatang dalam kerangka waktu jangka menengah.

Two-Factor Authentication (2FA), our newest feature, will increase the security of your Dash 2 Trade account!


Ingin koin yang memiliki potensi pengembalian besar? Koin itu adalah Dash 2 Trade. Beli D2T sekarang.

Prediksi Harga Bitcoin: BTC/USD Melampaui $66,000: Apakah Ini Saatnya untuk Naik?

Prediksi Harga Bitcoin (BTC) - 22 April

Melihat grafik harian, prediksi harga Bitcoin (BTC) menunjukkan tanda-tanda positif, dan kemungkinan akan berakselerasi lebih tinggi dalam waktu dekat.

BTC / USD Tren Jangka Panjang: Bullish (Grafik Harian)

Level kunci:

Level Perlawanan: $ 80,000, $ 82,000, $ 84,000

Level Dukungan: $ 52,000, $ 50,000, $ 48,000

Prediksi Harga Bitcoin: BTC/USD Diperdagangkan Di Atas $66,000; Saatnya Melanjutkan Lebih Tinggi?
BTCUSD - Grafik Harian

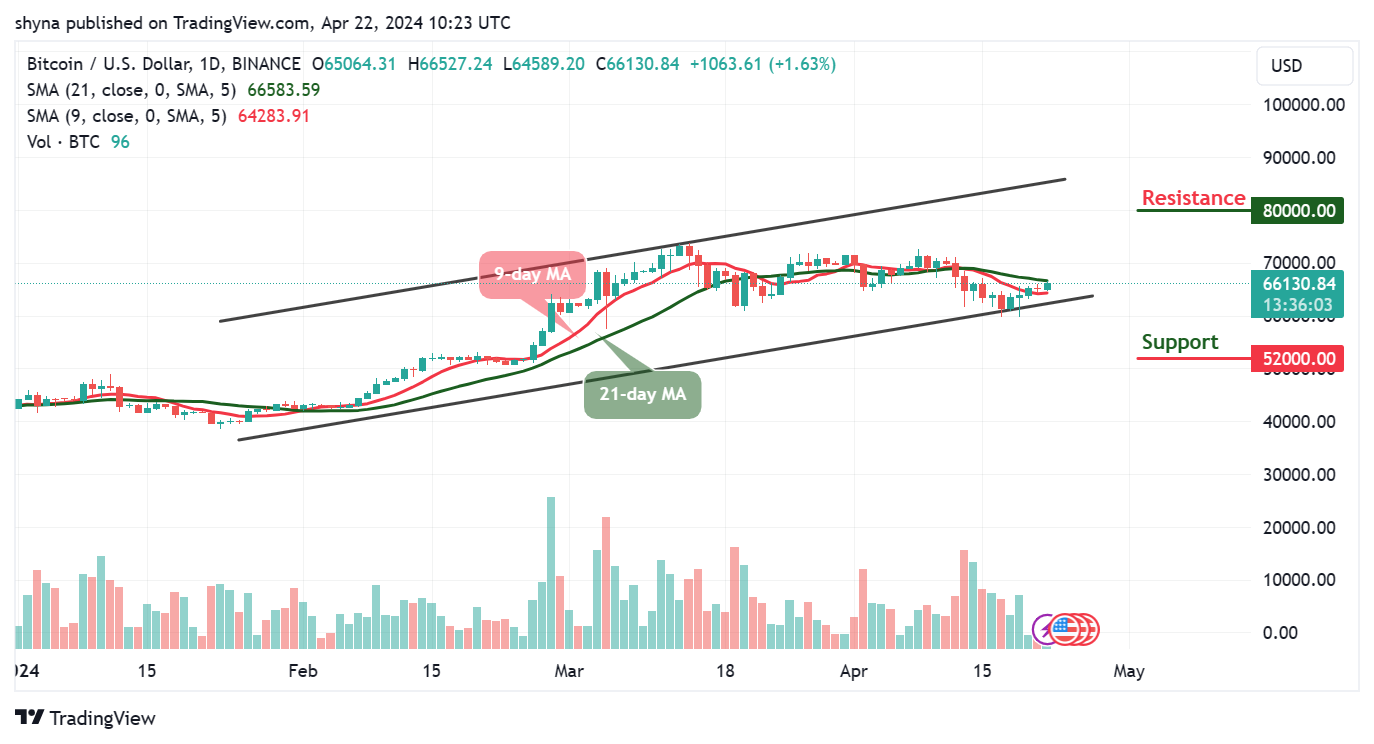
Menurut grafik harian, BTC / USD menembus $66,000 saat harga tertinggi minggu baru tiba. Koin raja terlihat diperdagangkan dengan baik dalam rata-rata pergerakan 9 hari dan 21 hari di $66,130. Selain itu, harga Bitcoin hampir mencapai harga tertinggi harian baru di atas harga tertinggi sebelumnya di $66,000, yang cukup luar biasa.

Prediksi Harga Bitcoin: Ke Mana Arah Harga Bitcoin Selanjutnya?

Saat ini, Harga Bitcoin diperdagangkan dengan nyaman menuju batas atas saluran karena harga membentuk sinyal bullish baru. Sementara itu, bisa dikatakan bahwa prospek jangka panjang menguntungkan para pembeli, sehingga penutupan harian menghasilkan beberapa candle bullish dengan fokus sekarang tertuju pada resistensi harian masing-masing di $80,000, $82,000, dan $84,000.

Sementara itu, penurunan apa pun dari level saat ini dapat menyebabkan penurunan support kritis di bawah batas bawah saluran. Namun, jika BTC turun dan menyentuh titik terendah dukungan $60,000, maka koin raja dapat mengandalkan level dukungan jangka panjang di $52,000, $50,000, dan $48,000. Selain itu, rata-rata pergerakan 9 hari berada di bawah rata-rata pergerakan 21 hari, menunjukkan sinyal bearish.

Tren Jangka Menengah BTC / USD: Rentang (Grafik 4H)

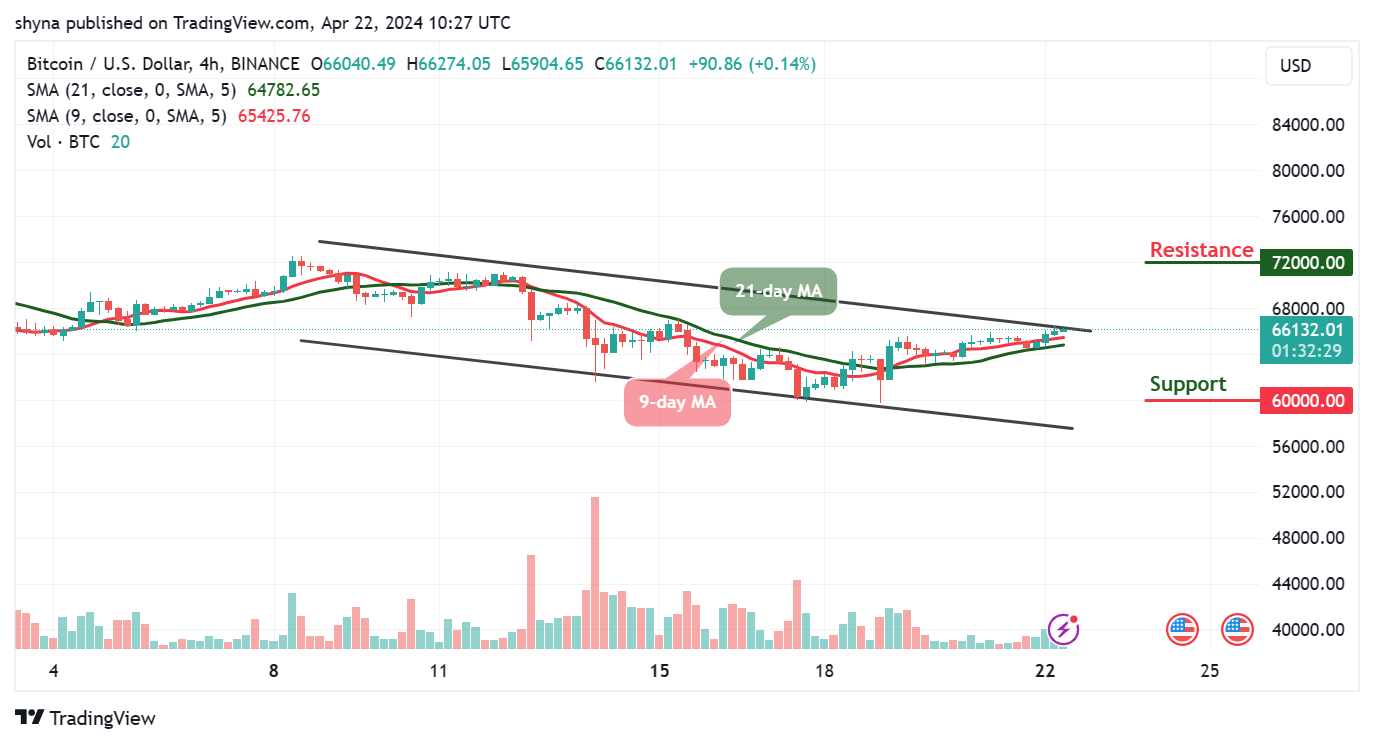
Menurut grafik 4 jam, Bitcoin harga terlihat diperdagangkan di atas rata-rata pergerakan 9 hari dan 21 hari di $66,132. Namun, pergerakan harga hari ini bisa menjadi mengesankan jika naik di atas level resistensi $70,000 yang telah lama ditunggu-tunggu. Selain itu, BTC/USD sekarang mempertahankan kenaikannya karena MA 9 hari terus melayang di atas MA 21 hari.

Prediksi Harga Bitcoin: BTC/USD Diperdagangkan Di Atas $66,000; Saatnya Melanjutkan Lebih Tinggi?
BTCUSD - Grafik 4 Jam

Sebaliknya, BTC mungkin mengambil pergerakan ke bawah jika kenaikan gagal mendorong harga lebih tinggi, dan koin mungkin menembus di bawah rata-rata pergerakan 9 hari dan 21 hari, yang dapat mencapai dukungan lain di $60,000 dan di bawahnya. Namun demikian, jika kenaikan menemukan level resistensi yang layak di sekitar $68,000, koin dapat melanjutkan pergerakan bullish dengan melintasi di atas saluran untuk mencapai level resistensi $72,000 ke atas.

Anda dapat membeli Bitcoin di sini. Beli BTC

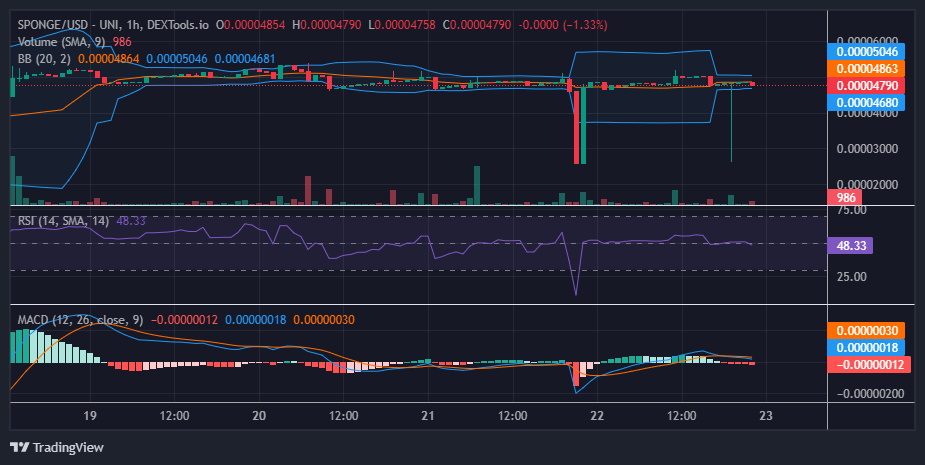
$SPONGE (SPONGE/USD): Putar Tekan? Bollinger Bands Mengencang Setelah Uji Support

Dalam analisis kami sebelumnya tentang SPONS/USD, kami mengamati pasar berkonsolidasi sideways di dekat tingkat harga $0.00005. Level ini tampaknya merupakan titik keseimbangan sementara, dengan kenaikan dan penurunan menemukan keseimbangan sementara. Swing high dan low terkonsentrasi di sekitar harga ini. Namun, perlu dicatat bahwa tekanan bearish menguji level-level yang lebih rendah di sesi sebelumnya dan saat ini. Meskipun hal ini dapat menunjukkan peningkatan momentum bearish, hal ini juga menyoroti kelanjutan pertahanan pembeli di sekitar level dukungan $0.00005.

Dinamika Pasar Utama:

  • Tingkat resistensi: $0.0010, $0.0011, dan $0.0012.
  • Tingkat Dukungan: $ 0.000035, $ 0.000030, dan $ 0.000025.

$SPONGE (SPONGE/USD): Putar Tekan? Bollinger Bands Mengencang Setelah Uji Support

Menggali Analisis Teknis untuk $SPONGE (SPONGE/USD):

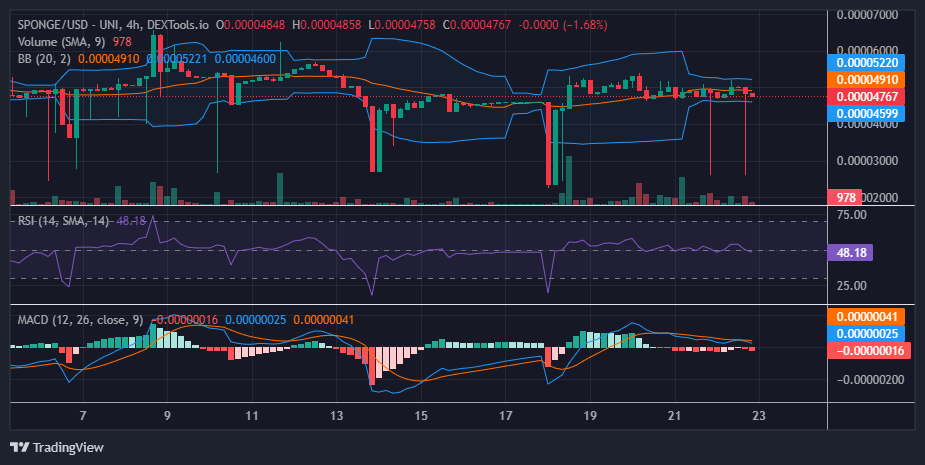
Kontraksi tajam Bollinger Bands baru-baru ini menunjukkan penurunan volatilitas. Awalnya, baik pembeli maupun penjual gagal memanfaatkan volatilitas yang lebih tinggi, sehingga mengakibatkan aksi harga sideways. Kebuntuan ini kemungkinan besar berkontribusi pada penurunan volatilitas.

Semacam ini sinyal kripto, yaitu kontraksi ini, sering kali mendahului penembusan (harga bergerak secara meyakinkan di atas pita atas) atau terobosan (harga bergerak secara tegas di bawah pita bawah) dari rentang perdagangan terkini. Indikator teknis saat ini menandakan keragu-raguan dan konsolidasi pasar.

Relative Strength Index (RSI) berada di dekat titik tengah, dan garis Moving Average Convergence Divergence (MACD) diperdagangkan sideways di atas nol, menunjukkan netralitas. Meskipun harga saat ini berada sedikit di bawah rata-rata pergerakan 20 hari, berpotensi mengisyaratkan terjadinya breakdown, dua penolakan harga baru-baru ini di sisi bawah menunjukkan berlanjutnya kekuatan bullish di sekitar zona harga ini.

$SPONGE (SPONGE/USD): Putar Tekan? Bollinger Bands Mengencang Setelah Uji Support

Wawasan dari Perspektif 1 Jam:

Pergerakan bearish kemarin di SPONGE/USD berlangsung dalam dua sesi satu jam. Namun hari ini, upaya penjual untuk menekan lebih rendah dapat diatasi dalam satu sesi satu jam. Hal ini berpotensi mengindikasikan penolakan yang lebih cepat oleh pembeli dibandingkan kemarin, menunjukkan kemungkinan peningkatan momentum bullish. Meskipun ini merupakan tanda positif bagi kenaikan, hal ini belum tentu merupakan konfirmasi akan terjadinya penembusan harga dalam waktu dekat. Diperlukan observasi dan konfirmasi lebih lanjut dari indikator teknis lainnya.

Beli SPONS/USD!

Investasikan dalam koin meme terpanas dan terbaik. Beli Spons ($SPONS) hari ini!

Perdagangan Dogecoin (DOGE/USD) Berada di Basis, Menahan Dorongan Positif

Prediksi Harga Dogecoin – 22 April

Upaya dorongan bertahap telah dimulai oleh kenaikan melawan penurunan dengan cara menukar aksi harga antara pasar Dogecoin versus jalur perdagangan Dolar AS, sebagai harga ekonomi kripto berada pada pola formasi dasar, menahan dorongan positif.

Berdasarkan analisa teknikal, garis tren Bollinger Band yang lebih rendah akan menjadi alat utama dalam menentukan apakah harga terus menurun atau melanjutkan tren naiknya. Zona perdagangan resistensi dari indikator Bollinger tengah dapat dipertahankan untuk memberikan dimulainya kembali penolakan yang dapat menghasilkan entri shorting instan berdasarkan prinsip mengejar ketinggalan secara instan sementara asumsi tersebut cenderung berlaku.

Pasar DOGE/USD
Tingkat Kunci:
Level resistance: $ 0.18, $ 0.22, $ 0.26
Level dukungan: $ 0.12, $ 0.10, $ 0.08

DOGE / USD - Grafik Harian
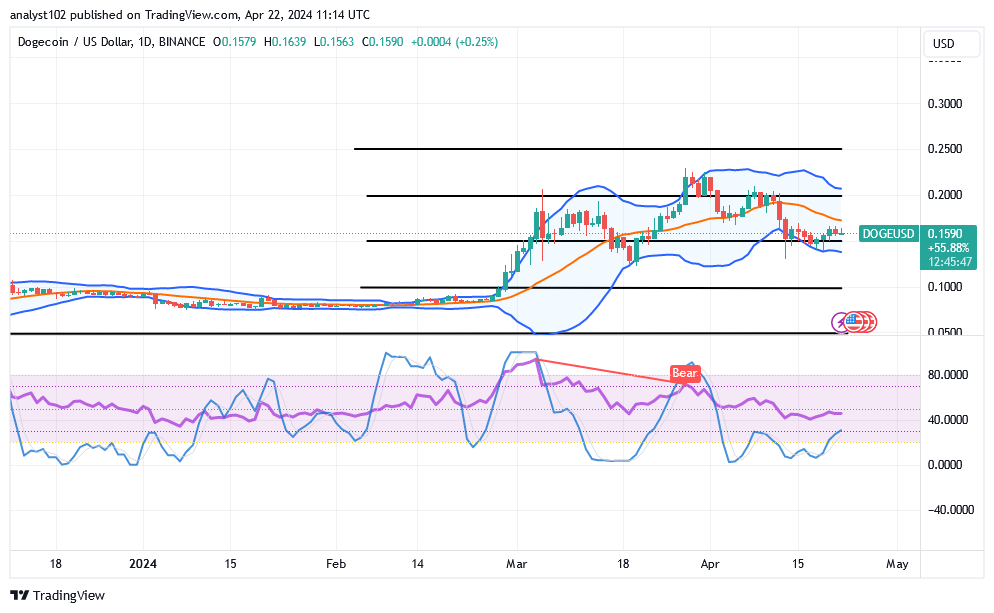
Harian DOGE/USD menunjukkan bahwa pasar kripto berada pada gaya penciptaan dasar sekitar $0.15, menahan dorongan positif.

Varian candlestick telah terbentuk dengan menghasilkan titik terendah di dekat sisi sinyal beli dari Bollinger Band bawah. Osilator stokastik tetap berada di posisi lebih rendah untuk menggambarkan bahwa pasar sedang mencoba mengumpulkan katalis.
DOGE/USD, DOGE/BTC, Dogecoin, Analisis Teknis

Jika penurunan yang menakutkan muncul terhadap Bollinger Band yang lebih rendah, apakah pembeli pasar DOGE/USD tidak akan pulih dengan cepat?

Produksi candlestick bearish yang tiba-tiba terhadap indikator Bollinger Band yang lebih rendah tanpa gerakan pembalikan yang cepat dapat menyebabkan posisi terendah yang lebih rendah sebelum bull bersiap untuk melonjak, mengingat bahwa Perdagangan DOGE/USD saat ini dalam formasi dasar di sekitar nilai $0.15, menahan dorongan positif.

Mengingat situasi saat ini, penggerak posisi buy mungkin akan menang di garis tengah dan bawah Bollinger Bands. Namun, mereka harus membuat keputusan jangka panjang mengenai urutan posisi mereka.

Penjual cenderung tidak memiliki entri yang layak karena sebagian besar indikator ditempatkan pada area yang lebih rendah dan tidak mendukung banyak kecepatan ke sisi selatan. Jika memang demikian yang terjadi, maka setiap pergerakan ke zona Bollinger Band bawah dapat mengalami pemantulan yang luar biasa, sehingga menjadikannya tidak valid dalam prosesnya.
DOGE/USD, DOGE/BTC, Dogecoin, Analisis Teknis
Analisis Harga DOGE/BTC
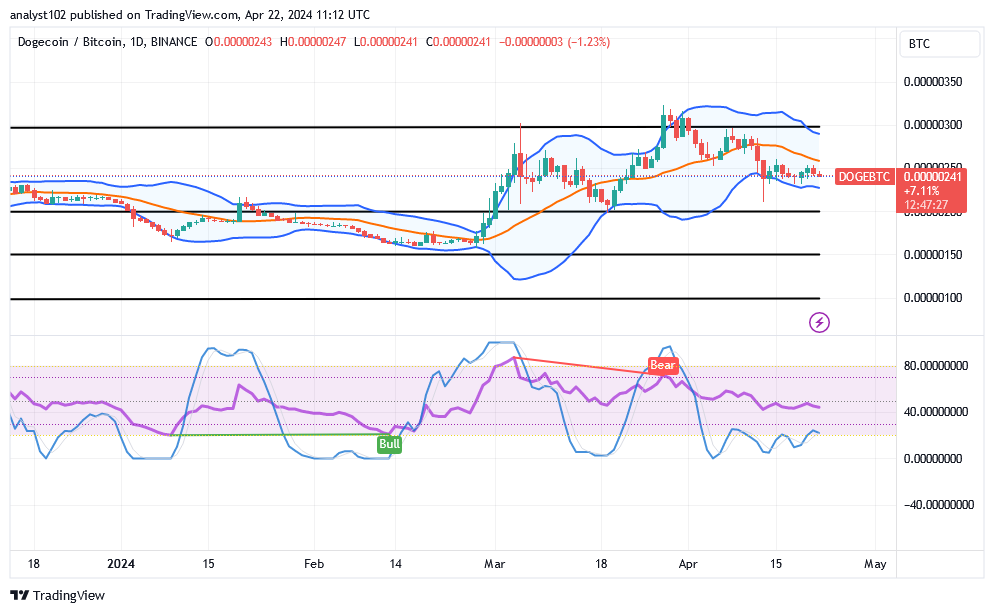
Sebaliknya, Perdagangan Dogecoin berada pada posisi yang menentang penilaian Bitcoin, memegang dorongan positif.

Osilator stokastik terus berosilasi pada sumbu bawah yang signifikan, menunjukkan bahwa mata uang kripto dasar berusaha memposisikan dirinya untuk mengungguli pesaingnya. Garis tren Bollinger Band diposisikan di zona yang lebih tinggi, menandakan bahwa harga ditahan pada pergerakan kisaran pada analisis ini.

Catatan: Cryptosignals.org bukan penasihat keuangan. Lakukan penelitian Anda sebelum menginvestasikan dana Anda dalam aset keuangan atau produk atau acara yang disajikan. Kami tidak bertanggung jawab atas hasil investasi Anda.


Anda dapat membeli Lucky Block di sini. Beli LBLOCK