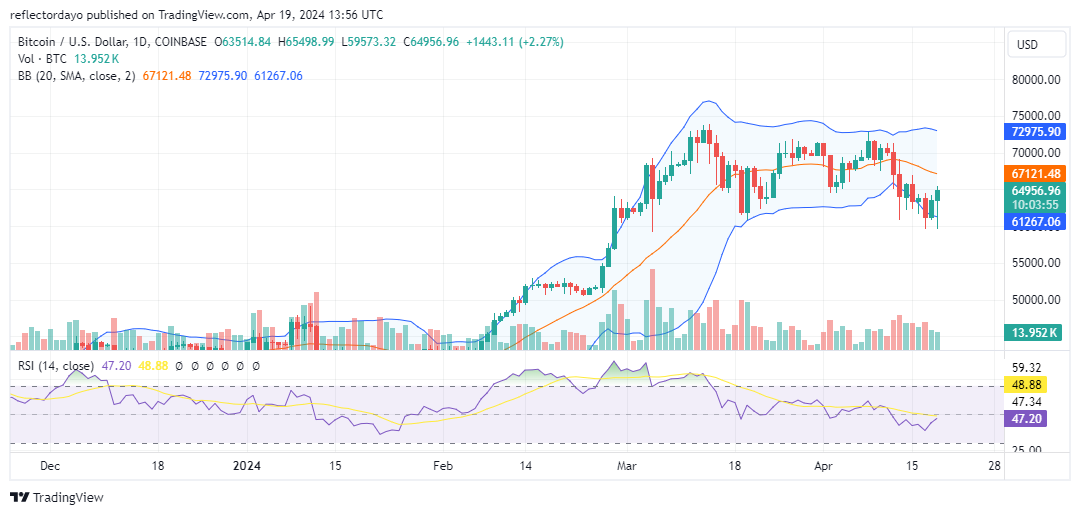
In the first half of March, the Bitcoin market surged into the price range of $60,000 to $75,000. Subsequently, as time progressed, the notable volatility subsided. Initially, it appeared that bullish momentum was establishing stronger support around the $65,000 level, exerting pressure on bearish positions at $75,000. However, by early April, increasing volatility favored bears, who occupied the $72,000 price level, while bulls faltered in maintaining the $65,000 level.
Consequently, they retreated to the support zone around the $60,000 price threshold. Presently, the market shows signs of rebounding from this level.
נתוני שוק הביטקוין
BTC/USD Price Now: $64,798
BTC/USD Market Cap: $1.2 trillion
BTC/USD Circulating Supply: 19.7 million
BTC/USD Total Supply: 19.7 million
BTC/USD CoinMarketCap Ranking: #1
רמות מפתח
התנגדות: 65,000 דולר, 70,000 דולר ו -75,000 דולר.
תמיכה: 60,000 דולר, 55,000 דולר ו -50,000 דולר.
The Bitcoin Market Through the Lens of Indicators
של היום ביטקוין market is exhibiting signs of strength, as evident from the analysis of today’s trading activities represented by the candlestick chart. While today’s trading sessions have been marked by considerable volatility, the emergence of a hammer formation suggests that bullish sentiment is gaining momentum, indicating a potential shift in market control.
Currently, bullish forces are exerting pressure on the $65,000 resistance level, despite lingering bearish sentiment at this threshold. Breaking through this resistance level is crucial for the market, as it would negate the development of a bearish trend. This is particularly significant given the bearish performance observed earlier in the week, as indicated by the Bollinger Bands beginning to trend downward. However, surpassing this threshold would effectively nullify the emergence of an impending bearish trend.
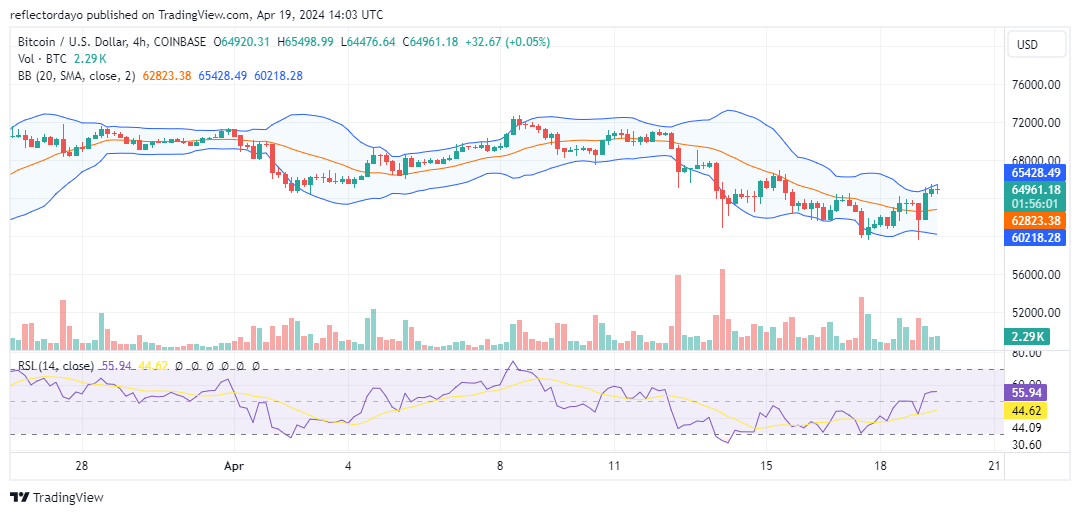
BTC/USD Price Prediction: 4-Hour Chart Analysis
The Bitcoin market has reached a stalemate as both buyers and sellers grapple for control at the $65,000 price level. Despite this אות קריפטו, volatility remains notably high, with the price fluctuating within close proximity to this threshold. A closer examination of the current 4-hour session reveals minimal support and resistance around the $65,000 mark, indicating a state of indecision among traders. This lack of consensus has left the market at a crossroads, with neither side able to push the price significantly below support or above resistance levels. It appears traders are awaiting a catalyst, possibly in the form of news, to prompt decisive action in the market.
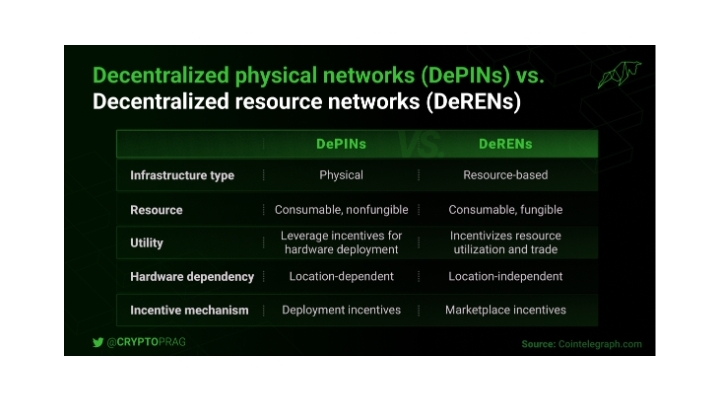
As the crypto realm expands, an often-overlooked domain is DePin, merging technology’s structural support for AI coins. Exploring DePin’s interplay with AI reveals a world of opportunity and innovation.
הפוטנציאל
In 2023, Messari introduced Decentralized Physical Infrastructure Networks (DePin), envisioning a landscape where blockchain transforms real-world infrastructure deployment and management. Token incentives drive construction and maintenance, fostering a market predicted to reach $3.5 trillion by 2028.
Recent strides in DePin affirm Messari’s foresight, with projects advancing toward this lofty valuation.
הגדרת הסצנה
DePin revolutionizes infrastructure conception, construction, and interaction, hailed as the “next blockchain frontier.” It stands as a beacon of innovation in today’s crypto landscape.
But what sets it apart? Why does DePin captivate the brightest minds in crypto?
The answer lies in its dual nature: קודם כל, DePin harmonizes the realms of crypto and AI, offering a tangible application of both fields.
It embodies a real-world crypto use case, reshaping infrastructure development and fostering efficiency, accessibility, and innovation.
At its core, DePin employs blockchain to crowdsource infrastructure projects, tapping into collective intelligence, skills, and resources. Tokenization incentivizes and rewards contributions, fostering community engagement and investment.
Present Status of DePin
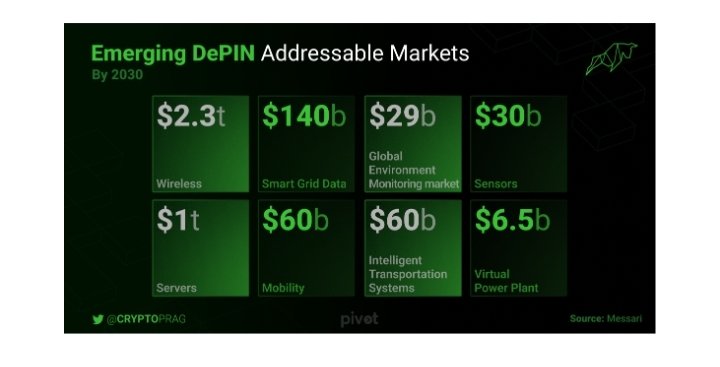
DePin’s current landscape spans over 650 projects across six core sectors: critical infrastructure computing, AI, wireless, sensors, energy, and services. Together, these initiatives boast a market capitalization surpassing $22 billion, generating around $15 million in on-chain annual recurring revenue (ARR).
Notably, the DePin network has witnessed a surge of over 600,000 nodes, indicative of significant growth trajectories.
Anticipated drivers of growth include market expansion to $3.5 trillion by 2028, escalating demand for high-quality streaming and online content, increased necessity for valuable datasets spanning various industries, and a growing need for online data storage solutions and software-based DePin networks.
Moreover, the supply side is primed for expansion, with a rise in nodes and the emergence of decentralized marketplaces connecting GPU owners with rendering power-seeking creators.
Notably, DePin networks derive revenue from tangible utility rather than speculative investments, ensuring transparent and real-time payment mechanisms traceable on the blockchain. Founders in this domain prioritize the development of open-source hardware and software solutions to accelerate the growth of valuable on-chain products and services, while diverse use cases continue to emerge within the Web3 ecosystem.
Exciting Projects on DePin
Now that you’re acquainted with DePin’s essence and operational framework, let’s delve into some of the most captivating ventures within the DePin sphere.
אתיר
Aethir crafts a distributed GPU-driven computational framework tailored for versatile enterprise applications.
It establishes a bridge between businesses harboring dormant GPU capabilities and sectors craving computational prowess, spanning realms like AI, virtual computing, cloud gaming, and cryptocurrency mining.
1. This approach optimizes resource allocation while providing a budget-friendly resolution for high-demand sectors, obviating the necessity for hardware investments.
2. At the core of Aethir’s ecosystem lies the $ATH token, serving as the conduit for transactions within this dynamic marketplace.
3. On the demand side, entities procure $ATH tokens to lease computational muscle, while suppliers and investors reap $ATH tokens as incentives.
4. Aethir’s dedication to reinvesting profits into acquiring $ATH fortifies its worth, positioning it as a sturdy investment choice.
Io.net
io.net offers entry to distributed GPU clusters tailored for machine learning, tackling challenges such as constrained accessibility, steep expenses, and subpar hardware selections found in centralized platforms.
1. Similar to Aethir, io.net consolidates dormant GPUs into a DePIN, furnishing substantial computational prowess for industries reliant on intensive computing tasks.
2. io.net elevates its portfolio with three distinct offerings: io.net Cloud for expandable GPU clusters, io.net Worker for computational oversight, and io.net Explorer for network analytics, furnishing a comprehensive solution tailored for both users and providers of GPU resources.
GamerHash
Introduced in 2017, GamerHash has surged by an impressive 2600% year to date, boasting a user base of 760K. Originally geared towards enabling gamers to accrue earnings via cryptocurrency mining, the platform has evolved significantly since its inception.
1. Expanding its horizons, it is now venturing into technical integrations and unveiling a fresh AI application. Its goal: is to furnish GPU capabilities for AI, 3D rendering, LLM models, and data analysis, all under the innovative DePin initiative.
2. Teaming up with AI L1 endeavors and top players in the DePin market, GamerHash is poised to emerge as a formidable B2C power supplier amid the prevailing GPU scarcity.
3. Significant achievements encompass surpassing 2 million transactions to gamers’ wallets, doling out rewards exceeding $15 million, and boasting active users whose hardware value eclipses $20 million.
4. The AI product evolution unfolds systematically, spanning from an initial proof-of-concept for GPU power contribution to the incorporation of gaming GPUs into computing marketplaces for generative AI model tasks. This strategic approach not only tackles the GPU shortage but also holds promise for resolving a significant industry challenge.
5. GamerHash’s proprietary token, GamerCoin ($GHX), boasts a total supply of 808 million tokens, with 80% already in circulation. Currently operational on both BSC and ETH networks, the platform has ambitious plans to extend its presence to Solana in the near future.
סיכום
In the convergence of DePin, where crypto and AI unite, lies a blueprint for a future where technology transcends boundaries, reshaping the physical world around us. As DePin continues to evolve, it serves as a testament to the boundless potential of blockchain technology and the collaborative spirit driving innovation forward.
Embracing this paradigm shift, we embark on a journey toward a more interconnected, efficient, and equitable world, propelled by the synergies of crypto, AI, and decentralized infrastructure.
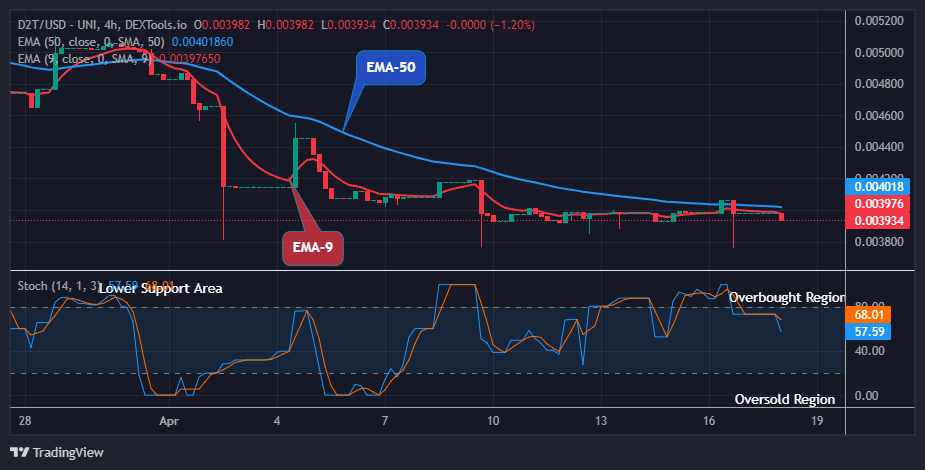
Dash 2 Trade Price Forecast: D2TUSD Will Jump Soon, Watch out for BUY! (April 19) D2TUSD will jump soon as the selling pressure is moving towards the exhaustion stage. The coin could be ready for an upward surge soon if adequate preparation is done by the bulls by exchanging hands with the sell traders at the current support level. Therefore, if the buy investors could prove harder and put a hold on the $0.00393 current support level, the bulls may drive the price action to hit the previous high of $0.00510 resistance value, which might extend further to a $0.01000 upper resistance level, registering a high potential for the coin buyers.
רמות מפתח: רמות ההתנגדות: $ 0.00500, $ 0.00600, $ 0.00700 רמות תמיכה: $ 0.00300, $ 0.00200, $ 0.00100
D2T (USD) מגמה ארוכת טווח: דובי (4H) אל האני דאש 2 טרייד price is trading below the supply levels in its higher time frame. The sustained bearish pressure in the past few hours has made the cryptocurrency price remain below the supply trend levels at its recent low. This will soon be invalidated as the trend is now approaching the oversold region of the crypto market. בינתיים, המחיר הנוכחי של D2TUSD at a $0.00393 low value below the supply trend lines has not stale the market condition of the coin. Further, investors may seize the opportunity now buy the coin at a lower price and look for more gains ahead.
Meanwhile, the price of Dash 2 Trade could reverse soon as the coin price is now moving towards the oversold region. This will enable the coin buyers to resume afterward and push the price upwards, so we can now grow in confidence that a potential buy is coming near.
If this is attained by the bulls, the price jump could hit the $0.01000 resistance level in the coming days, indicating a strong supply zone for a potential BUY in its higher time frame.
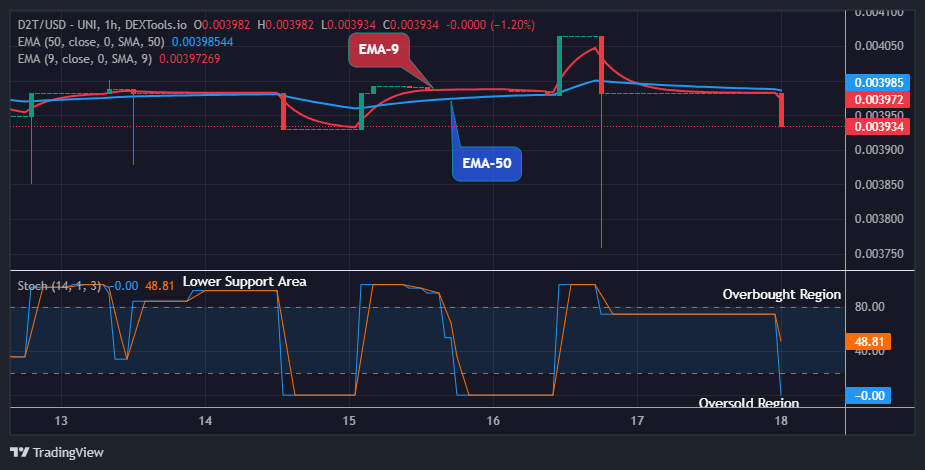
D2T (USD) מגמה לטווח בינוני: דובי (1H) המטבע נסחר גם בשוק מגמה דובי בתחזית לטווח הבינוני. זאת בשל ההשפעה הגבוהה של הסוחרים לטווח קצר על תזרים המחירים. The persistent move by the sell traders in the previous action has dropped the coin price below the supply levels in recent times.
After a series of sideway moves, the bears drop the D2TUSD price down to a low of $0.00393 trend line below the moving averages shortly after the 1-hour chart opens today.
Further, an increase in the buying pressure might reverse the trend and push the price of דאש 2 טרייד up to retest the previous high of $0.00406 mark, obtaining a higher footing to rise higher.
בינתיים, חסרונות נוספים אינם סבירים כמו מחיר השוק של D2TUSD has reached the oversold region. The coin will resume an uptrend soon and this may lead the price action to reach the $0.01000 upper high level in the upcoming days.
Possibly the most useful technique for enhancing your trading success is backtesting.
⚒️ Backtesting is perhaps the most valuable tool to improve your trading performance.
In many ways it’s a gamechanger, allowing you to see how your strategies will fair in real-world market conditions.
בדו"ח שנערך לאחרונה, אנליסטים של JPMorgan שופכים אור על ההשפעה הצפויה של אירוע חציית הביטקוין הקרוב. בעוד קהילת הקריפטו ממתינה בכיליון עיניים לאבן הדרך המשמעותית הזו, השאלה העומדת בראש כולם היא: איך זה ישפיע על המטבע הקריפטו הפופולרי ביותר בעולם?
חציית ביטקוין, המתרחשת בערך כל ארבע שנים, היא אירוע מכריע במערכת האקולוגית של מטבעות הקריפטו. במהלך אירוע זה, תגמול ההנפקה לכורי ביטקוין נחתך בחצי.
כורים מקבלים כיום 6.25 BTC לכל בלוק; לאחר החציה, הפרס הזה יקטן ל-3.125 BTC לכל בלוק.
כפי שדווח על ידי בלומברג, האנליסטים של ג'יי.פי מורגן טוענים כי המחיר הנוכחי של הביטקוין כבר תופס את החצייה הקרובה. בדוח שלהם, הם מצהירים, "אנחנו לא מצפים לעליית מחירי ביטקוין לאחר חצייה מכיוון שהוא כבר תומח". פרספקטיבה זו מאתגרת את התפיסה לפיה חצויות מובילות בהכרח לעליית מחירים.
🚨רק פנימה: JPMORGAN מצפה #Bitcoin מחיר להמשיך לטבול אחרי החצי!
הסיבות של JPMorgan לציפיות זהירות סביב חציית הביטקוין
לפי אנליסטים של JPMorgan, הגורמים התורמים לתחזית הזהירה לגבי העתיד הקרוב Bitcoin בחצי כוללות:
מצב קניית יתר מדאיג: למרות הירידות האחרונות, JPM חוששת מכך ביטקוין נשאר ב"תנאים של קניית יתר". הערכה זו מבוססת על ניתוח של עניין פתוח בחוזים עתידיים על ביטקוין.
מחיר מותאם לתנודתיות: המחיר מותאם התנודתיות של JPMorgan עבור ביטקוין עומד על 45,000 דולר. השוואת זאת למחיר השוק הנוכחי של 63,500 דולר מגלה כי הביטקוין נסחר בפרמיה, לפי האנליסטים.
עלות הפקה: האנליסטים מדגישים שמחיר הביטקוין עולה על עלות הייצור החזויה שלו לאחר חצייה. עם עלות צפויה של 42,000 דולר, המחיר הנוכחי של כ-63,500 דולר מעורר חששות.
מימון הון סיכון: למרות התחייה הרחבה יותר בשוק הקריפטו, מימון הון סיכון למטבעות קריפטוגרפיים היה פושר השנה. היעדר השקעה ניכרת זה עלול להפחית את צמיחת המחירים, לפי הדו"ח.
ביטקוין האשרט ואיחוד כורים
יתר על כן, החצייה צפויה להשפיע באופן משמעותי על כורי ביטקוין. ככל שתגמול ההנפקה יורד, חלק מהכורים עלולים למצוא את פעילותם לא רווחית. כתוצאה מכך, אנו יכולים לצפות לירידה משמעותית ב-hashrate - כוח המחשוב המוקדש לאבטחת הרשת.
עם זאת, ג'יי.פי מורגן מאמין שחברות כרייה בבורסה צפויות לצלוח את הסופה טוב יותר מאשר שחקנים קטנים יותר. כמו כן, צפוי איחוד בין הכורים, כאשר חברות גדולות יותר שולטות בנוף.
בתגובה לרווחיות מופחתת, חברות כרייה עשויות לחקור גיוון. אזורים בעלי עלויות אנרגיה נמוכות יותר, כמו אמריקה הלטינית או אפריקה, עשויים להפוך ליעדים אטרקטיביים. ייעוד מחדש של אסדות כרייה לא יעילות עבור ערך הצלה עשוי להיות גם על סדר היום של כורים מתקשים.
בעוד שחלק משערים שכורים יכולים לעבור לכריית מטבעות קריפטוגרפיים של ביטקוין, האנליסטים של ג'יי.פי מורגן דוחים את זה כ"מאוד לא סביר". האסדות המיוחדות הללו מותאמות לכריית ביטקוין, ויציאה למטבעות אלטקוינים קטנים יותר תניב רווח קטן ככל הנראה.
לסיכום, חציית הביטקוין אמורה להביא גם אתגרים וגם הזדמנויות. כאשר קהילת הקריפטו צופה מקרוב, תגובת השוק תקבע בסופו של דבר את גורלו של הזהב הדיגיטלי.
כאשר סוחרים בשוק הקריפטו, זה לא חייב להיות "בְּעָלְמָא." הגן על התיק שלך עם עסקאות שמניבות בפועל תוצאות, בדיוק כמו הפרמיה שלנו אותות קריפטו על מברק.
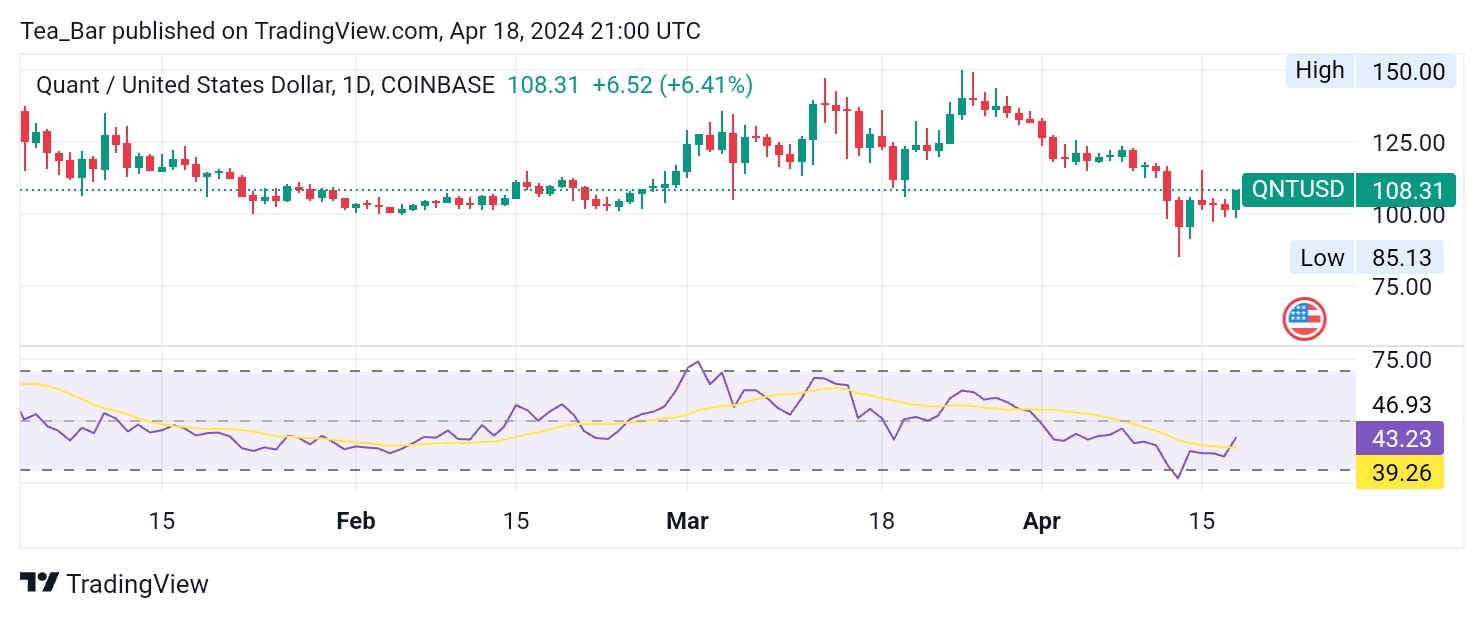
Quant (QNT) has rebounded impressively from its recent low of $85 just five days ago, currently trading at $108. The token has a market cap of $1,289,345,778 USD and a 24-hour trading volume of $18,415,618 USD.
Quant is up 4.58% in the last 24 hours and holds a CoinMarketCap ranking of #68. Strong demand and positive sentiment surround the project, fueled by its focus on blockchain interoperability and strategic שותפויות.
Whether QNT can sustain its bull run depends on broader market trends and future developments, including regulatory clarity and advancements in the Quant Network.
מגמה ארוכת טווח QNT/USD: שורית (תרשים יומי) רמות מפתח: רמות התנגדות: $ 110, $ 112, $ 114 רמות תמיכה: $ 105, $ 103, $ 100 כמו (QNT) has exhibited a strong rebound in the daily market, rising from a low of $85 to $108. This price movement is backed by the daily Relative Strength Index (RSI) reading of 43.23.
An RSI of 43.23 suggests the market is in a neutral zone, indicating potential for further movement to a bullish region. While the RSI is close to the oversold threshold, it provides space for future price growth without reaching the overbought range.
This technical indicator highlights a balanced market environment, where QNT can continue its upward trend. Overall, Quant’s market activity reflects sustained positive sentiment and potential for ongoing growth.
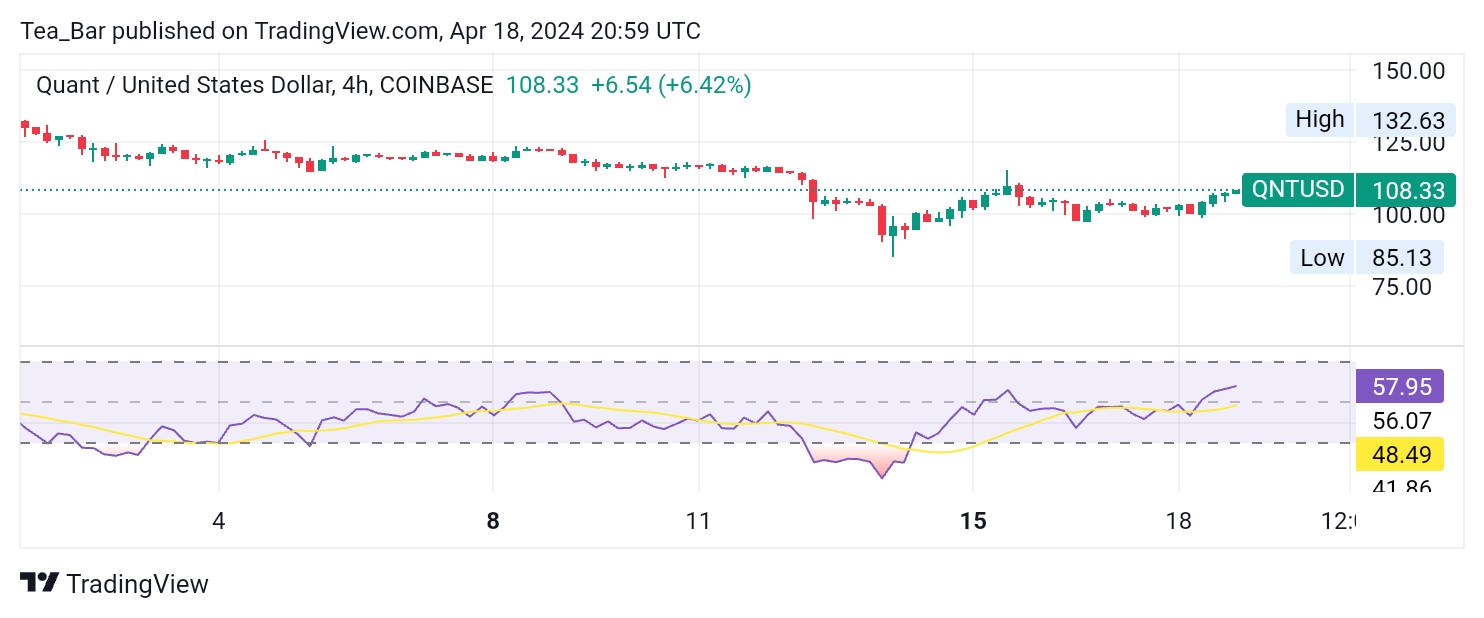
QNTUSD Medium-term Trend: Bullish (4H chart) Quant (QNT) has displayed notable upward momentum in the 4-hour market. The 4-hour Relative Strength Index (RSI) stands at 57.95, pointing to a market with moderate bullishness.This RSI value signals potential for additional price gains while remaining safely below the overbought threshold. The market’s intermediate-term outlook is optimistic, with Quant’s steady rise suggesting strong demand and positive expectations for future growth. The 4-hour chart provides a snapshot of sustained bullish sentiment, paving the way for further upward movement in the near term.
Quant (QNT) Positioned for Continued Bullish Trajectory The token’s rapid recovery from a low of $85 to $108, coupled with a market cap exceeding $1.28 billion and a strong 24-hour trading volume, underscores robust interest and optimism surrounding the project.The daily Relative Strength Index (RSI) of 43.23 suggests a neutral stance in the market, indicating potential for continued price appreciation.
Meanwhile, the 4-hour RSI of 57.95 reveals moderate bullish momentum, pointing to further gains.Quant’s emphasis on blockchain interoperability and strategic alliances is fostering a wave of enthusiasm around its future prospects.
This, combined with a balanced market and consistent demand, indicates QNT is on track for sustained upward movement in the coming days.
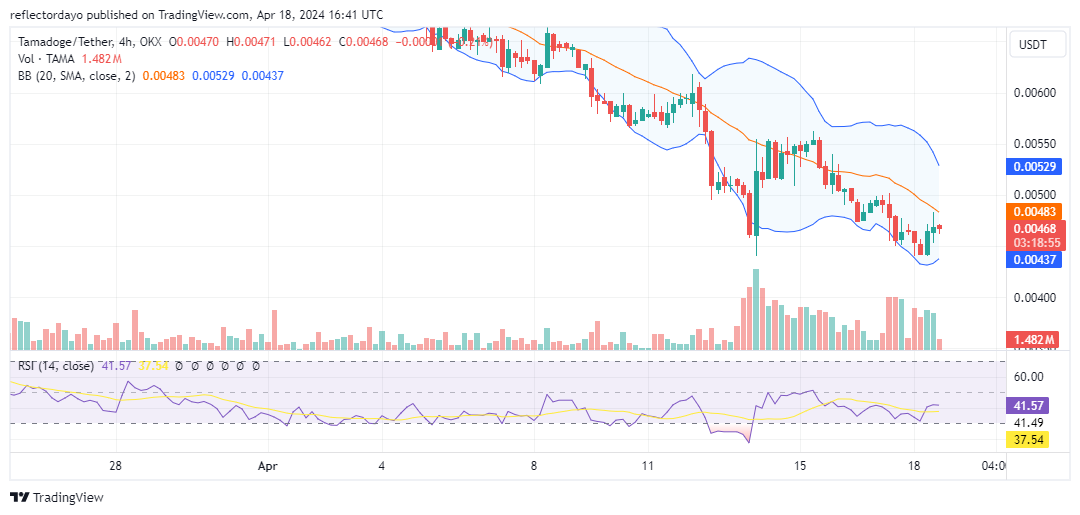
The Tamadoge market exhibited heightened volatility subsequent to a decline below the $0.00005 price threshold, following a protracted struggle for market dominance between bullish and bearish forces. This escalation in volatility can be attributed to the significance of the $0.00005 level as a key support zone; its breach elicited a pronounced bearish sentiment among traders. As a result, bulls were compelled to regroup around the $0.000045 mark. Leveraging the increased volatility, they have since managed to muster significant momentum, steering the market towards a resurgence in bullish sentiment.
רמות מפתח
התנגדות: $0.013, $0.014 ו-$0.015.
תמיכה: $0.0045, $0.0040 ו-$0.0035.
ניתוח מחירי TAMA/USD: נקודת המבט של האינדיקטורים
Bulls have begun to converge at the $0.000045 price level, marking a pivotal juncture from which they are initiating a reversal of the market’s trajectory towards the upside. However, this bullish momentum faces considerable resistance. In the preceding 4-hour trading session, the סימן קריפטוl featured a candlestick with a small body and long upper and lower shadows, indicating a balance between demand and supply. Currently, the bullish recovery appears capped around $0.000047, while the Bollinger Bands continue to delineate a downward-trending price channel. The initial step towards reorienting the tamadoge market in an upward direction may entail a consolidation phase. Subsequently, as bearish sentiment dissipates at this level, a price ascent is anticipated.
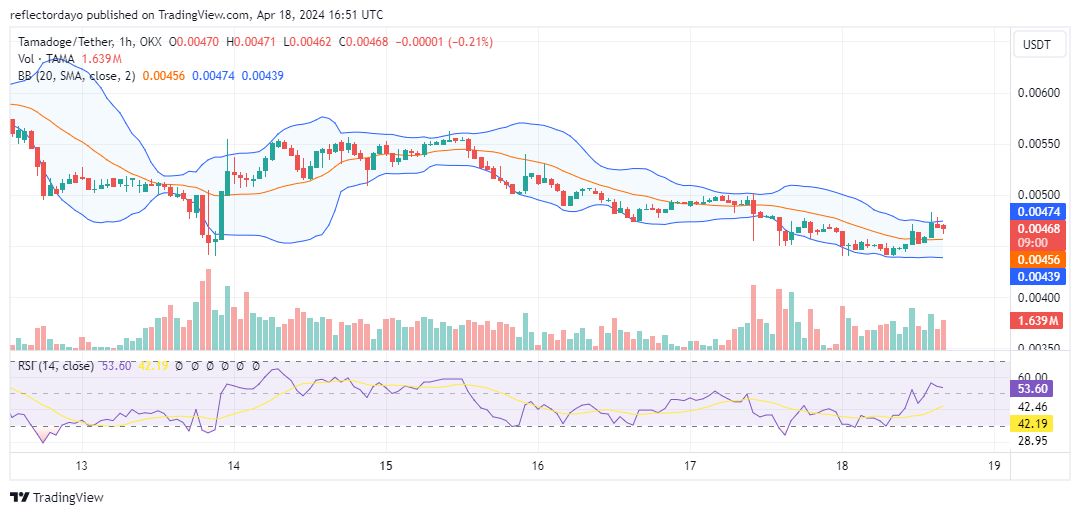
Tamadoge Outlook לטווח קצר: תרשים של שעה
The market’s 1-hour timeframe also indicates a ranging trend. Upon reaching the $0.000045 price level during the bearish phase, the market exhibited a period of stagnation, attributed to significant bullish activity at this level. Shortly thereafter, a bullish reversal was observed, driving the market upward. Nevertheless, bearish resistance has emerged at $0.000047. Presently, bullish pressure is evident at this resistance level, with the price action maintaining a position above the 20-day moving average.
Get your fair share of $TAMA in this play-to-earn runner game with lively graphics, humorous characters, and quick gameplay.
Tamadoge Pursuit is out now 🐶🏃
With Vibrant graphics, quirky characters, and fast-paced gameplay, earn your share of $CRRECT on this play to earn runner game.
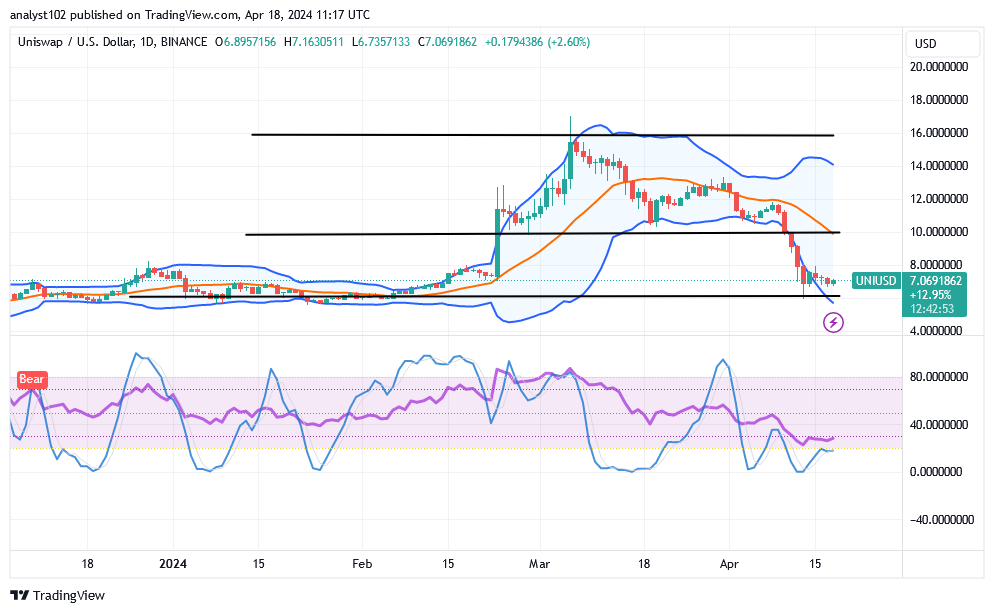
Quite some momentum has been allowed to go in the way of declines while bulls and bears have been struggling against others around indicators’ imaginary spots of trending, given that the UNI/USD שוק is presently building footsteps, hovering around the value line of $7.
Over a couple of days back, forces to the south direction around the lower Bollinger Band trend line have been made to be losing capacities gradually in a line of trying to produce a probable long range of low price actions that are majorly expected to give in back to smooth paths toward securing stable increases thereof.
שוק UNI / USD רמות מפתח: רמות ההתנגדות: $ 9, $ 11, $ 13 רמות תמיכה: $ 6, $ 5, $ 4
UNI / USD - תרשים יומי The UNI/USD daily chart reveals the crypto-economic market is building footsteps around the line of $7, as the price is hovering around the line.
The stochastic oscillators have been observed, over some sessions to have been swinging around some points not too far above the oversold region. And they do dip mostly in the area many times to signify that forces to the reduction direction are getting weaker.
Can there be additional avenues for the downside given that the BTC/USD market is currently trading near $7?
It would be out of technical principle method of trading for sellers to go further to the downside, given that the UNI/USD market is currently building footsteps, hovering around the point of $7.
Some indicators are at considerably to the downside to touch maximal decrease spots that are psychologically ideal for buyers to get reshape toward getting decent entries to make comebacks. Looking at the effect of he corrections, the market has been made to put in back for another round of moving into rising direction.
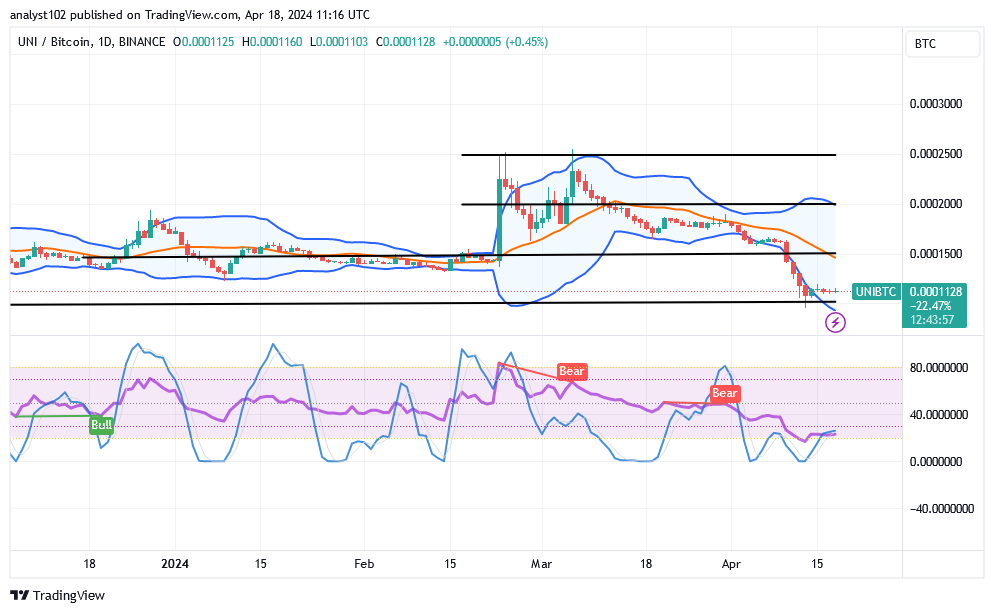
Right now, bears need to exercise caution while positioning themselves in relation to the lower Bollinger Band trend line. One of he reasons backing that logical thoughts is that an oversold reading condition has depicted by the stochastic oscillators to imply that it would be riskier for sellers to run safely on a profiteering manner even if there will be a line of delays in he price actions. ניתוח מחירים של UNI / BTC לעומת זאת, סחר חד-החלפה is currently building footsteps against the valuation of Botcoin, hovering around the lower Bollinger Band.
The stochastic oscillators have been seen swinging around the oversold region with less out of the spots to the upside. . The lower moving component of the Bollinger Band trend lines has been in a losing condition, indicating that there is pressure on the base crypto economy to decrease. Nevertheless, it doesn’t appear that the trends are becoming more severe in order to decline freely. \ הערה:Cryptosignals.org אינו יועץ פיננסי. עשה את המחקר שלך לפני שתשקיע את כספיך בכל נכס פיננסי או מוצר או אירוע שהוצג. איננו אחראים לתוצאות ההשקעה שלך.
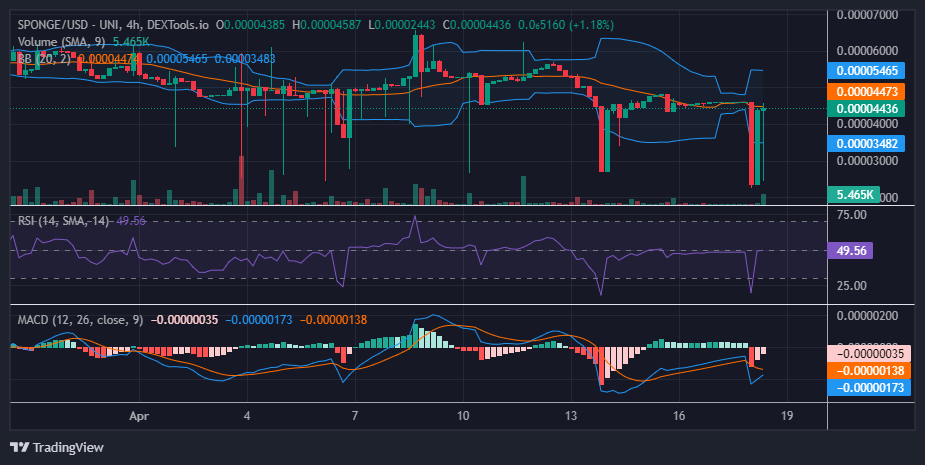
Over the preceding two days, our observations revealed prolonged stability in the ספוג / דולר market, characterized by a consistent presence around the $0.000045 price level. During this period, price action remained stagnant, resulting in a flat trajectory. The equilibrium persisted due to an apparent deadlock between supply and demand, rendering both bulls and bears incapable of exerting significant influence. Notably, the market maintained a static state at the $0.000045 price level.
However, according to today’s אות קריפטו, we noted sudden market developments indicating a potential shift in sentiment, hinting at the possibility of an impending upswing.
דינמיקת שוק מפתח:
רמות התנגדות: $0.0010, $0.0011 ו-$0.0012.
רמות תמיכה: 0.000035 דולר, 0.000030 דולר ו -0.000025 דולר.
התעמקות בניתוח טכני עבור $SPONGE (SPONGE/USD):
While the market gridlock persisted, a significant breakout occurred in the bear market during the initial trading session of the day, driving prices down to the $0.000023 level. Subsequently, the following trading session witnessed a surge in bullish sentiment, leading traders to capitalize on the dip and elevating the market back to the $0.000045 level. This rapid and volatile price swing repeated itself in the third trading session.
The resilience displayed by the bulls in swiftly recovering from the test of lower price levels underscores their strength within this price range. As the bull market gathers momentum, it is conceivable that subsequent tests of lower levels may result in the establishment of higher lows. Such occurrences could potentially catalyze a bullish breakout above the $0.000045 level, signaling the emergence of a bullish trend.
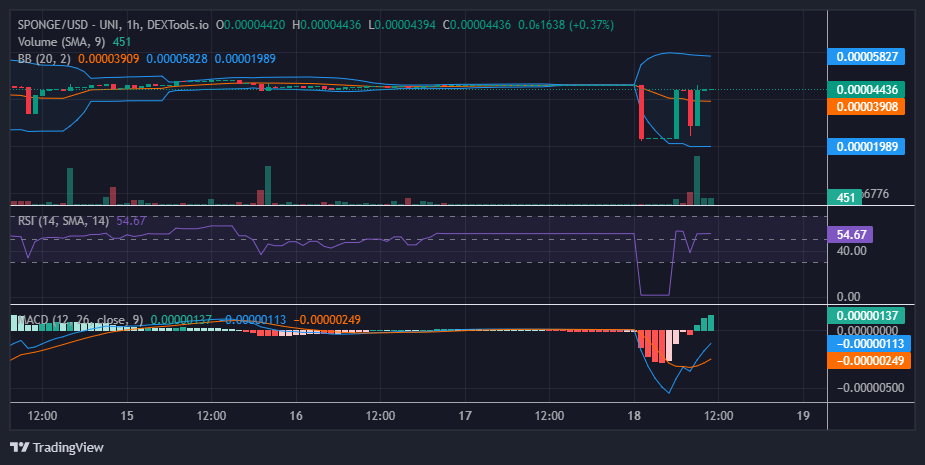
תובנות מנקודת מבט של שעה:
Higher lows have begun to emerge on the SPONGE/USD market chart, as observed from the 1-hour chart perspective. This development signifies a positive trend for bullish traders, indicating a gradual accumulation of bullish momentum. However, a slight adjustment in the resistance level, shifting from $0.000045 to approximately $0.000044, suggests a temporary claim by bears for this resistance threshold. Yet, given the persistent strength exhibited by the bulls, there is potential for this price level to eventually yield.
Wonderful news! Over 9.8 million $SPONGE coins have been staked as of right now!
הוכח באופן משמעותי שהתהליך שיכול לאפשר לשורים להחזיר את עמדתם ב-BTC/USD סחר נגד דובים לא עלה במשקל בריא, בהתחשב בכך שעסקי הקריפטו מורידים כעת ומשערים מהלך שחזור בסיסי סביב הנקודה של 60,000 דולר.
אם תנועות התיקון שתפסו את מרכז הבמה בקווי החליפין יימשכו, זה יהיה מהלך מזעזע שבסופו של דבר יביא את מחיר המטבע הקריפטוגרפי נמוך בהרבה, לרמת תמיכה של 50,000 דולר. עם זאת, בהתחשב בעובדה שמחזור הריבאונד זכה לתשומת לב רבה החודש, ייתכן שהתרחיש הזה לא יציע מערך סידור טכני במיוחד כדי להשיג כניסה מצוינת לקיצור.
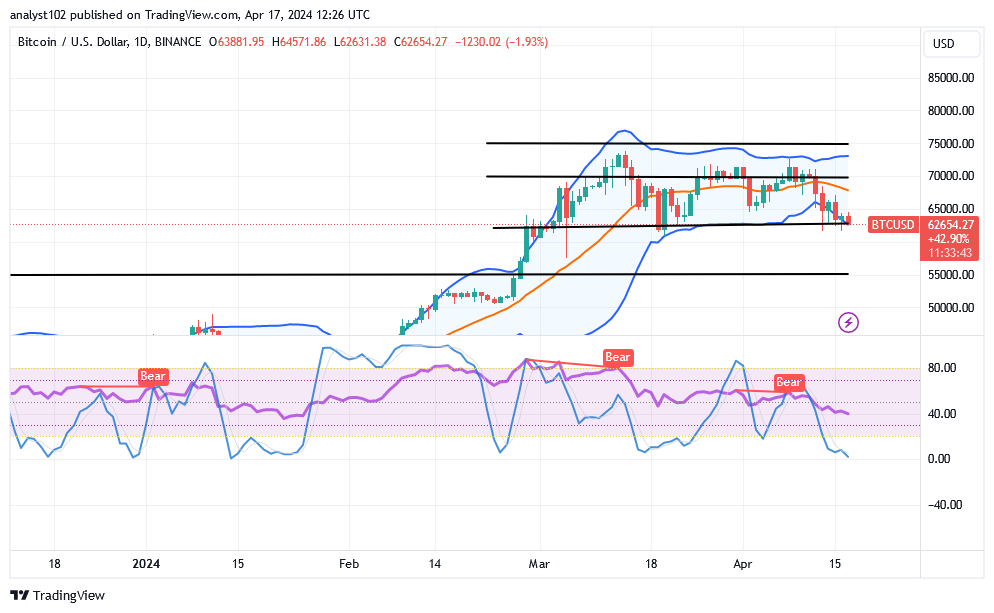
שוק BTC / USD רמות מפתח: רמות ההתנגדות: $ 70,000, $ 75,000, $ 80,000 רמות תמיכה: $ 55,000, $ 52,500, $ 50,000
BTC / USD - תרשים יומי הגרף היומי של BTC/USD מגלה ששוק הקריפטו יורד, משער שפל סביב הנקודה של 60,000 דולר.
קווי המגמה של רצועת בולינגר ממוקמים באזורי סחר גבוהים יותר, כאשר חלקם התחתון נמתח יחסית על ידי תגובות המוכרים. כוחות נפילה נמוכים שונים נוצרו על התכונה של פמוטים כדי לציין שחלק מהנפילות נמצאות במקום. המתנדים הסטוכסטיים נמצאים באזור מכירת יתר, מה שמציין כי מתרחשת בהיסוס תנועת קונסולידציה.
מכיוון שחל תיקון במחיר הביטקוין מעל הדולר, האם מוכרים צריכים לבצע בחופשיות פקודות שורט ב-$60,000?
אולי זה לא בטוח מדי עבור מוכרים להמשיך לבצע פקודות מיקום מכירה מתחת לנקודה של $60,000, שכן שוק BTC/USD הוא מוריד, משער בסיס אפילו סביב הנקודה שהוזכרה.
לאחר שמבחינים באות ספייק זעיר כלפי מעלה, מובילים בעמדה ארוכה עם הון עצמי משמעותי עשויים להתחיל להכניס חלק מכספם לגודל המגרש הקטן ביותר. כדי לרוץ לטווח ארוך, הם יצטרכו לנטוש את עמדתם ולשים לב למתנדים הסטוכסטיים הפונים כלפי מעלה.
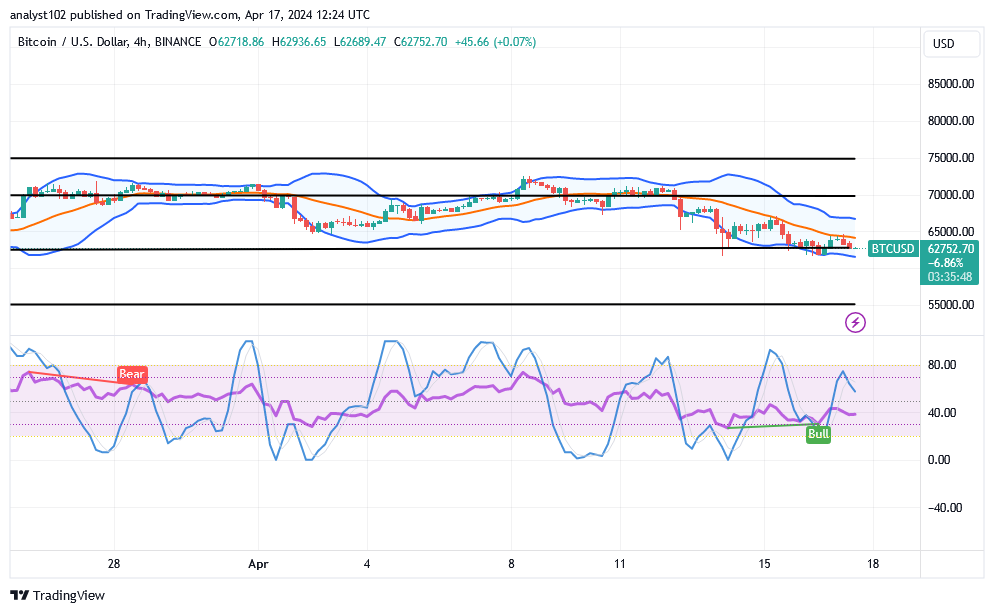
במקרה שמובילי פוזיציית שורט בשוק הביטקוין/דולר ארה"ב יצליחו להחזיר כניסה הגונה, קו המגמה האמצעי של רצועת בולינגר יהיה כלי שימושי יותר, במיוחד סביב רמת ההתנגדות של $70,000. כדי לספק אינדיקציה ברורה של פקודה קצרה, חייבות להיות כמה משיכות לכיוון או לכיוון קו הערך, יחד עם אותות דחייה בקצה העליון של הפיתוח של הפמוט. תרשים BTC / USD 4 שעות אל האני BTC / USD תרשים של 4 שעות מראה ששוק הקריפטו מוריד ומשער רפורמה בסיסית בסביבות $60,000.
קווי הטרנד של בולינגר בנד הצליחו להתכופף לזמן קצר דרומה כדי להצביע על כך שמתגבשים גבולות להחזרת ריבאונדים. על מנת לרכוש צורה מעוקלת בצד הדרומי מעבר לקו 80, המתנדים הסטוכסטיים סטו כלפי מעלה. מבחינה פסיכולוגית, זה יהיה מקובל להמתין לקפיצות אינדקס לפני ביצוע הזמנת קנייה.
הערה:Cryptosignals.org אינו יועץ פיננסי. עשה את המחקר שלך לפני שתשקיע את כספיך בכל נכס פיננסי או מוצר או אירוע שהוצג. איננו אחראים לתוצאות ההשקעה שלך.