Uniswap proposéiert Gouvernance a Frais Upgrades; UNI Präis Surges

D'Uniswap Foundation, d'Team hannert dem renomméierten dezentraliséierten Austausch (DEX) Uniswap, huet eng Propositioun enthüllt fir seng Gouvernance a Fraisekader ze verbesseren.

dëst Propositioun ass orientéiert fir méi aktiv an informéiert Participatioun vun UNI Tokenhalter ze encouragéieren, déi d'Autoritéit hunn fir iwwer d'Zukunft vum Projet ze stëmmen.

Ënnert der Propositioun sinn UNI-Halter, déi hir Tokens un e Wahlvertrieder delegéieren, berechtegt op en Undeel vun de Protokollfraisen, déi vun der DEX generéiert ginn. Dëst ass virgesinn fir UNI Inhaber ze stimuléieren fir Delegéiert ze wielen déi mat de beschten Interesse vum Protokoll a senge Benotzer ausgeriicht sinn.

Ausserdeem proposéiert d'Propositioun d'Reduktioun vum Quorum an d'Propositiounsschwellen, wat de Prozess fir d'Gemeinschaft rationaliséieren fir Gouvernance-Stëmmen ze initiéieren an ze passéieren. Dës Ännerungen, wéi et an der Propositioun steet, sollen "Gouvernance stimuléieren" a förderen e méi engagéierten an diversen Ökosystem.

Geplangt fir e Snapshot Vote den 1. Mäerz, gefollegt vun engem On-Chain Vote den 8. Mäerz, wäert d'Propositioun, wann guttgeheescht, an déi nächst Versioun vum Uniswap Protokoll integréiert ginn, v4, virgesinn fir am drëtten Trimester vun 2024 ze starten.

Uniswap spréngt ëm 70%, Records New Local High

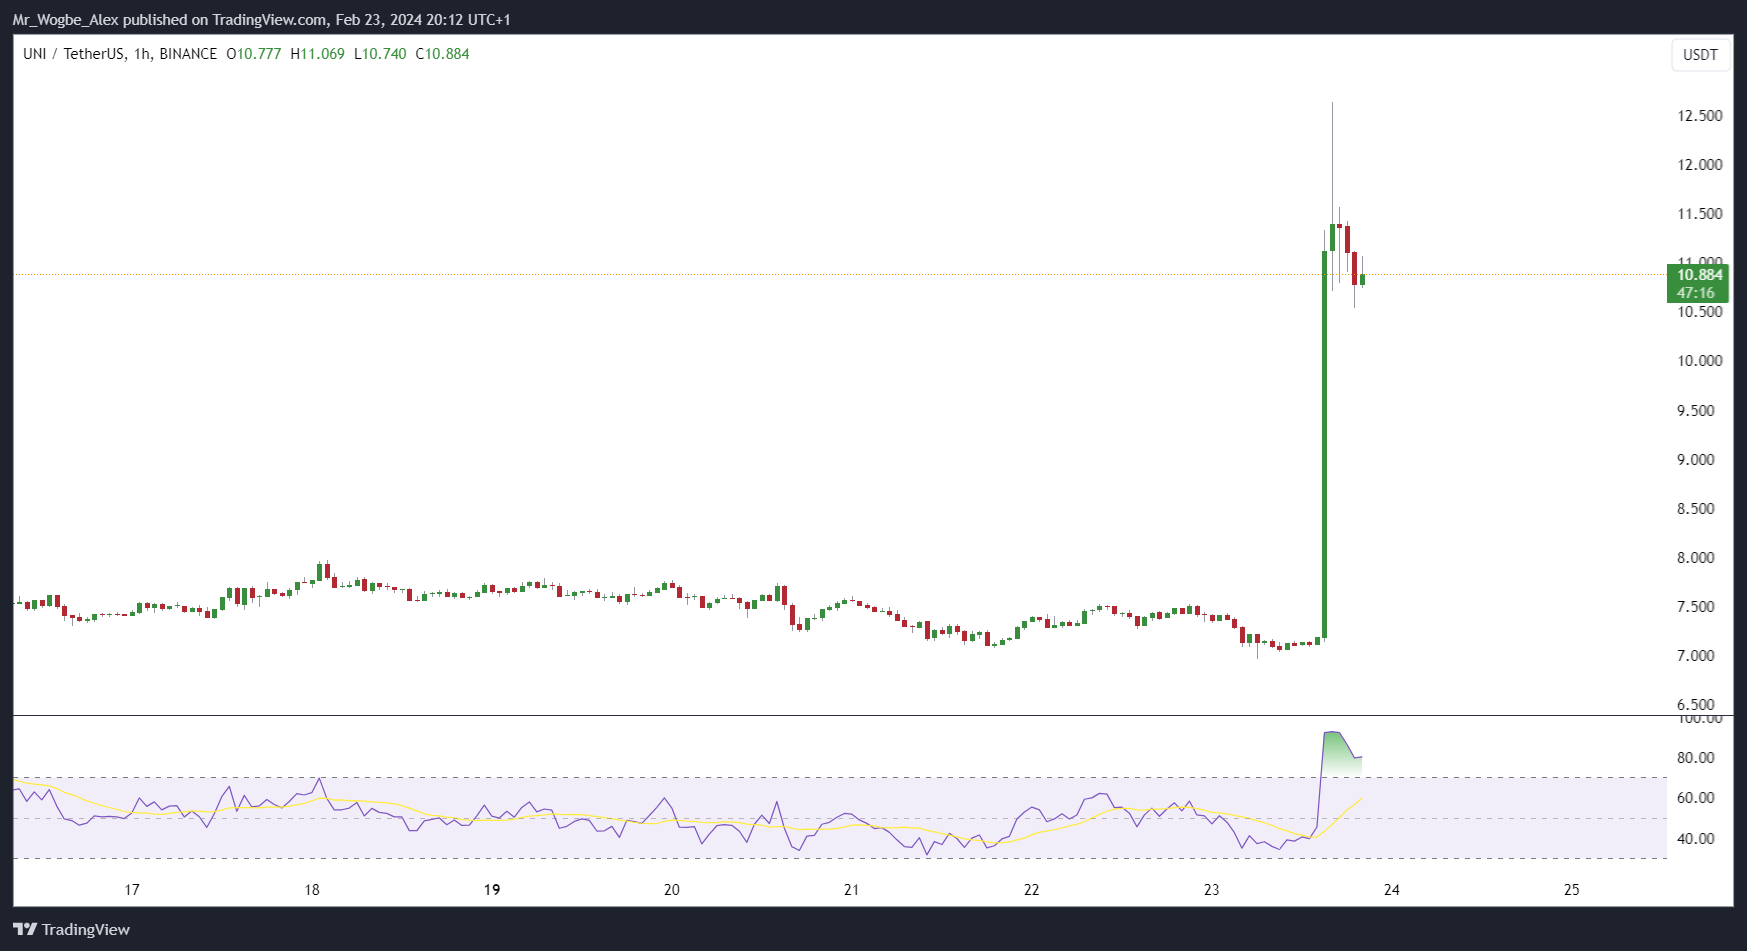
Gläichzäiteg mat der Ukënnegung vun der Propositioun war e bemierkenswäerte Präisschlag fir UNI, den gebiertege Token vun uniswap, déi vun iwwer 70% vun $7.35 op $12.63 den 23. Februar geklommen ass, wat säin héchste Punkt zënter Januar 2022 markéiert.

Trotz engem spéideren mëllen Réckgang, mam Krypto-Währungshandel ëm 50% an de leschten 24 Stonnen zum Zäitpunkt vun dësem Bericht, huet d'UN déi meescht vu senge Kollegen iwwerpréift.

Uniswap proposéiert Gouvernance a Frais Upgrades; UNI Präis Surges
UNIUSDT Daily Chart

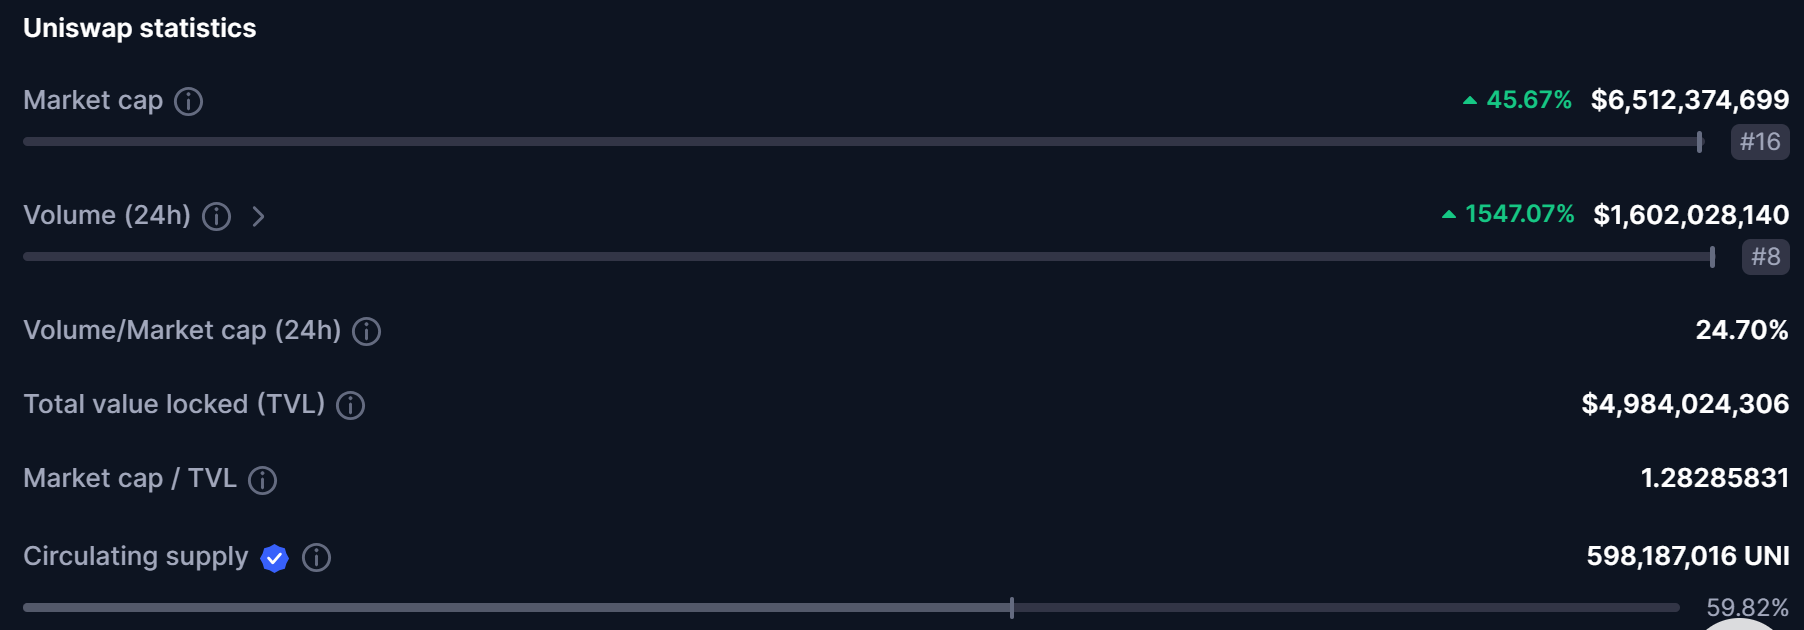
Uniswap steet als de féierende DEX am Krypto-Domain, mat iwwer $4.9 Milliarden am Gesamtwäert gespaart (TVL) an iwwer 1.5 Milliarden Dollar am deegleche Handelsvolumen. D'Plattform erlaabt d'Benotzer all ERC-20 Token ouni Intermédiairen auszetauschen, andeems d'Liquiditéitspools vun de Benotzer selwer finanzéiert ginn.

Uniswap proposéiert Gouvernance a Frais Upgrades; UNI Präis Surges
Bild iwwer CoinMarketCap

Uniswap v3, déi aktuell Iteratioun vum Protokoll, huet d'Konzept vun der konzentréierter Liquiditéit agefouert, wat d'Liquiditéitsanbieter erlaabt méi héich Fraisen ze verdéngen andeems se Präisbereich fir hir Poole spezifizéieren.

Déi zukünfteg Uniswap v4 hänkt vun der erfollegräicher Implementatioun vun der Ethereum's Dencun haart Gabel, geplangt fir Mäerz. Den Dencun ass agestallt fir e puer Verbesserungen am Ethereum Netz aféieren, dorënner méi niddereg Gasfraisen, méi séier Transaktiounen a verstäerkte Sécherheet.

Virun sengem Start wäert Uniswap v4 e ëmfaassende Sécherheetsaudit ënnerhuelen, fir d'Sécherheet an d'Zouverlässegkeet vum Protokoll ze garantéieren.


Interesséiert fir ze léieren wéi een Dag Krypto handelt? Kritt all Informatioun déi Dir braucht hei

Betruecht Investitioun an PIXEL: Ass et derwäert?

PIXEL presents an enticing opportunity in the Play-to-Earn (P2E) gaming sphere, reminiscent of the beloved farming simulation Stardew Valley. In this expansive virtual world, players cultivate plots of land, grow a variety of crops, and engage in buying and selling activities within bustling marketplaces to acquire rare items and skills.

Similar to real-life Landwirtschaft, success in PIXEL demands a significant time investment. From sowing seeds to harvesting crops, players are immersed in a cycle of agricultural tasks that require diligent attention. While shortcuts are available for those willing to spend, starting from scratch entails a substantial time commitment, with players often finding themselves clicking away for extended periods.

Binance’s integration of PIXEL tokens into its Launchpool offers an additional avenue for potential investors. By staking cryptocurrency, users can earn PIXEL tokens, which hold utility within the game and may appreciate in value as its popularity grows.
But the question remains: Is investing in PIXEL a wise decision?

Betruecht Investitioun an PIXEL: Ass et derwäert?

Understanding P2E Dynamics:

P2E games like PIXEL operate on a simple premise: reward players for their in-game endeavors. Whether slaying monsters, completing quests, or, in PIXEL’s case, tending to virtual farms, players earn in-game tokens that can be traded outside the game on crypto exchanges.

The P2E market has witnessed exponential growth, with billions of dollars poured into the industry in 2023 alone. Games such as Axie Infinity and Decentraland have experienced substantial token price appreciation, attracting players seeking monetary gains.

However, volatility looms as a significant concern. Many P2E Fotoen titles struggle to retain long-term player engagement, as perceived value often hinges on token prices rather than gameplay experience.
Despite skepticism, P2E games represent a burgeoning sector with transformative potential. As venture capitalist Chris Dixon aptly noted, “The next big thing will start out looking like a toy.”

Indeed, parallels can be drawn between P2E mechanics and real-world loyalty programs, where brands incentivize customer engagement through blockchain-based rewards. Yet, scaling such systems to accommodate thousands or millions of players poses technical challenges beyond most blockchain infrastructures’ capabilities.

Enter Ronin:

Ronin emerges as a pivotal solution to address the scalability woes plaguing P2E ecosystems. With its innovative blockchain technology, Ronin aims to facilitate seamless, high-volume transactions within gaming environments, heralding a new era of efficiency and scalability for P2E enthusiasts.

In conclusion, while investing in PIXEL holds potential Dënschden, it is essential to weigh the associated risks carefully. As the P2E landscape evolves and technologies like Ronin continue to mature, informed decision-making remains paramount for investors navigating this dynamic and rapidly expanding market.

Betruecht Investitioun an PIXEL: Ass et derwäert?

Unveiling Ronin: Revolutionizing P2E Gaming on Ethereum

Crafted by the masterminds behind Axie Infinity, Ronin emerged as a parallel chain to Ethereum, simplifying its essence as a Layer-2 remedy.
Ronin’s mission is crystal clear: expedite transactions and alleviate costs compared to Ethereum’s native dealings. With substantially reduced gas fees, gameplay becomes more accessible.
Enter Ronin’s native token, RON, which experienced a meteoric rise upon debut, only to plummet to minimal values, until recently resurging following Pixels’ partnership with Binance.

But why not streamline the process and invest directly in Ethereum?
Consider this: any value generated within Ethereum-based P2E games ultimately enriches Ethereum. Each Ethereum-integrated game expands the network of Ethereum wallets, users, and the overall ecosystem.
The most straightforward approach to investing in not just Pixels but any Ethereum-powered P2E game is to acquire and hold ETH, akin to an index fund encompassing the entire Ethereum landscape.

Enhanced Enjoyment, Reduced Expenses
If you have the time and inclination, delve into Pixels. Unlike typical blockchain applications, it seamlessly operates in your browser without any convoluted setup—a level of usability that every blockchain developer should aspire to achieve.

To me, games like Fortnite strike an ideal balance between entertainment and revenue. Fortnite offers free gameplay with perpetual access to default characters. However, character upgrades, purchased with real currency (V-Bucks), fuel Fortnite’s revenue stream.

Upgrading your Fortnite avatar is all about flaunting style; it doesn’t alter gameplay mechanics. Whether you’re donning Iron Man’s suit or embodying a towering banana, it’s all about enhancing the fun factor, and that’s a value worth investing in.

Ofschléissend

I ardently believe in the transformative potential of these games, not solely as entertainment but also as incentivization tools for businesses seeking to engage customers (by promoting new products, facilitating test drives, or encouraging the use of new features).

However, when it comes to investments, ETH remains my top choice. If P2E games ascend to mainstream popularity, ETH will emerge as the ultimate in-game reward.

Handel Krypto-Mënzen op BYBIT!

Cartesi (CTSI / USD): Bullish Momentum reduzéiert wéi de Präis bal den 19. Abrëll 2023 Resistenzniveau

The Cartesi market has sustained continuous bullish momentum, experiencing significant gains since its decisive breakout from the ranging trend on January 21. Although the bull market encountered some bearish activities along the way, the prevailing bullish sentiment has persistently pulled the market upward. However, as the market nears the critical resistance level of $0.35 on April 19, 2023, the strength of the bullish momentum is diminishing, raising the possibility of a correction.

The Cartesi Market Data

  • CTSI/USD Price Now: $0.33
  • CTSI/USD Market Cap: $255 million
  • CTSI/USD Circulating Supply: 779 million
  • CTSI/USD Total Supply: 1 billion
  • CTSI/USD CoinMarketCap Ranking: #229

Cartesi (CTSI / USD): Bullish Momentum reduzéiert wéi de Präis bal den 19. Abrëll 2023 Resistenzniveau

Schlëssel Niveauen

  • Resistenz: $ 0.35, $ 0.40, an $ 0.45.
  • Ënnerstëtzung: $0.25, $0.20, an $0.15.

The Cartesi Market Analysis: The Indicators’ Point of View

The emergence of an inverted hammer at the peak of the trend suggests a potential reversal towards a bearish trajectory. Earlier today, the Cartesi market experienced a significant surge upward, yet the trading volume, indicated by a short-height histogram, hinted at the lack of sustainability in this bullish move. This Krypto Signal suggests that the initial bullish momentum observed earlier today was unsustainable, as proven by subsequent developments. There is a possibility that the price may reverse at a lower peak compared to previous peaks in 2023. However, if this doesn’t occur, considering the decline in bullish strength, it’s unlikely that the market will surpass the crucial $0.35 price level.

Cartesi (CTSI / USD): Bullish Momentum reduzéiert wéi de Präis bal den 19. Abrëll 2023 Resistenzniveau

CTSI/USD 4-Hour Chart Outlook

From a shorter timeframe perspective, investors should monitor the $0.32 support level closely. There appears to be bullish interest around this level, as bullish forces have been resisting pressure here. However, the consistent appearance of inverted hammers indicates a gathering bearish momentum, suggesting a potential market breakdown. Once the critical $0.32 support level is breached, the market is likely to experience a significant decline.

Handel Krypto-Mënzen op BYBIT!

$SPONGE (SPONGE / USD): Virauszesoen e Burst vu Bullish Momentum

Despite the recent familiar sideways dance around the $0.000045 mark, $SCHWAPP seems poised for a breakout, hinting at a potentially exhilarating uptrend. This prolonged period of lateral movement often serves as a precursor to significant market shifts, typically favoring the bulls. Investors are advised to remain vigilant, attuned to signs of mounting bullish sentiment as the market gears up for potential fireworks.

Schlëssel Maart Dynamik:

  • Resistenz Niveauen: $ 0.0010, $ 0.0011, an $ 0.0012.
  • Ënnerstëtzungsniveauen: $0.000035, $0.000030 an $0.000025.

SPONGE (SPONGE/USD): Anticipating a Burst of Bullish Momentum

Déifgräifend technesch Analyse fir $SPONGE (SPONGE/USD)

The narrowing of Bollinger Bands indicates a decrease in volatility, hinting at an impending breakout. While the $SPONGE price maintains equilibrium, market observers may shift their gaze towards fundamental factors shaping the landscape. This phase often heralds a significant market move, keeping traders on the edge of their seats.

Drawing from historical performance, the unwavering support since February 5 fuels optimism for a potential rebound, echoing past market behavior.

SPONGE (SPONGE/USD): Anticipating a Burst of Bullish Momentum

A dive into the 1-hour perspective offers further illumination:

The price channel is gradually narrowing, mirroring the sideways trajectory of the 20-day moving average. Previously hovering around the 50 level, the Relative Strength Index (RSI) has now dipped below it, indicating a temporary shift in favor of the bears. However, despite this, the price continues to move sideways, suggesting that further downward movement is not guaranteed.

Meanwhile, in the Moving Average Convergence and Divergence (MACD) indicator, both the curves and histograms are converging around the zero level. While this Krypto Signal reflects indecisiveness, it does not offer a clear direction for market participants.

As the price channel tightens further, a decisive price movement appears imminent, potentially bringing clarity to the market’s direction.

When you miss SpongeV2, this is what occurs.

Investéiert an déi wäermst a bescht Meme Mënz. Kaaft Schwamm ($SPONGE) haut!

Dash 2 Handelspräis Prognose fir haut, 23. Februar: D2TUSD Präis Retracement kann iwwer den $0.01232 Resistenzniveau eropgoen

Dash 2 Trade Price Forecast: D2TUSD Price Retracement May Surge above the $0.01232 Resistance Level (February 23)
d' D2TUSD price will most likely reverse and pull back to resistance after updating lows and the price retracement may surge above the $0.01232 resistance level. If the price makes a retest at a $0.01232 high mark, then the price may jump up to hit the $0.02000 trend line and beyond, which indeed will be a turnaround for the coin holders.

Schlëssel Niveauen:
Resistenzniveauen: $ 0.00800, $ 0.00900, $ 0.01000
Ënnerstëtzungsniveauen: $ 0.00500, $ 0.00400, $ 0.00300

D2T (USD) Laangfristeg Trend: Bearish (4H)
Dash 2 Handel price is bearish on the higher time frame. This is due to the high impact of sellers. The high order flow from the bears during yesterday’s session also added to this bearishness.
Dash 2 Handelspräis Prognose fir haut, 23. Februar: D2TUSD Präis Retracement kann iwwer den $0.01232 Resistenzniveau eropgoen
The bears made a drop in the D2TUSD price to a $0.00677 low value below the moving averages as the 4-hour chart resumes today. Investors who buy at this level can expect sustained growth above the $0.01232 price level.

A retest of the dynamic resistance trend line at the previous high of $0.01232 could refuel the bullish momentum in the D2TUSD price and render any bearish correction invalid.

Meanwhile, the coin is pointing up on the daily stochastic, this means that a further bearish trend is uncertain. It is expected that the Dash 2 Trade price to retrace from the $0.00677 low level to a higher resistance mark as the coin market is oversold already. We now expect the crypto’s price to reach the $0.02000 high mark in the coming days.

D2T (USD) Mëttelfristeg Trend: Bearish (1H)
The coin price still trades in a bearish market in its medium-term perspective. Sellers acted bravely during yesterday’s session by dumping the price of Dash 2 Handel to a $0.00667 low value below the moving averages, this has made the coin price drop below the supply levels in its recent low.
Dash 2 Handelspräis Prognose fir haut, 23. Februar: D2TUSD Präis Retracement kann iwwer den $0.01232 Resistenzniveau eropgoen
Actions from the bears dropped the coin price to a $0.00677 support level beneath the supply levels as the 1-hour chart resumes today. Nevertheless, traders might seize this opportunity to invest in the coin now at a cheaper rate.

Mat der allgemeng Maart Trend nach bearish, der D2TUSD price is likely to retrace higher and retest the high accumulation zone of $0.01266 level soon.

Thus, if the buyers eventually wrestled trend control from sellers and rebound from $0.00677 support, a breakout above the trend line is needed to confirm the potential Bull Run. If this is achieved by the bulls, the price retracement may surge above the $0.01232 high level in the days ahead in its medium-term outlook.

We’ve published an extensive post on how to sign up for Dash 2 Trade!


Wëllt Dir eng Mënz déi e grousst Potenzial fir massiv Rendementer huet? Dës Mënz ass Dash 2 Trade. Kafen D2T elo.

SPONGE (SPONGE / USD) Priméiert fir Robust Bullish Momentum

As SPONGE/USD continues to maintain a sideways trend around the $0.000045 price level for an extended period, the market appears poised for a substantial movement, ideally in a bullish direction. Such market conditions often precede pronounced price shifts. Investors should exercise vigilance, remaining attentive to indications of a buildup in bullish momentum.

Schlëssel Maart Dynamik:

  • Resistenz Niveauen: $ 0.0010, $ 0.0011, an $ 0.0012.
  • Ënnerstëtzungsniveauen: $0.000035, $0.000030 an $0.000025.

SPONGE (SPONGE / USD) Priméiert fir Robust Bullish Momentum

Déifgräifend technesch Analyse fir $SPONGE (SPONGE/USD)

One market development indicating a potential buildup in bullish momentum is the convergence of the Bollinger Bands into a narrow price range, d'Signalisatioun a decrease in volatility. Despite the price maintaining equilibrium, investors and analysts may shift their focus to the fundamental factors influencing the market. The current market conditions typically precede a significant market movement.

Another factor shaping our expectations is the historical performance of the SPONG / USD market. The ongoing support level has remained steadfast since February 5, suggesting a potential rebound based on past market behavior.

SPONGE (SPONGE / USD) Priméiert fir Robust Bullish Momentum

Abléck aus der 1-Stonn Perspektiv:

On the 1-hour chart, the price channel continues to narrow further, aligning closely with the 20-day moving average, which maintains a sideways trajectory. Additionally, the Relative Strength Index (RSI) persists at the 50 level, indicating a state of equilibrium in the market. The increasing convergence of the Bollinger Bands suggests an imminent and definitive directional movement in the market.

Investéiert an déi wäermst a bescht Meme Mënz. Kaaft Schwamm ($SPONGE) haut!

UNUS SED LEO Präisprediktioun: LEO / USD Bereet fir zréckzefuerderen $ 4.23 Resistenz

UNUS SED LEO Price Prediction – February 22

The UNUS SED LEO price prediction shows that LEO keeps trading around $4.14, and the bulls are ready to push the coin to hit $4.3 level.

LEO/USD Laangfristeg Trend: Ranging (Deeglech Chart)

Schlëssel Niveauen:

Resistenzniveauen: $ 4.35, $ 4.45, $ 4.55

Ënnerstëtzungsniveauen: $ 3.90, $ 3.80, $ 3.70

UNUS SED LEO Präisprediktioun: LEO / USD Bereet fir zréckzefuerderen $ 4.23 Resistenz
LEOUSD - Daily Chart

LEO / USD will follow a bullish movement as the coin hovers within the 9-day and 21-day moving averages. At the beginning of today’s trading, the UNUS SED LEO price sees a slight rise toward the upside, and the UNUS SED LEO price hits the daily high at $4.23.

UNUS SED LEO Price Prediction: LEO Price Will Face the Upside

d' Präis UNUS SED LEO is seen retracing and within the 9-day and 21-day moving averages as the market price prepares for the upside. However, any bullish cross above the previous daily at $4.23 will increase the current market value to reach the nearest resistance at $4.30. Meanwhile, the buyers may locate the potential resistance levels at $4.35, $4.45, and $4.55 if the bulls put in more effort.

In the meantime, if the resistance level of $4.20 fails to hold, it may reverse and face the support level of $4.10, further increase in the bears’ pressure may bring down the price below the lower boundary of the channel, and this could cause the coin to hit the support levels at $3.90, $3.80, and $3.70 respectively. Moreover, the 9-day moving average is above the 21-day moving average, suggesting bullish movement.

LEO/USD Mëttelfristeg Trend: Ranging (4H Chart)

Geméiss dem 4-Stonne-Chart, den UNUS SED LEO price is hovering below the 9-day and 21-day moving averages at $4.14. The bulls can push the price toward the upper boundary of the channel if they increase the buying pressure but any bearish movement toward the lower boundary of the channel could bring the coin to the support level of $3.95 and below.

UNUS SED LEO Präisprediktioun: LEO / USD Bereet fir zréckzefuerderen $ 4.23 Resistenz
LEOUSD - 4-Stonn Chart

Moreover, if the UNUS SED LEO price finds a decent resistance level at $4.20 level, it will head to the north, which could hit the resistance level of $4.35 and above. At the moment, the 9-day moving average may follow the bearish movement as it crosses below the 21-day moving average.

Plaz gewënnt LEO Handel mat eis. Kréien LEO hei

Tamadoge (TAMA/USD) Iwwerschwemmungen: Bulls setzt d'Kontroll fest zréck, hält $ 0.0062 Ënnerstëtzung

In the latest analysis of Tamadoge, a subtle shift was identified, signaling a potential breakout from the narrow trading range of the stagnant market. This anticipation was confirmed during yesterday’s trading session as bullish momentum surged, reaching the peak of February 11th at $0.00690 before profit-taking ensued. However, the appearance of a spinning top candlestick suggests that bullish sentiment may still be present in the market. Despite the strength exhibited by the bulls in yesterday’s market, which typically triggers a robust bearish response, the bear market seems to be facing strong rejection from the bulls at the $0.0062 support level.

Schlëssel Niveauen

  • Resistenz: $ 0.013, $ 0.014, an $ 0.015.
  • Ënnerstëtzung: $0.0045, $0.0040, an $0.0035.

Tamadoge (TAMA/USD) Iwwerschwemmungen: Bulls setzt d'Kontroll fest zréck, hält $ 0.0062 Ënnerstëtzung

TAMA / USD Präis Analyse: D'Indicateuren 'Point of View

The $0.0062 level holds historical significance as a support level. Similar price retracements, like the one observed in today’s analysis, occurred on February 12th. Notably, the bear market was initiated at $0.0069 on that day, coinciding with the formation of the $0.0062 support level. Hence, the revisiting of this level could potentially reinforce it as a robust support level. Consequently, there is a possibility that the market may resume its upward trajectory from here as bullish sentiment reemerges.

Analysis of the Bollinger Bands indicator indicates heightened volatility. However, as bulls and bears reach equilibrium around $0.00626, volatility may gradually subside, leading to market consolidation at this level. This consolidation phase in the tamadoge market could further solidify $0.0062 as a pivotal support, facilitating the continuation of the prevailing trend.

Tamadoge (TAMA/USD) Iwwerschwemmungen: Bulls setzt d'Kontroll fest zréck, hält $ 0.0062 Ënnerstëtzung

Tamadoge Kuerzfristeg Ausbléck: 1-Stonn Chart

Baséierend op der Krypto Signal of the 1-hour chart, it’s evident that the price has entered a sideways range around the $0.00626 mark. Additionally, the Bollinger Bands indicator indicates a decreasing level of volatility as the bands narrow. To regain bullish momentum, it’s imperative for the bullish side to withstand pressure and gradually diminish bearish sentiment. This resilience will pave the way for the market to resume its upward trajectory.

Kafen Tamadoge!

Wëllt Dir eng Mënz, déi an den nächste Méint 100 Mol méi wäertvoll ass? Dat ass Tamadoge. Kafen TAMA haut!

Bitcoin ETFs gesinn déi niddregsten Inflows an zwou Wochen Amid Präisvolatilitéit

Bitcoin ETFs hunn e bemierkenswäerte Réckgang am Investisseurinteresse erlieft, mat de niddregsten Inflows an zwou Wochen, déi e Mëttwoch opgeholl goufen. D'Daten weisen datt nëmmen ongeféier 500 Bitcoins, entspriechend 25.5 Milliounen Dollar, ugezunn goufen, e staarke Kontrast zum Duerchschnëtt vu 7,000 Bitcoins pro Dag an de fënnef Deeg virdrun.

Dës verschwannen Nofro entsprécht enger Konsolidéierungsperiod fir Bitcoin, déi féierend Krypto-Währung, déi an enger schmueler Palette tëscht $50,850 an $52,550 an der leschter Woch gehandelt huet. Zu der Zäit vum Bericht gouf Bitcoin op $ 51,590 geschätzt, wat Händler an engem Zoustand vun Onsécherheet hannerloosst.


Bitcoin ETFs gesinn déi niddregsten Inflows an zwou Wochen Amid Präisvolatilitéit
BTCUSD Deeglech Grafik

Grayscale leiden am meeschten Dent an Bitcoin ETFs Outflow

Date gesammelt vun den Emittenten Websäite verroden datt d'Ausfluss vu Bitcoin ETFs haaptsächlech vum Grayscale's Bitcoin Trust (GBTC) gedriwwe goufen, deen 2,652 Bitcoins um Mëttwoch aus hirem Fonds gesinn huet. GBTC, de gréissten an eelste Bitcoin ETF mat iwwer 30 Milliarden Dollar u Verméigen ënner Gestioun, huet e wesentleche Réckgang am Interessi gesinn.

Ëmgekéiert hunn e puer méi nei a méi kleng Bitcoin ETFs, wéi BlackRock's iShares Bitcoin Fund (IBIT) a Fidelity's Wise Origin (FBTC), erlieft. héich Zommen Mëttwoch, dobäi bal 3,000 Bitcoins kombinéiert. Dës Fongen, déi méi niddereg Fraisen a méi Liquiditéit ubidden wéi GBTC, hu progressiv Maartundeel gewonnen zënter hirem Start am spéiden 2020.

Bitcoin op $150,000 am Joer 2024: Tom Lee

Trotz der rezenter Ofsenkung vun den Inflows, bleiwen gewësse Experten optimistesch iwwer geschriwen a seng ETFs laangfristeg Perspektiven. Den Tom Lee, en amerikaneschen Entrepreneur an Investisseur, huet op CNBC virausgesot datt Bitcoin bis Enn vum Joer $ 150,000 géif erreechen.

Hien zitéiert dräi Faktoren, déi de Präis vum Bitcoin stäerken: d'Erhéijung vun der Nofro fir Bitcoin ETFs, déi erofgaange Versuergung vun neie Bitcoins wéinst der Halbéierung an déi ënnerstëtzend Währungspolitik vun Zentralbanken. Hien huet och d'Méiglechkeet vun enger grousser Korrektur entlooss, a gesot datt "Bitcoin hält" an datt hien kee Réckzuch zu all Moment erwaart.

Betruecht investéieren an geschriwen oder aner cryptocurrency? Entdeckt eise Krypto-Signalservice fir rechtzäiteg a korrekt Maartabléck an Handelstipps.


Interesséiert fir ze léieren wéi een Dag Krypto handelt? Kritt all Informatioun déi Dir braucht hei