Crypto Outflows Persist for Second Week Amid Interest Rate Concerns

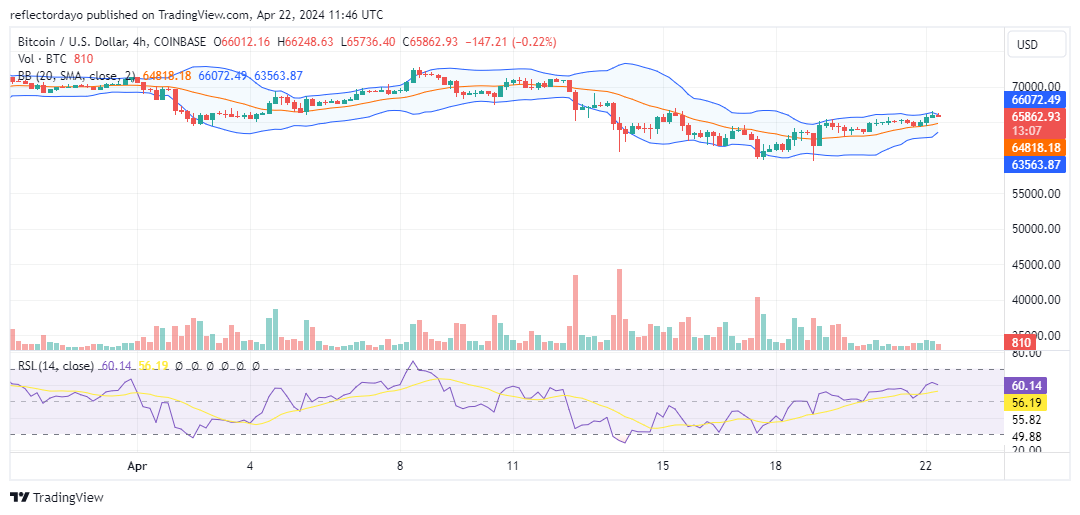
Crypto investment products have witnessed a second consecutive week of crypto outflows totaling $206 million, as reported by CoinShares. This decline coincides with a slight decrease in trading volumes of Exchange-Traded Products (ETPs), now стоење at $18 billion. Interestingly, these figures represent only 28% of total Bitcoin trading volumes, contrasting sharply with the 55% recorded just a month earlier.

Analysts attribute this waning interest among ETP and Exchange-Traded Fund (ETF) investors to the Federal Резерва indication of maintaining current high-interest rates for an extended period.

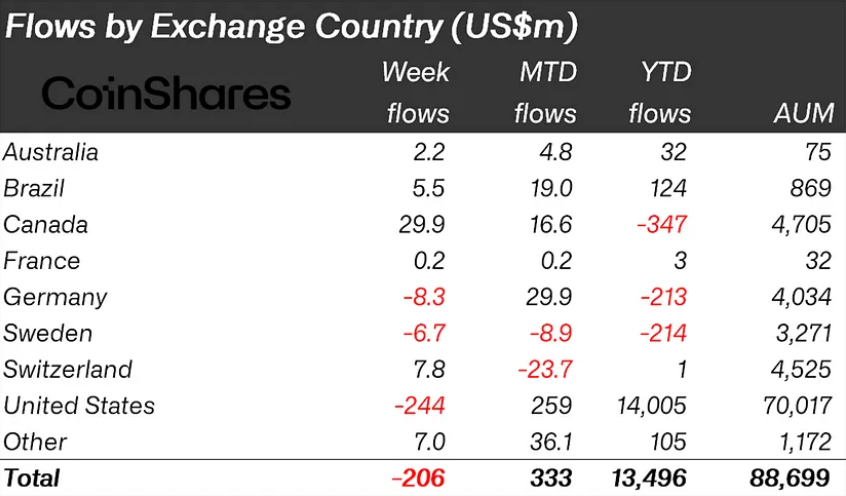
US Records Notable Crypto Outflows: $244 Million Trickle Out of Bitcoin ETFs

In the United States, sentiment remains predominantly negative, with ETFs experiencing outflows of $ 244 милиониEstablished ETFs have been hit hardest, while newly issued ETFs continue to attract capital, albeit at a slower pace compared to previous weeks. In contrast, Canada and Switzerland have seen inflows of $30 million and $8 million, respectively. Germany, however, reported minor outflows totaling $8 million.

Crypto Outflows Persist for Second Week Amid Interest Rate Concerns
Слика преку CoinShares

Биткоин, водечка криптовалутаисто така видел outflows, amounting to $192 million. Surprisingly, this has not led to a significant increase in short-Bitcoin positions, with only a $0.3 million outflow from such positions. Ethereum, on the other hand, has continued its six-week streak of outflows, totaling $34 million. 

There has been renewed interest in the altcoin sector, with inflows of $9 million last week. Litecoin Chainlink have seen particularly significant inflows, with $3.2 million and $1.7 million, respectively.

Crypto Outflows Persist for Second Week Amid Interest Rate Concerns
Слика преку CoinShares

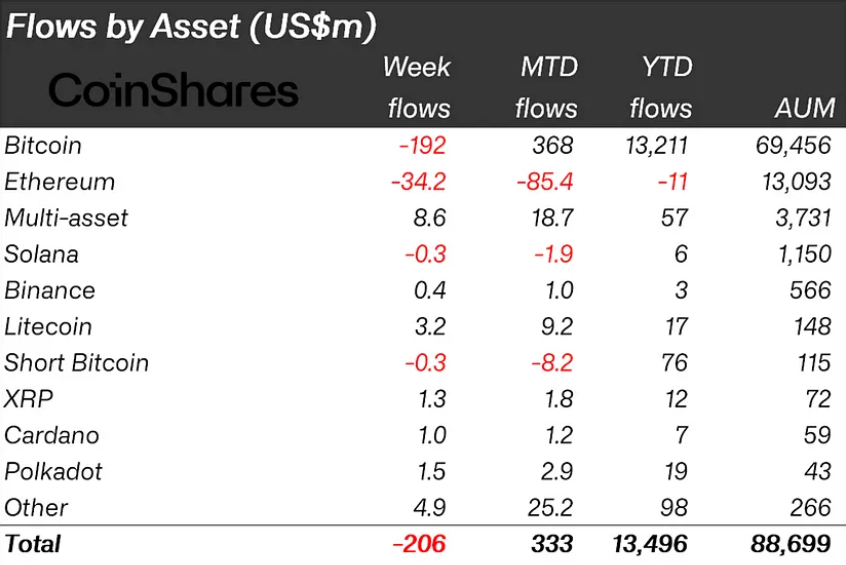
Blockchain equities have faced pressure as well, marking their 11th consecutive week of outflows totaling $9 million. Concerns regarding the impact of the upcoming halving event on mining companies have contributed to investor apprehension.

Standard Chartered Maintains $150,000 Bitcoin Price Прогноза

Despite these challenges, Geoff Kendrick, head of digital assets research at Standard Chartered, remains optimistic about Биткоин prospects. He reaffirms the банка ambitious price target of $150,000 for Bitcoin by year-end, citing the influx of capital into U.S. Bitcoin ETFs as a клучните фактор. 

U.S. Bitcoin ETFs have attracted approximately $12 billion in net inflows since their inception in early 2024. Speaking to BNN Bloomberg, Kendrick said:

“The ETF inflows in the U.S. have really dominated the demand-supply metrics so far in 2024. This is significant in terms of the ETFs’ performance to date.”

This report highlights the intricate relationship between investor sentiment, regulatory expectations, and market dynamics in the ever-evolving landscape of cryptocurrency investments.

Кога тргувате на пазарот на крипто, тоа не мора да биде „погоди или промаши“. Заштитете го вашето портфолио со занаети кои всушност даваат резултати, исто како и нашата премија крипто сигнали на Телеграма.


Заинтересирани сте да научите како секојдневно да тргувате со крипто? Добијте ги сите информации што ви се потребни овде

Decentraland (MANAUSD) се менува бидејќи цените избегнуваат нови ниски падови

Market Analysis – Prices Avoid New Lows

MANAUSD experienced a reversal as price action failed to register a new lower low. This indicates a potential shift in market sentiment as buyers are eager to take control.

Клучни нивоа на MANAUSD

Нивоа на побарувачка: 0.4250 УСД, 0.3270 XNUMX УСД
Нивоа на снабдување: 0.5680 УСД, 0.7900 УСД

Decentraland (MANAUSD) се менува бидејќи цените избегнуваат нови ниски падовиMANAUSD experienced a significant drop in mid-April 2024, causing the price to slightly breach the $0.4250 demand level and taking out existing liquidity below. Following the liquidity being taken, the price formed a failed low, indicating a decrease in selling pressure, which could potentially lead to a rise in price.

The 4-hour timeframe supports a bullish bias as it broke the structure upwards. The 4-hour Moving Average also aligns with the bullish bias, with the current price trading above it. Additionally, the daily Relative Strength Index shows the price below the 30.0 oversold region, indicating a potential buildup of bullish strength.

Decentraland (MANAUSD) се менува бидејќи цените избегнуваат нови ниски падови

Очекување на пазарот

The price is anticipated to increase quickly as liquidity below the $0.4250 level is being absorbed. It is expected that the supply level at $0.5680 will be surpassed as the price seeks to access liquidity situated above that level.

Можете да купите Lucky Block овде. Купете LBLOCK

забелешкаCryptosignals.org  не е финансиски советник. Дали вашето истражување пред да ги инвестирате вашите средства во кое било финансиско средство или презентиран производ или настан. Ние не сме одговорни за вашите инвестициски резултати.

Соединението (COMPUSD) доживува мечешки пресврт

Market Analysis – Price Strikes Major Resistance Zone

Compound (COMPUSD) has been embroiled in a protracted battle with resistance, particularly around the $74.460 mark, spanning nearly two years. Despite persistent efforts, the price has struggled to breach this significant barrier, with the earliest signs of resistance emerging back in May 2022.

Conversely, the demand threshold at $30.270 has acted as a formidable line of defense against further price declines. Each encounter with this level has triggered bullish reversals, resulting in a prolonged period of price oscillation confined within the range of $74.470 and $30.270.

Сложени нивоа на клучеви

Нивоа на побарувачка: 106.000 $ 87.540 $, 74.460 $
Нивоа на набавки: 30.270 УСД, 26.000 УСД, 25.000 УСД

Соединението (COMPUSD) доживува мечешки пресврт

March brought an unexpected twist to the narrative as market bulls capitalized on the favorable conditions presented by the bullish crypto season, driving the price above the resistance zone at $74.400. Yet, this bullish momentum proved fleeting, as the price encountered swift resistance around $97.540, leading to a rapid downturn.

Furthermore, a bullish parallel channel emerged, facilitating the invalidation of the long-term resistance zone at $74.460. However, the euphoria was short-lived as the price swiftly crashed below the parallel channel upon reaching the resistance zone of $97.550, signaling a potential shift toward bearish market sentiment.

Соединението (COMPUSD) доживува мечешки пресврт

Очекување на пазарот

Adding to the bearish outlook, the price currently resides below the Moving Average (Periods 9 and 21), further affirming the prevailing bearishness in the market and sending cautious crypto signals. Analysts anticipate a continuation of the downward trajectory, with the price expected to decline further towards the previous low on the daily chart at $43.000.

Можете да купите Lucky Block овде. Купете LBLOCK

забелешкаCryptosignals.org  не е финансиски советник. Дали вашето истражување пред да ги инвестирате вашите средства во кое било финансиско средство или презентиран производ или настан. Ние не сме одговорни за вашите инвестициски резултати.

Предвидувања на трговската цена на Dash 2 за денес, 23 април: Цената на D2TUSD наоѓа отпор на ниво на понуда од 0.00380 долари

Dash 2 Trade Price Forecast: D2TUSD Price Finds Resistance at $0.00380 Supply Level (April 23)
Постои можност за купување на D2TUSD pair as the price now finds resistance at the $0.00380 supply level while climbing the bullish ladder and going up at the moment. However, the price will move higher above the current resistance level, if buyers should exert more force into the price action in the market, the $0.00505 high trend line might be retested soon which may expose the coin price further to a $0.01000 upper high trend line, resulting to a good entry time for coin buyers.

Клучни нивоа:
Ниво на отпорност: 0.00500 долари, 0.00600 долари, 0.00700 долар
Ниво на поддршка: 0.00350 $, 0.00300 долари, 0.00250 $

D2T (USD) Долгорочен тренд: нагорен (4H графикон)
D2TUSD is in a bullish trend market in its long-term view. The bulls are about to take over and push us higher. There are multiple possible targets at this point, but the pair looks quite bullish here as we can see the coin price trading above the EMA-50.
Предвидувања на трговската цена на Dash 2 за денес, 23 април: Цената на D2TUSD наоѓа отпор на ниво на понуда од 0.00380 долари
The bulls’ pressure on the cryptocurrency to the $0.00376 resistance level in the previous action has allowed it to retain its upward growth.

An increase to a $0.00380 high level above the EMA-9 approaching the overhead resistance as the 4-hourly chart opens today indicates that the traders are actively buying at this level.

This current trend will enable the price of Цртичка 2 Трговија to remain on the upside and rise or break out to the upside. This will enable buyers to hold a firm grip over the asset.

Furthermore, the market is pointing up on the daily stochastic; this will quicken the emergence of more buyers to move the price of D2TUSD up to a significant level on the upside which might hit the $0.01000 supply trend mark, thus bringing a positive sentiment among the coin traders and registering a buy signal for the coin traders as the market remain strongly bullish soon in its higher time frame.

D2T (USD) Среднорочен тренд: нагорен (1H графикон)
Цртичка 2 Трговија market also trades in a bullish trend market in the medium-term outlook. This is due to the high impact of the long-term traders on the price flow.
Предвидувања на трговската цена на Dash 2 за денес, 23 април: Цената на D2TUSD наоѓа отпор на ниво на понуда од 0.00380 долари
Одржливиот нахакан притисок на високото ниво од 0.00377 долари во претходната акција доведе до неодамнешно високо ниво на монетата.

Earlier today, after completing the sideway moves, the D2TUSD buyers successfully pushed the coin price up to a $0.00380 supply level above the two moving averages shortly after the 1-hourly chart opened.

The current price at the $0.00380 resistance level suggests the returns of the buy traders in the market. The market participants are responding to this pattern, and its breakout should offer a good buy entry opportunity.

Оттука, парот што е насочен нагоре на дневниот стохастик значи дека куповниот притисок може да продолжи и сугерира можно закрепнување на нивото на понудата од 0.01000 долари во наредните денови во среднорочна временска рамка.

Two-Factor Authentication (2FA), our newest feature, will increase the security of your Dash 2 Trade account!


Сакате монета што има огромен потенцијал за масивни враќања? Таа монета е Dash 2 Trade. Купете D2T сега.

Предвидување на цената на биткоинот: БТК/УСД надминува 66,000 долари: Дали е време за пораст?

Bitcoin (BTC) Price Prediction – April 22

Looking at the daily chart, the Bitcoin (BTC) price prediction is showing positive signs, and it is likely to accelerate further higher in the near term.

Долгорочен тренд на БТК / УСД: Зелен (дневна табела)

Клучни нивоа:

Нивоа на отпорност: 80,000 УСД, 82,000 УСД, 84,000 УСД

Нивоа за поддршка: 52,000 УСД, 50,000 УСД, 48,000 УСД

Bitcoin Price Prediction: BTC/USD Trades Above $66,000; Time to Resume Higher?
BTCUSD - Дневен графикон

Според дневната шема, БТК / УСД breaches $66,000 as the new week’s high beckons. The king coin is seen trading well within the 9-day and 21-day moving averages at $66,130. Moreover, the Bitcoin price is within touching distance of forming a new daily high above the previous high of $66,000, which is quite remarkable.

Предвидување на цената на биткоинот: Каде оди понатаму цената на биткоинот?

Во моментот, Биткоин цена is trading comfortably toward the upper boundary of the channel as the price establishes a new bullish signal. Meanwhile, one could say that the long-term outlook favors the bulls, giving the daily close produced a few bullish candles with eyes now set on the daily resistances at $80,000, $82,000, and $84,000 respectively.

Meanwhile, any drop from the current level could lead to declines in the critical support below the lower boundary of the channel. However, in case BTC drops and touches the low of $60,000 support, then the king coin can rely on the long-term support levels at $52,000, $50,000, and $48,000. Moreover, the 9-day moving average is below the 21-day moving average, suggesting bearish signals.

Среднорочен тренд на БТК / УСД: Ранг (4Х графикон)

Според 4-часовниот графикон, Bitcoin price is seen trading above the 9-day and 21-day moving averages at $66,132. However, today’s price move could be impressive if it climbs above the long-awaited resistance level of $70,000. Moreover, BTC/USD is now maintaining its bull run as the 9-day MA keeps hovering above the 21-day MA.

Bitcoin Price Prediction: BTC/USD Trades Above $66,000; Time to Resume Higher?
BTCUSD - Табела со 4 часа

On the contrary, BTC may take a downward move if the bulls fail to push the price higher, and the coin may breach below the 9-day and 21-day moving averages, which could reach another support at $60,000 and below. Nevertheless, if the bulls find a decent resistance level of around $68,000, the coin may continue the bullish movement by crossing above the channel to hit the resistance level of $72,000 and above.

Биткоинот можете да го купите овде. Купете БТК

$SPONGE (SPONGE/USD): Squeeze Play? Bollinger Bands Tighten After Support Test

In our previous analysis of Сунѓер / УСД, we observed the market consolidating sideways near the $0.00005 price level. This level appears to be a temporary equilibrium point, with bulls and bears finding temporary parity. Swing highs and lows have been concentrated around this price. However, it’s noteworthy that bearish pressure tested lower levels in both the previous and current sessions. While this could suggest increasing bearish momentum, it also highlights the bulls’ continued defense around the $0.00005 support level.

Клучна динамика на пазарот:

  • Нивоа на отпорност: $0.0010, $0.0011 и $0.0012.
  • Нивоа за поддршка: 0.000035 0.000030 долари, 0.000025 XNUMX долари и XNUMX XNUMX долари.

$SPONGE (SPONGE/USD): Squeeze Play? Bollinger Bands Tighten After Support Test

Навлегуваме во техничка анализа за $SPONGE (СОНГЕР/УСД):

The recent sharp contraction of the Bollinger Bands indicates a decline in volatility. Initially, both buyers and sellers failed to capitalize on the higher volatility, resulting in the sideways price action. This standoff likely contributed to the volatility decrease.

Овој вид на крипто сигнал, that is,this contraction, often precedes a breakout (price moves decisively above the upper band) or breakdown (price moves decisively below the lower band) from the recent trading range. Current technical indicators signal market indecision and consolidation.

The Relative Strength Index (RSI) sits near the midpoint, and the Moving Average Convergence Divergence (MACD) lines trade sideways above zero, suggesting neutrality. While the price currently resides slightly below the 20-day moving average, potentially hinting at a breakdown, the two recent price rejections on the downside suggest continued bullish strength around this price zone.

$SPONGE (SPONGE/USD): Squeeze Play? Bollinger Bands Tighten After Support Test

Увид од 1-часовна перспектива:

Yesterday’s bearish move in SPONGE/USD unfolded over two one-hour sessions. Today, however, the bears’ attempt to push lower was contained within a single one-hour session. This potentially indicates a quicker rejection by the bulls compared to yesterday, suggesting a possible increase in bullish momentum. While this is a positive sign for the bulls, it’s not necessarily a confirmation of an imminent price breakout. Further observation and confirmation from other technical indicators are needed.

Купете сунѓер/УСД!

Инвестирајте во најжешката и најдобра монета за меми. Купете сунѓер ($СОНГЕР) денес!

Трговијата со Dogecoin (DOGE/USD) е на база, одржувајќи позитивни притисоци

Предвидување на цената на Dogecoin – 22 април

Биковите против мечките започнаа постепен напор за притискање на начин на размена на ценовни акции помеѓу пазарот Dogecoin наспроти трговската линија на тој американски долар, бидејќи криптоекономска цена е на шема за формирање на база, држејќи позитивни туркања.

Според техничката анализа, долната линија на трендови Bollinger Band ќе биде главната алатка за одредување дали цената ќе продолжи да опаѓа или ќе го продолжи својот нагорен тренд. Трговската зона на отпор на тој среден Болингер индикатор е одржлива кон обезбедување пристојно продолжување на отфрлањата што може да доведе до генерирање на инстант записи за скратување врз основа на принципот на моментално достигнување додека таа претпоставка има тенденција да се реализира.

DOGE/USD пазар
Клучни нивоа:
Ниво на отпорност: 0.18 долари, 0.22 долари, 0.26 долар
Ниво на поддршка: 0.12 $, 0.10 долари, 0.08 $

DOGE / USD - Дневен графикон
Дневниот весник DOGE/USD покажува дека пазарот на крипто е на основен стил на создавање околу 0.15 долари, со позитивни притисоци.

Варијантаните свеќници се формираат со генерирање на дното блиску до страната на сигналот за купување на долната лента Болингер. Стохастичките осцилатори останаа на пониските места за да прикажат дека пазарот е во расположение да се обидува да собере катализатори.
DOGE/USD, DOGE/BTC, Dogecoin, Техничка анализа

Ако се појави страшно повлекување против долниот бенд Болингер, дали купувачите на пазарот DOGE/USD нема брзо да закрепнат?

Производството на ненадеен мечешки свеќник во однос на долниот индикатор Болингер Бенд без брзо движење на поништување може да предизвика пониски ниски падови пред биковите да се соберат за да се зголемат, имајќи предвид дека DOGE/USD трговија моментално е на начин на формирање на база околу вредноста од 0.15 $, задржувајќи позитивни притисоци.

Со оглед на моменталната ситуација, двигателите на долги позиции веројатно ќе победат во средните и долните линии на бендовите Болингер. Сепак, тие мора да донесат долгорочни одлуки за наредбите за нивните позиции.

Мечките имаат тенденција да немаат пристојни влезови бидејќи повеќето индикатори се поставени на разумни пониски области кои не поддржуваат многу брзини на јужната страна. Ако навистина е така, тогаш секое движење во долната зона на Болингер бенд може да наиде на извонредно отскокнување, што ќе го направи неважечко во процесот.
DOGE/USD, DOGE/BTC, Dogecoin, Техничка анализа
DOGE/BTC анализа на цените
Спротивно на тоа, на Dogecoin трговија е на база која се карактеризира со вреднување на Биткоин, држејќи позитивни притискања.

Стохастичките осцилатори продолжија да осцилираат на значително пониска оска, што покажува дека основната криптовалута се обидува да се позиционира за да го надмине својот ривал. Тренд линиите на Bollinger Band се позиционирани во повисоките зони, што сигнализира дека цената се одржува во опсег од оваа анализа.

Забелешка: Cryptosignals.org не е финансиски советник. Направете го вашето истражување пред да ги инвестирате вашите средства во кое било финансиско средство или презентиран производ или настан. Ние не сме одговорни за вашите резултати од инвестирањето.


Можете да купите Lucky Block овде. Купете LBLOCK

Подигнување на искуството со DeFi со Raydium

Raydium stands at the forefront of revolutionizing the decentralized finance (DeFi) ecosystem with its state-of-the-art platform. By harnessing the power of the Solana blockchain, Raudium delivers unparalleled advantages, including lightning-fast transaction speeds, seamless shared liquidity across its ecosystem, and pioneering yield-generating functionalities. But what truly distinguishes Raydium from its peers? Let’s delve deeper into the unique attributes that set Raydium apart and position it as a leader in the rapidly evolving DeFi landscape.

In contrast to traditional на определен обем, protocols constrained within their liquidity pools, Raydium adopts a groundbreaking strategy by integrating a central order book. This innovative approach revolutionizes liquidity provision by facilitating seamless access to third-party order flow and fostering ecosystem-wide liquidity.

By transcending the limitations of isolated pools, Raydium creates a dynamic environment where liquidity is fluidly shared across various platforms and market participants, enhancing market depth and efficiency. This unique feature not only promotes greater liquidity but also expands trading opportunities, ultimately empowering users with a more robust and interconnected DeFi experience.Подигнување на искуството со DeFi со Raydium

Advantages of Raydium:

1. Swift and Cost-effective: By harnessing Solana’s efficiency, Raydium accelerates transactions and slashes gas fees compared to Ethereum.

2. Centralized Liquidity Hub: Raydium’s integration with a central limit order book ensures a robust trading ecosystem with unparalleled liquidity.

3. Trader-Friendly Interface: Empower traders with features like TradingView charts and customizable limit orders for enhanced control over their trading experience.

Explore Raydium’s Possibilities

Embark on a transformative journey with Raydium and unlock the boundless possibilities that await within its dynamic ecosystem. Dive into a realm where innovation knows no bounds, and where cutting-edge technology merges seamlessly with groundbreaking financial solutions.

Доживејте ја моќта на Децентрализирана finance like never before as you explore a vast array of opportunities for trading, liquidity provision, and yield generation. Whether you’re a seasoned investor seeking new avenues for growth or a DeFi enthusiast eager to dive into the world of decentralized exchanges, Raydium offers a gateway to limitless potential. Join us on this exhilarating adventure and discover the future of finance with Raydium.

1. Trade and Exchange: Seamlessly swap between tokens within liquidity pools or utilize advanced trading features like limit orders for a superior trading journey.

2. Earn Trading Rewards: By providing liquidity in Raydium’s pools, you can earn a share of trading fees generated by swaps within those pools.

3. Acquire RAY Tokens: Participate in liquidity farming and staking to earn RAY tokens, with more earning opportunities on the horizon.

4. Propel Your Project: Whether you aim to list your project, establish a Fusion Pool, or join AcceleRaytor, Raydium offers avenues for growth and exposure. Register on the platform to get started.

5. Supercharge Your Platform: If you’re seeking to enhance your platform’s capabilities on Solana, Raydium is your ideal partner. Let’s collaborate to unleash the full potential of your project!

Подигнување на искуството со DeFi со Raydium

Introducing UI V3 (Beta): Elevating User Experience

Raydium’s latest iteration, UI V3 (Beta), brings a host of enhancements to amplify user experiences. With a more robust and intuitive interface, users can expect heightened usability, effectiveness, and productivity. Here’s what’s new:

Управување со портфолио: Experience the revamped portfolio page, your central hub for managing positions. Easily add or withdraw liquidity, collect yields, and create pools and positions directly from the pool list.

Управување со ликвидност: Discover all Raydium liquidity pools in one unified interface. Access CLMM, Standard (AMM pools), or ALL pools effortlessly. Toggle between list and card views for enhanced visibility.

Корисничко прилагодување: Find all your user settings and customizations conveniently located in the top right corner of your screen. Choose your preferred language from a growing list of supported languages to personalize your Raydium experience.

Баг Баунти: Join the bug hunt and help improve Raydium’s performance. Report bugs to earn a chance at 800 RAY per Beta week from the prize pool. To ensure fairness, Raydium reserves the right to disqualify users who misuse the bug reporting form.

Explore UI V3 (Beta) and elevate your Raydium journey today!

Тргувајте со крипто монети БИБИТ!

Bitcoin (BTC/USD) Soars Past $65,000

Since April 19th and 20th, coinciding with the Bitcoin halving event, there has been a noticeable equilibrium in supply and demand within the market. This equilibrium suggests a hesitancy among traders to determine the market’s next direction, likely in anticipation of the event’s outcome. Following the completion of the halving event, the market has exhibited a gradual upward trajectory in price. As of recently, the Bitcoin market has reestablished support above the $65,000 threshold, indicating a stabilizing trend. Presently, the market appears to be approaching equilibrium.

Податоци за пазарот на биткоин

  • BTC/USD Price Now: $65,978
  • BTC/USD Market Cap: $1.3 trillion
  • BTC/USD Circulating Supply: 19.7 million
  • BTC/USD Total Supply: 19.7 million
  • BTC/USD CoinMarketCap Ranking: #1

Bitcoin (BTC/USD) Soars Past $65,000, But Trading Volume Remains Low

Клучни нивоа

  • Отпорност: 70,000 75,000 долари, 80,000 XNUMX долари и XNUMX XNUMX долари.
  • Поддршка: 60,000 55,000 долари, 50,000 XNUMX долари и XNUMX XNUMX долари.

The Bitcoin Market Through the Lens of Indicators

The Bitcoin market is currently showing signs of an upward trend, albeit progressing at a measured pace. While price action indicates a gradual increase, resistance has become apparent near the $66,000 mark, slightly below the 20-day moving average. Despite the nuanced progress in the bull market, demand currently surpasses supply. However, a notable concern arises from the trading volume since April 19th. The volume of trade indicator reveals a series of three consistently small histograms since that date. Although, according to this крипто сигнал, trading volume has been low, demand continues to outstrip supply, resulting in market price rallies.

Bitcoin (BTC/USD) Soars Past $65,000, But Trading Volume Remains Low

BTC/USD Price Prediction: 4-Hour Chart Analysis 

Анализирајќи ја табелата од 4 час, we observe a resistance zone ranging from $66,000 to $66,500. Price action has stabilized within this range as bulls and bears engage in a balanced struggle. Notably, bearish positions around this level appear to be facing bullish pressure, evident in the consistent formation of higher lows by the bulls. A surge in trading volume could inject momentum into the market and potentially accelerate the ongoing bullish trend.

Тргувајте со крипто монети на BYBIT!