Tamadoge (TAMA/USD) fortsetter å sveve etter siste fall

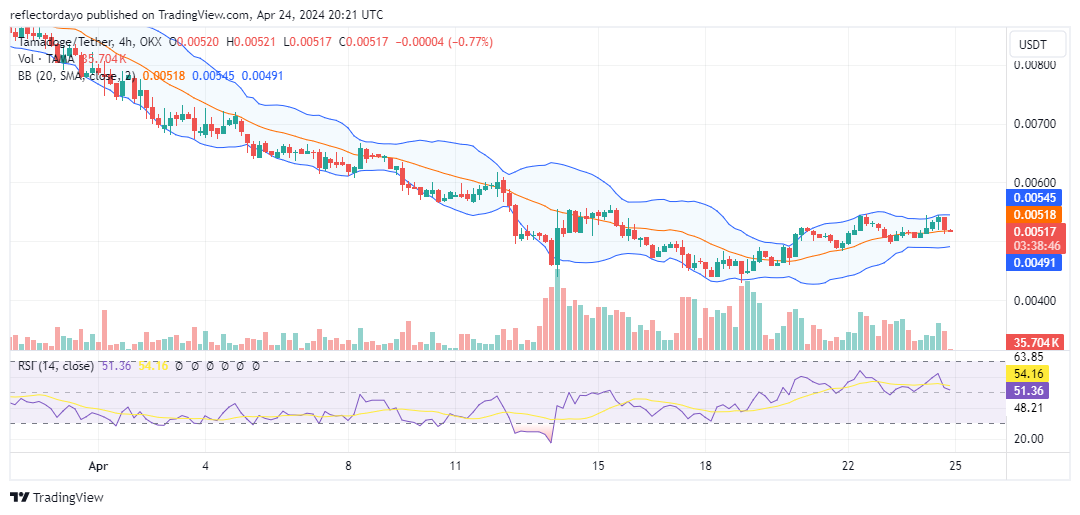
Following a bullish intervention at the $0.0045 price level, the TAMA/USD market has continued its upward trajectory, consistently forming higher lows and surpassing the $0.005 price threshold. Despite breaching this pivotal level, the market has encountered a minor support level above $0.005. However, new concerns have emerged as we observe resistance around the $0.0055 price mark. The TAMA/USD market has experienced rejection from this level on two occasions, with the most recent instance occurring in the current trading session. Consequently, the market is now seeking to establish another higher support level, targeting the 20-day moving average at $0.00518.

Nøkkelnivåer

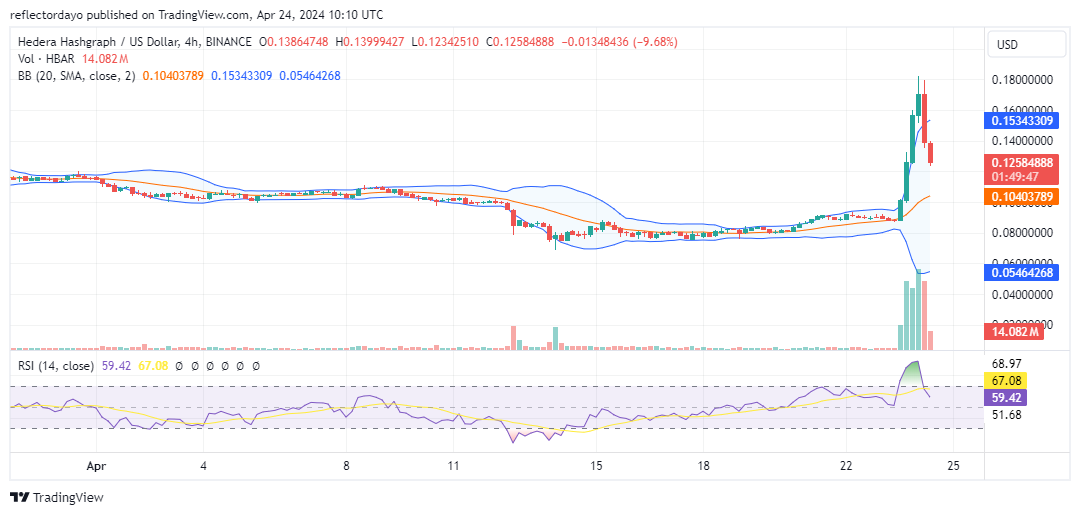
  • Motstand: $0.013, $0.014 og $0.015.
  • Støtte: $0.0045, $0.0040 og $0.0035.

Tamadoge (TAMA) Continues to Soar After Recent Dip

TAMA/USD Prisanalyse: Indikatorenes synspunkt

The market indicator suggests the potential for consolidation around the $0.00518 price level. Upon examination of the Bollinger Bands indicator, it is evident that the bands have transitioned from an upward trend to a horizontal movement. Additionally, traders appear to be establishing support around the 20-day moving average, indicating a minor deviation from the previous low of $0.00509. The Relative Strength Index (RSI) line has retraced to the midpoint of the indicator, reflecting a balanced market characterized by equilibrium between demand and supply.

Tamadoge (TAMA) Continues to Soar After Recent Dip

Tamadoge Short-Term Outlook: 1-times diagram

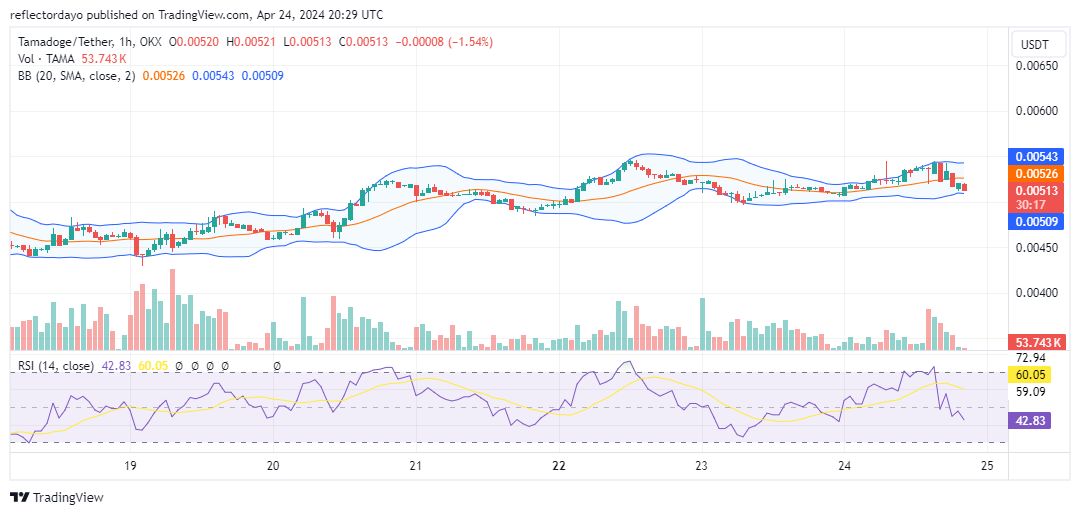
As the market seeks support at $0.00518, there is a notable decrease in trading volume. This decrease suggests that the market is entering a consolidation phase. Should the bulls establish a strong foothold at this level, it could pave the way for a breakout above the critical resistance point of $0.0054 in due course.

Kjøp Tamadoge!

Vil du ha en mynt som vil være 100 ganger mer verdifull i løpet av de neste månedene? Det er Tamadoge. Kjøp TAMA i dag!

Jupiter Project: A Guide to JUP

Jupiter (JUP) is an advanced swap aggregation engine built on the Solana blockchain. It facilitates essential liquidity infrastructure for the Solana ecosystem and offers a comprehensive suite of DeFi products. Some of the features of Jupiter include Limit Order, DCA/TWAP, Bridge Comparator, and Perpetuals Trading.

The Jupiter token (JUP): Fueling the Fires of the Jupiter DEX

The JUP token is the lifeblood of the Jupiter DEX. Imagine it as the key that unlocks the Jupiter vault, granting holders a say in the platform’s future through voting rights. But the power doesn’t stop there. JUP fosters a thriving community by rewarding members with scheduled airdrops, a welcome rainmaker in the cryptoverse.

There’s a finite number of JUP tokens in existence—10 billion, to be exact. These are meticulously distributed to fuel the core team, strategic reserves, and liquidity, ensuring the smooth operation of the exchange. But worry not, the community isn’t left out. A portion is specifically allocated for those who make Jupiter tick!

Holders become galactic governors, shaping the platform’s destiny through the Jupiter DAO. We shower the community with 4 billion JUP tokens through regular airdrops, a crypto rainmaker that nourishes active users. A portion fuels the core team and strategic reserves, ensuring our longevity and forging powerful partnerships. The best part? JUP empowers community-driven initiatives through DAO-managed grants. JUP’s value isn’t just about utility; it ripples outward, fostering a vibrant community within Jupiter and the wider cryptosphere.

Welcome to the Jupiter Exchange: Your Stellar Cryptocurrency Oasis

Forget the crowded exchanges; Jupiter Exchange is your celestial haven in the vast crypto cosmos. Jupiter offers a universe of features, from comprehensive services to an unparalleled user experience. The platform is said to be a constellation of advantages, setting us light years ahead of the competition.

Holocryptic Defense:

Imagine your assets guarded by celestial sentinels. That’s the power of Jupiter’s cutting-edge holocryptic encryption. Jupiter Exchange erects an impenetrable barrier against cyber threats, keeping your digital treasures safe and sound.

Guardian of Access: Vigilance at its Finest

Multi-factor authentication becomes a multi-layered guardian in Jupiter Exchange. Jupiter employs a phalanx of security measures to repel unauthorized access, ensuring your account remains firmly within your grasp.

Intuitive Exploration: Charting the Course with Ease

Jupiter’s user-friendly interface is your launchpad into the crypto market. Whether you’re a seasoned trader or a curious newcomer, navigating Jupiter Exchange is effortless. It’s like setting sail on a user-friendly spacecraft, allowing you to explore the cosmic market with grace and confidence.

Jupiter Project: A Guide to JUP

Unlock the Celestial Codex: Knowledge is Power

At Jupiter Exchange, powerful charting tools become celestial maps in your hands. Decipher the market’s movements with ease, make informed decisions with confidence, and wield the power of comprehensive analysis at your fingertips.

Diverse Asset Galaxy: A Universe of Opportunities

Jupiter offers a sprawling expanse of cryptocurrencies, creating a vast celestial canvas for your exploration. Trade a diverse array of digital assets, each representing a unique opportunity in the ever-evolving DeFi landscape. Jupiter Exchange is your gateway to a universe of possibilities.

Velocity in Trading: Lightspeed Execution

Jupiter has a lightning-fast trading engine, propelling trades at unimaginable speeds. Experience prompt and seamless execution, letting you navigate the market with unparalleled velocity and reach uncharted territories faster than ever before.

Jupiter (JUP) Market Metric Data

  • JUP/USD Price Now: $1.2
  • JUP/USD Market Cap: $1.6 billion
  • JUP/USD Circulating Supply: 1.4 billion
  • JUP/USD Total Supply: 10 billion
  • JUP/USD CoinMarketCap Ranking: #62

Avsluttende refleksjoner

In the vast galaxy of cryptocurrency platforms, Jupiter Exchange shines brightly as a paragon of quality. Its unwavering commitment to robust security measures, user-friendly interface, diverse selection of assets, and responsive customer service combine harmoniously, forming a constellation of qualities that positions it as a prime choice for your trading endeavors.

Handl kryptomynter på BYBIT!

Changpeng Zhao vs. DOJ: DOJ krever 36-måneders fengsel

In a landmark case that has gripped the cryptocurrency world, Changpeng "CZZhao, the founder of the renowned digital currency exchange Binance, faces a potential three-year prison sentence. The U.S. Department of Justice (DOJ) has aggressively pursued a 36-month incarceration term for Zhao, who has confessed to violating the Bank Secrecy Act.Changpeng Zhao vs. DOJ: DOJ krever 36-måneders fengsel

Alvorlighetsgraden av Zhaos transgressions has caused the DOJ to seek a sentence exceeding the initial 18-month plea deal. The prosecution’s argument rests on the substantial impact of Zhaos failure to implement an effective anti-money laundering (AML) program at Binance. This lapse enabled the platform to serve as a conduit for various illicit activities, including transactions from darknet markets and proceeds from ransomware attacks.

Changpeng Zhao Should Only Get Probation: Tiltalte advokater

I motsetning, Zhaos forsvarsteam argues against imprisonment, citing his significant slutt payment and acknowledgment of responsibility. They propose probation with muligheten til home confinement in Abu Dhabi as an alternative to incarceration.

De DOJ filing underscores the broader implications of Zhaos sentencing, portraying it as a cautionary message to the global community regarding the consequences of disregarding U.S. laws. The case understreker nødvendigheten av stringent compliance within the rapidly expanding crypto industry, often likened to the "Wild Westdue to its lack of regulation.

As the legal proceedings progress, the DOJ highlights the unprecedented magnitude of Zhaos misconduct. The filing outlines how Binance s lax AML measures facilitated the obfuscation of cryptocurrency origins and ownership, enabling a range of financial crimes.

Furthermore, the sentencing memo criticizes the current Sentencing Guidelines for Bank Secrecy Act violations, arguing that they fail to address the severity of crimes that pose a threat to nasjonal sikkerhet. Dette reflects a growing sentiment that the cryptocurrency sector must be held to higher standards of accountability to protect both consumers and financial system integrity.

With a $50 million fine already agreed upon, attention now turns to the rettens avgjørelse om Zhaos fate. The outcome of this case is poised to establish a precedent for handling legal breaches in the crypto space, signaling a new era of enforcement and accountability.

As the crypto community awaits the final sentencing on April 30, the question lingers: will Zhaos case serve as a cautionary tale that reshapes the industriens approach to legal compliance? Only time will tell.

Når du handler i kryptomarkedet, trenger det ikke være det "treff eller bom." Beskytt porteføljen din med handler som faktisk gir resultater, akkurat som premien vår kryptosignaler på Telegram.


Interessert i å lære å handle krypto dag? Få all informasjonen du trenger her

Sammensatt opplevelser bearish breakout fra symmetrisk trekant

Markedsanalyse – Prisen slår stor motstandssone

Compound has just experienced a bearish breakout from a symmetrical triangle on the daily chart. Prior to the breakout, the Hull butterfly indicator signalled a price decline with its red hue. Compound (COMPUSD) has been locked in an enduring struggle with resistance levels, particularly evident around the $74.460 threshold, spanning nearly two years. Despite concerted efforts, the price has found it challenging to breach this pivotal barrier, with indications of resistance dating back to May 2022.

Sammensatte nøkkelenivåer

Etterspørselsnivåer: $106.000 $87.540, $74.460
Forsyningsnivåer: $ 30.270, $ 26.000, $ 25.000

Sammensatt opplevelser bearish breakout fra symmetrisk trekant
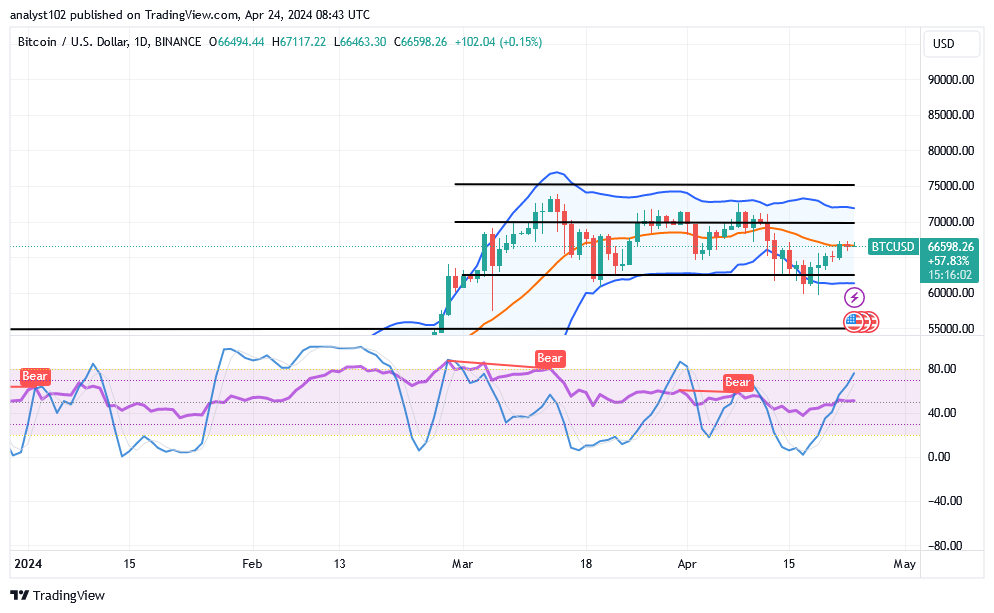
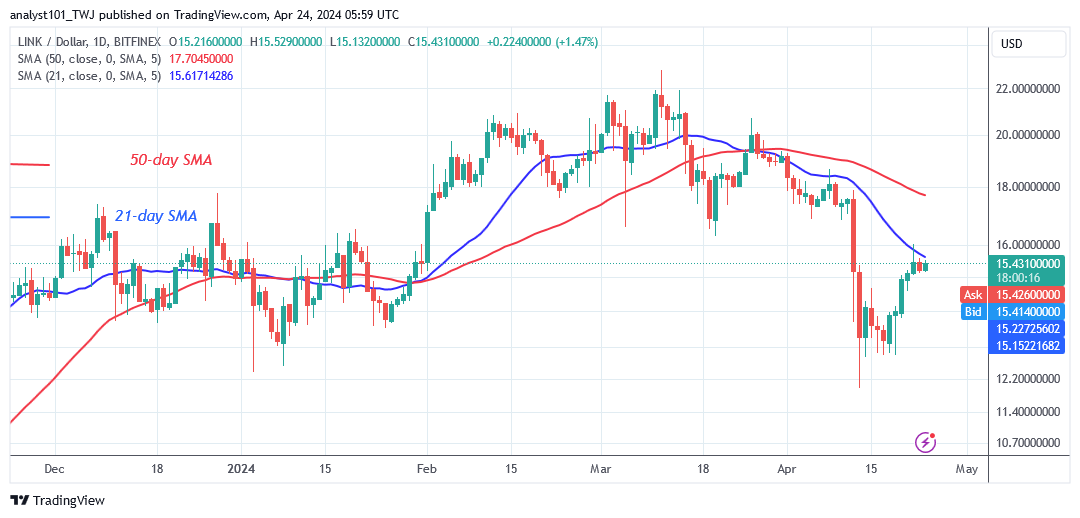
The demand zone at $30.270 has emerged as a stalwart bastion against further price depreciation. With each interaction, this level has spurred bullish reversals, contributing to a sustained period of price consolidation within the confines of $74.470 and $30.270.

However, March brought a paradigm shift as bullish sentiment surged amidst the crypto community. The subsequent formation of a symmetrical triangle following the March ascent above $74.470 signaled heightened market volatility, culminating in a bearish breakout that breached the supporting trendline on the daily chart.

Prior to the formation of the Symmetrical triangle, Compound’s price propelled above the resistance zone at $74.400. Nonetheless, this bullish fervor was short-lived, as the price encountered immediate resistance at $97.540, precipitating a swift downturn.

The subsequent formation of a symmetrical triangle following the March ascent signaled heightened market volatility, culminating in a bearish breakout that breached the supporting trendline on the daily chart.

Sammensatt opplevelser bearish breakout fra symmetrisk trekant

Markedsforventning

Looking forward, market sentiment remains cautiously optimistic, despite indications of a downward trend from the Hull Butterfly Indicator. While recent bullish activity has injected optimism, there is speculation regarding a potential pullback phase, with market participants eyeing a selloff targeting the last swing low of $43.000.

Du kan kjøpe Lucky Block her. Kjøp LBLOCK

Merknadercryptosignals.org  er ikke en finansiell rådgiver. Gjør forskningen din før du investerer midlene dine i en finansiell eiendel eller presentert produkt eller begivenhet. Vi er ikke ansvarlige for investeringsresultatene dine.

Shiba Inu Bulls møter hindring med selgere som sannsynligvis vil ta sin tur

Markedsanalyse – Selgere er klare til å ta ansvar

Shiba Inu-okser møter hindringer, med selgere som sannsynligvis vil bytte. Shiba Inu har fanget interessen til mange investorer. Som enhver annen kryptovaluta er Shiba Inu imidlertid ikke immun mot markedssvingninger. De siste ukene har vært vitne til en hard kamp mellom oksene og selgerne på Shiba Inu-markedet.

Kjøperne har vist sterk motstandskraft, og har satt opp en alvorlig kamp mot selgerne. Shiba Inu handler for tiden på det betydelige nivået på $0.0000270, og leter desperat etter en måte å unnslippe presset nedover. Oksene vippes for øyeblikket ned i en synkende flaggkanal, noe som indikerer en konsolideringsfase etter en periode med bullish ekspansjon.

Shiba Inu nøkkelnivåer

Motstandsnivåer: $ 0.00003700, $ 0.00002900
Støttenivåer: $ 0.00001500, $ 0.00000600

Shiba Inu Bulls møter hindring med selgere som sannsynligvis vil ta sin tur

Oksenes reise begynte fra det betydelige nivået på $0.00000900. De var heldige nok til å få styrke og klare seg med en betydelig likviditetsrensing. Kryptomarkedet var vitne til en økning i kjøpsaktivitet, og presset prisen på Shiba Inu høyere. Men da kjøperne nådde sine grenser, klarte de ikke å presse prisen ytterligere. Dette førte til en gradvis respons på salgspress, noe som resulterte i en synkende kanaldannelse.

Shiba Inu Bulls møter hindring med selgere som sannsynligvis vil ta sin tur

Markedsforventning

Den stokastiske oscillatoren antyder at kjøperne for øyeblikket holder seg nær det overkjøpte området. Dette indikerer at de kan miste momentum og potensielt kan forlate markedet. I tillegg har Moving Averages Convergence and Divergence (MACD) krysset ut, noe som signaliserer en potensiell reversering i pristrenden.

Tatt i betraktning disse indikatorene, er det sannsynlig at kjøperne vil trekke seg ut av scenen etter å ha handlet nær den betydelige sonen på $0.0000028000. Hvis dette scenariet utspiller seg, er det sannsynlig å se prisen på SHIBUSD gå tilbake til den nedre siden av den synkende kanalen. Dette vil gi en mulighet for selgere til å gjenvinne kontrollen og potensielt presse prisen ytterligere ned.

Du kan kjøpe Lucky Block her.  Kjøp LBLOCK

OBS: cryptosignals.org er ikke en finansiell rådgiver. Gjør forskningen din før du investerer midlene dine i en finansiell eiendel eller presentert produkt eller begivenhet. Vi er ikke ansvarlige for investeringsresultatene dine.

Bitcoin (BTC/USD)-markedet velter seg oppover, og setter ned

Prediksjon av Bitcoin - 24. april

The kind of price actions that have been showcasing in the BTC/USD markedsoperasjoner as of this analysis, demonstrates that the price wallows upward, putting in slows.

The market’s rebound to the upward has been firmly adhering to a trade zone where long-position movers must exert significant effort to secure additional recovery motions. If the price would still remain in the middle of the Bollinger Band, the current trading movement velocity suggests that the advances to the north may not be receiving the timely positive push needed to sustain them.

BTC / USD Market
Nøkkelnivåer:
Motstandsnivåer: $ 70,000, $ 72,500, $ 75,000
Støttenivåer: $ 62,500, $ 60,000, $ 57,500

BTC / USD - Dagskart
The BTC/USD daily chart presents a show that the market is wallowing upward, putting in slows.

The lower Bollinger Band trend lines have held, providing a strong crypto signal that points to $60,000 as the next critical level at which the price should find support. The stochastic oscillators are being tentatively veering to the north while feigning a descent entry for bulls.
Bitcoin (BTC/USD)-markedet velter seg oppover, og setter ned

Will the current positive momentum speculation in the BTC/USD trade continue?

The positivity pace on the crypto signal on the BTC / USD-markedet operations may tend to prolong for a while, especially if the price doesn’t give back to a sudden fall-off, as the crypto economy wallows upward, putting in slows.

The blue part of the stochastic oscillators has traversed northward to a notable higher spot nearing the line of 80 to denote that further pushes to the upside seem not to build on stable moves soon. Investors may still hold to the way back to $70,000 and even a bit above before tending to returning to a correction.

Bears may still need to be extra cautious in the area of the middle Bollinger Band. To open up some areas of entry for sellers, a series of rejections must occur below the $70,000 resistance line for a considerable amount of time.
Bitcoin (BTC/USD)-markedet velter seg oppover, og setter ned
BTC / USD 4-timers diagram
De BTC / USD 4-hour chart showcases the crypto-economic market wallows upward, putting in slows

The upward trend lines of the Bollinger Bands have continued to lead towards the $70,000 resistance line. At the 40-point, the stochastic oscillators are prone to repositioning and the potential for further building up. Points between the middle and he lower Bollinger Bands are liable to form the zones for the market to move to the north


Merknader: Cryptosignals.org er ikke en finansiell rådgiver. Gjør din forskning før du investerer midlene i noen finansiell eiendel eller presentert produkt eller begivenhet. Vi er ikke ansvarlige for dine investeringsresultater.


Du kan kjøpe Lucky Block her. Kjøp LBLOCK


Hedera Hashgraph (HBAR/USD) korrigerer etter sterk prisstigning

De Hedera Hashgraph Markedet har holdt seg relativt avgrenset i en lengre periode, selv om det har opplevd et marginalt bullish skifte ettersom volatiliteten økte litt. Ved å utnytte denne volatiliteten, drev okser markedet fra $0.07 prisnivå til $0.10. Siden 20. februar har kurssvingninger hovedsakelig skjedd rundt $0.10-merket, hovedsakelig favoriserte oppsidebevegelser, noe som indikerer bullish styrke.

Den 13. april fant markedet imidlertid støtte til $0.08. Fra kryptosignal på det daglige diagrammet oppdaget vi at dette støttenivået ble et sentralt nivå for å katalysere en annen prisstigning inn i prissonen på $0.15.

Hedera Hashgraph markedsdata

  • HBAR/USD Pris nå: $0.12
  • HBAR/USD Markedsverdi: 4.4 milliarder dollar
  • HBAR/USD sirkulerende forsyning: 35.7 milliarder
  • HBAR/USD Total forsyning: 50 milliarder
  • HBAR/USD CoinMarketCap-rangering: #24

Hedera Hashgraph (HBAR/USD) korrigerer etter sterk prisstigning

Nøkkelnivåer

  • Resistance: $ 0.16 0.17, $ 0.18 XNUMX og $ XNUMX XNUMX.
  • Støtte: $ 0.10 0.09, $ 0.08 XNUMX og $ XNUMX XNUMX.

Hedera Hashgraph Through the Lens of Indicators

Den nåværende bearish lysestaken signaliserer robust bearish momentum i markedet. Markedet nådde en topp på $0.18. Etter en periode med konsolidering med mindre endringer i oppadgående retning, griper mange langvarige investorer muligheten til å kapitalisere på markedets høye ved å ta fortjeneste. Gitt det rådende bearish momentumet, er det en mulighet for at det potensielt kan erodere gevinstene til det bullish markedet, og føre til en regresjon til rundt $0.10 prisnivå.

Markedets tendens til å vise flere svingninger oppover over $0.10-prisnivået enn under det siden 20. februar, understreker imidlertid den varige styrken til oksene. Mens plutselige, sterke prisbevegelser som denne typisk utløser profitttaking, antyder den underliggende bullish sentimentet at okser kan finne støtte på et høyere nivå, muligens rundt $0.12-prisnivået.

Hedera Hashgraph (HBAR/USD) korrigerer etter sterk prisstigning

HBAR/USD Prisprediksjon: 4-timers diagramanalyse 

Historisk sett er prisgrensen på $0.12 har betydning for Hedera Hashgraph som et relevant nivå der bullish intervensjon kan forekomme. Men gitt dagens rådende bearish momentum, kan markedet stabilisere seg på dette nivået når etterspørsel og tilbud når likevekt. Denne konsolideringsfasen kan potensielt redusere det bearish momentumet, og baner vei for en gjenoppblomstring av oppadgående bevegelser, med sikte på å gjenvinne prisgrensen på $0.18.

Handl kryptomynter på BYBIT!

Chainlink-stopper glir over $12.75 men forblir rekkeviddebundet 

Chainlink (LINK) Langsiktig analyse: Bearish
Chainlink's (LINK) pris has slipped to the bearish trend zone but remains range-bound. The crypto has been recovering from its prior downturn. The altcoin rallied to a high of $22.83 before falling to a low of $11.96. Bulls bought the dips, halting the slide above the $12.75 support. The selling pressure has decreased over the past week and above the current $12.75 support level.

The altcoin is trading in a narrow range between $12.75 and the moving average lines, which serve as resistance at $16. Currently, the rising trend is encountering resistance at the moving average lines. If the LINK price is rejected at the recent high, it will continue to trade below the moving average lines. On the other side, the altcoin will resume a bullish trend if buyers keep the price above the moving average lines. lenke will return to the prior high of $22.83.  

Chainlink-stopper glir over $12.75 men forblir rekkeviddebundet
LINK / USD - Daglig diagram

Tekniske indikatorer:  
Store motstandsnivåer - $ 8.00, $ 10.00, $ 12.00
Store støttenivåer - $ 6.00, $ 4.00, $ 2.00
 
 Chainlink (LINK) indikatoranalyse 
Given the current price rally, LINK price bars are now above the moving average lines on the 4-hour chart. The altcoin’s surge was short-lived since it was rejected at its peak of $16. Furthermore, it is still limited to the range below the moving average lines.
 
Hva er neste retning for Chainlink (LINK)? 
Chainlink’s price has recovered from its recent fall but remains range-bound. The 4-hour chart shows that it is consolidating above the $12.80 support but below the $16.00 resistance level. The bulls bought declines from the previous low, but they found support at $12.75. The altcoin has surged but failed to break over the $16 resistance level.

The altcoin will be compelled to move in a range below its recent high. In other words, kryptosignalet will remain range-bound as the altcoin declines and consolidates.  

Chainlink-stopper glir over $12.75 men forblir rekkeviddebundet
LINK/USD – 4-timers diagram


Du kan kjøpe Lucky Block her. Kjøp LBLOCK
 
Merknader: Cryptosignals.org er ikke en finansiell rådgiver. Gjør din undersøkelse før du investerer midlene dine i noen finansiell eiendel eller presentert produkt eller begivenhet. Vi er ikke ansvarlige for investeringsresultatet ditt

Pepe-markedet (PEPE/USD) stiger; Takler nå motstand $0.000008

The bullish momentum witnessed in late February propelled the market to reach a notable peak at the $0.00001 price level. This surge in bullish activity was robust, contributing to heightened volatility across the market. Despite attempts by bears to capitalize on this volatility, they contended with the prevailing bullish sentiment. Consequently, the market traded sideways within a broad price channel, fluctuating between approximately $0.000001 and $0.0000047.

However, in recent days, following the market’s establishment of support around $0.0000048, the price of the Pepe market has experienced an upward trajectory. Nevertheless, the pertinent question remains: can the bulls sustain this upward momentum in the market?

The Pepe Market Data

  • PEPE/USD Price Now: $0.0000084
  • PEPE/USD Market Cap: $3,354,099,527
  • PEPE/USD Circulating Supply: 420.7 Trillion PEPE
  • PEPE/USD Total Supply: 420.7 Trillion PEPE
  • PEPE/USD CoinMarketCap Ranking: #37

The Pepe Market (PEPE/USD) Soars; Now Tackle Resistance $0.000008

Nøkkelnivåer

  • Resistance: $ 0.000009 0.00001, $ 0.000011 XNUMX og $ XNUMX XNUMX.
  • Støtte: $ 0.0000048 0.0000040, $ 0.0000038 XNUMX og $ XNUMX XNUMX.

 The Pepe Market Through the Lens of Indicators

Despite the current bullish momentum in the Pepe market outlook, resistance has emerged at the $0.000008 level. This price point has held significant importance since March, with market prices consistently hovering around this threshold. Notably, a pattern of descending peaks has emerged, with notable peaks observed at $0.000010, $0.0000092, and currently approaching the $0.000008 mark. These descending peaks indicate a buildup of bearish momentum, signaling a shift towards a bearish trend. The support level has consequently shifted to $0.0000048.

Bør Pepe market encounter rejection once again at the $0.000008 price level, it could signify preparation for a sustained bearish trajectory.

The Pepe Market (PEPE/USD) Soars; Now Tackle Resistance $0.000008

PEPE/USD Price Prediction: 4-Hour Chart Analysis 

Analyserer markedet gjennom linsen of the 4-hour chart, it’s evident that bears are exerting notable influence at the $0.000008 price level, as evidenced by the market’s failure to breach this threshold over the past three sessions. Adding to the potential buildup of bearish momentum is the increasing market volatility, as indicated by the expanding Bollinger Bands. Furthermore, the Relative Strength Index (RSI) signals a correction from overbought territory. This confluence of factors suggests a potential for price reversal, as traders may leverage these kryptosignaler to inform their decision-making processes.

Handl kryptomynter på BYBIT!