Litecoin (LTC/USD) Market Hovers Below $90, Tending a Pause

Prognoza ceny Litecoina - 23 kwietnia

Bulls have been making some efforts toward formulating a basis above the point of $70 in the Litecoin handel versus the valuation of the US dollar, as the current financial situation reports that the price hovers below $90, tending to pause.

Technically speaking, as at the time of this article, neither the seller’s nor the buyer’s capacity may develop in a clear way beyond its existing hovering range. However, bulls are likely to remain in control even outside the confines of the Bollinger Bands if the market’s price moves away from the current direction in the long run.

Rynek LTC / USD
Kluczowe poziomy:
Poziomy oporu: $ 90, 100, 110
Poziomy wsparcia: 70, 65, 60

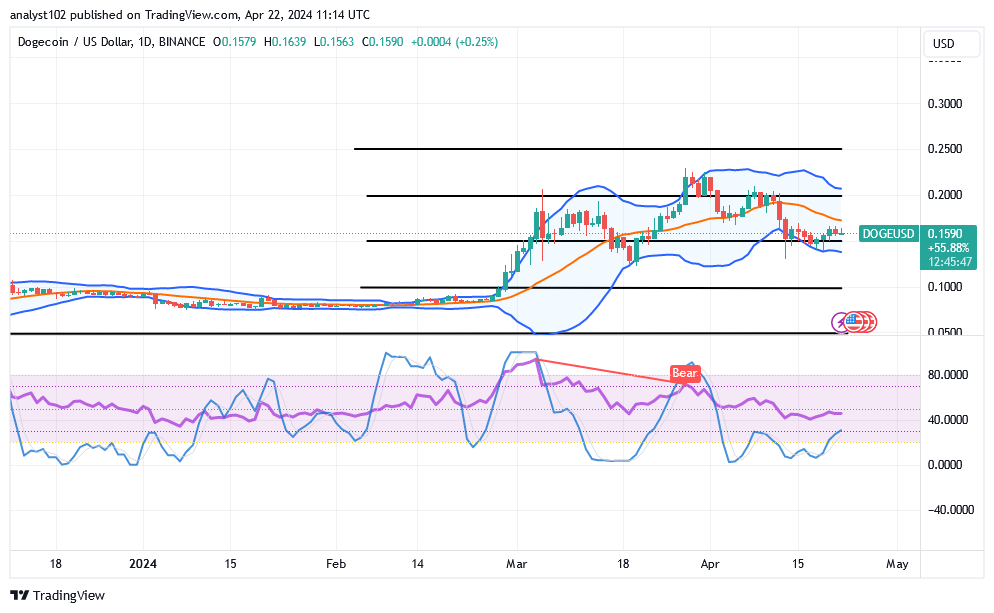
LTC / USD - Wykres dzienny
The LTC/USD daily chart showcases that the crypto-economic trade hovers below $90, tending to pause.

The Bollinger Band trend lines have been making some attempts at trying to curve back northward from the lower end. The candlesticks formation around the lower Bollinger Band has been generating signs toward getting a firm base for the price to make formidable upsurges. The stochastic oscillators have systemically stretched northbound, placing around 40 to 50 points.
Litecoin (LTC/USD) Market Hovers Below $90, Tending a Pause

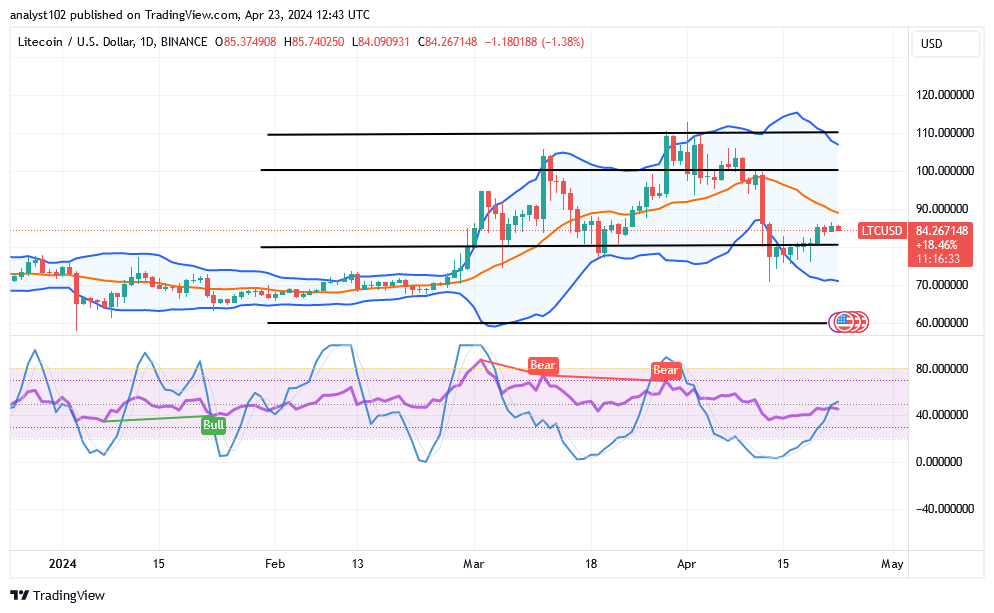
If the price of LTC/USD market will have to go further under, which support id likely to hit?

If there’ll be more room for the Rynek LTC / USD to shift under, the support value line around $70 will likely be revisited, given that the crypto-economic market hovers below $90 as of the writing of this piece, tending to pause.

The stochastic oscillators are in crucial zones that indicate the road on which the price may revert to a downward path, so the LTC/USD market long-position pushers will need to exert a great deal of work to push the market line northward from its current trading spot. However, over time, there is a chance that the price will continue to rise above the $70 mark.

As it has been observed, the resistance line of $90 has not to be breached northward if the activities of bulls have to be decimating in a way. If the price touches the middle Bollinger Band with an active falling force will generate decent entries for shorting position orders if buyers turn out to get weakened around the indicator.
Litecoin (LTC/USD) Market Hovers Below $90, Tending a Pause
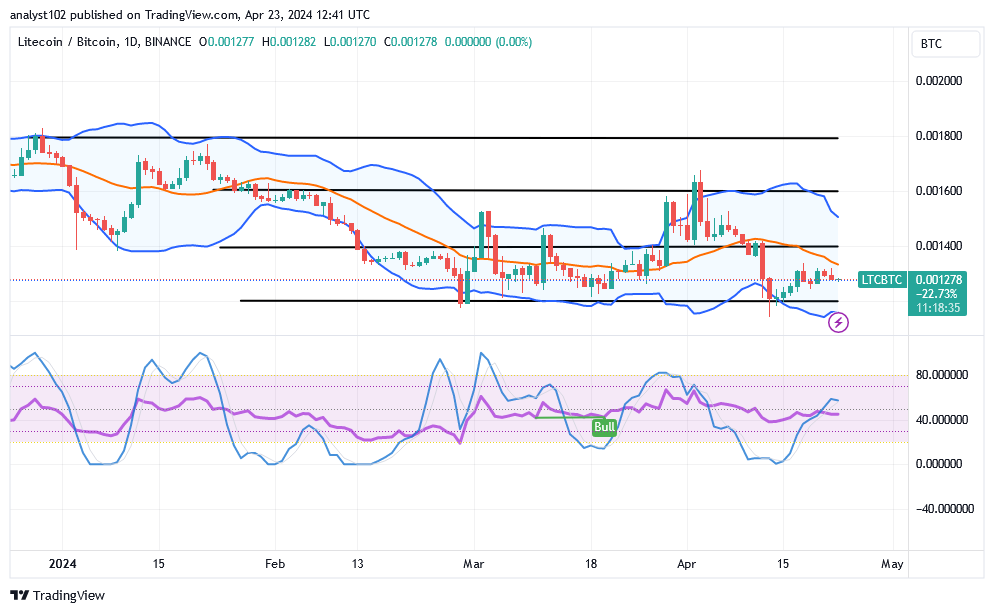
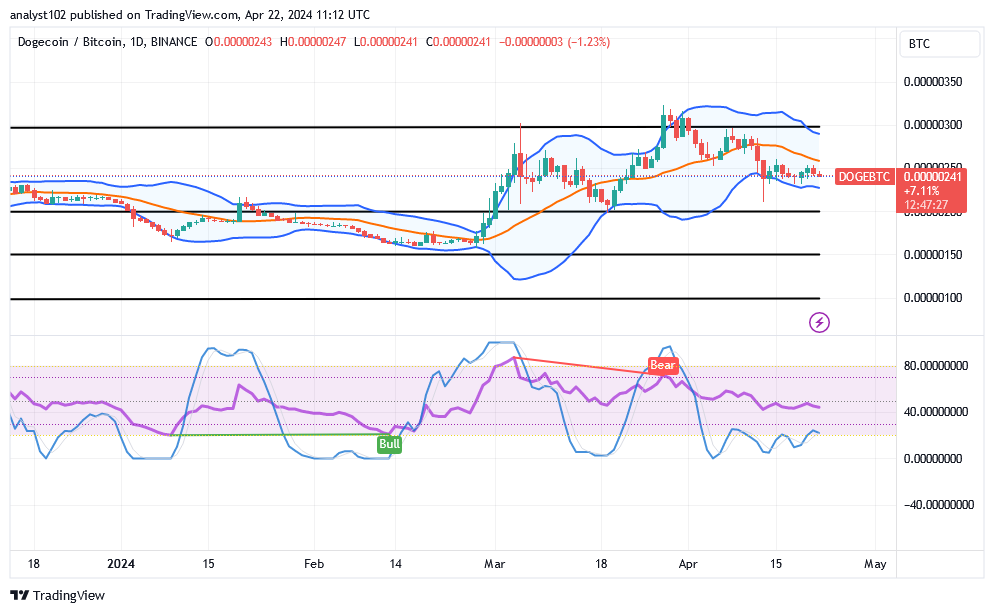
Analiza cen LTC / BTC
In contrast, the Litecoin market hovers below the middle Bollinger Band against the point of Bitcoin, tending to pause.

In order to produce the line where rebounding price actions in the weight of the base cryptocurrency to counter its counterpart instrument can occur, the Bollinger Band trend lines are being moved to their bottom portion. The fact that the stochastic oscillators are in a northbound-crossing state indicates that the foundational cryptocurrency is preparing to gain greater traction. This indicates that the general conclusion is still that purchasing forces will win in the majority of the ensuing turbulent moves.

Uwaga: Cryptosignals.org nie jest doradcą finansowym. Przeprowadź badania przed zainwestowaniem środków w jakikolwiek składnik aktywów finansowych lub prezentowany produkt lub wydarzenie. Nie ponosimy odpowiedzialności za Twoje wyniki inwestycyjne.


Możesz kupić Lucky Block tutaj. Kup LBLOCK

Prognozy cen transakcji Dash 2 na dziś, 24 kwietnia: D2TUSD zmienia kierunek na plusy

Dash 2 Trade Price Forecast: D2TUSD Changes Direction to the Upsides (April 24)
Połączenia D2TUSD price is mounting the upside ladder again while recovering from the low dips by the sell traders. The crypto is currently showing positive signs that the bulls are still active.
However, the currency pair could grow further if the buy traders can break up the $0.00505 previous high level, maintaining a further growth potential for the buy traders.

Kluczowe poziomy:
Poziomy oporu: $ 0.00500, 0.00600, 0.00700
Poziomy wsparcia: 0.00300, 0.00200, 0.00100

D2T (USD) Trend długoterminowy: Niedźwiedzi (4H)
Połączenia D2TUSD pair is making its way to the resistance area in its long-term outlook. The price bars can be seen below the resistance trend levels confirming its bearishness, trying to change its direction to the upsides by resisting the sell traders.
Prognozy cen transakcji Dash 2 na dziś, 24 kwietnia: D2TUSD zmienia kierunek na plusy
The sustained bearish pressure at the $0.00368 support level in the previous action has made the crypto price remain below the supply trend lines in its recent high.

Today, the bulls changed their orientation and aggressively moved the D2TUSD price up to the $0.00372 supply value below the moving average lines as the 4-hourly chart opens.

Thus, the bullish correction at the mentioned supply value returns the buy investors to the market for the next increase race. This breakout is possible to give buyers a significant footing to bolster further rally. Meanwhile, traders can buy the token during the current trend at a lower rate for more gains ahead.

Dodatkowo Dash 2 Handluj price remains in an uptrend on the daily signal. Therefore, the bulls could aim at the psychological level of $0.01000 resistance value in the days ahead as the crypto changes direction to the upside in its long-term perspective.

D2T (USD) Trend średnioterminowy: Byczy (1H)
On the medium-term outlook, the market price of D2TUSD is currently trading in a bullish market zone. This is due to the high inflows of the buy traders.
Prognozy cen transakcji Dash 2 na dziś, 24 kwietnia: D2TUSD zmienia kierunek na plusy
The bullish impact on the crypto to the $0.00380 supply level during the previous action has sustained its firmness above the supply levels in its recent price level.

Today, after completing the downward pressure at the $0.00368 support level, the bulls made an upward move to the $0.00372 high value above the moving average-9 lines as the 1-hourly chart opens. The cryptocurrency looks promising as the bulls remain dominant in the market at the moment.

If the bulls should increase their price action, and bullish momentum is sustained far above the previous resistance 0.00398 level, further bearish sentiment will be hibernated.

In addition, the daily stochastic indicates an upward trend, this means that the buy investors may likely continue with the bull run and the target might be the $0.01000 resistance level soon in its medium-term perspective.

Possibly the most useful technique for enhancing your trading success is backtesting.


Chcesz monety, która ma ogromny potencjał ogromnych zwrotów? Ta moneta to Dash 2 Trade. Kup teraz D2T.

Wypływy kryptowalut utrzymują się przez drugi tydzień w związku z obawami dotyczącymi stóp procentowych

Crypto investment products have witnessed a second consecutive week of crypto outflows totaling $206 million, as reported by CoinShares. This decline coincides with a slight decrease in trading volumes of Exchange-Traded Products (ETPs), now stojący at $18 billion. Interestingly, these figures represent only 28% of total Bitcoin trading volumes, contrasting sharply with the 55% recorded just a month earlier.

Analysts attribute this waning interest among ETP and Exchange-Traded Fund (ETF) investors to the Federal Rezerwa indication of maintaining current high-interest rates for an extended period.

US Records Notable Crypto Outflows: $244 Million Trickle Out of Bitcoin ETFs

In the United States, sentiment remains predominantly negative, with ETFs experiencing outflows of $ 244 mlnEstablished ETFs have został trafiony hardest, while newly issued ETFs continue to attract capital, albeit at a slower pace compared to previous weeks. In contrast, Canada and Switzerland have seen inflows of $30 million and $8 million, respectively. Germany, however, reported minor outflows totaling $8 million.

Wypływy kryptowalut utrzymują się przez drugi tydzień w związku z obawami dotyczącymi stóp procentowych
Zdjęcie za pośrednictwem CoinShares

Bitcoin, wiodąca kryptowalutateż widział outflows, kwotę 192 mln dolarów. Surprisingly, this has not led to a significant increase in short-Bitcoin positions, with only a $0.3 million outflow from such positions. Ethereum, on the other hand, has continued its six-week streak of outflows, w sumie 34 milionów dolarów. 

There has been renewed interest in the altcoin sector, with inflows of $9 million last week. Litecoin i Ogniwo łańcucha have seen particularly significant inflows, with $3.2 million and $1.7 million, respectively.

Wypływy kryptowalut utrzymują się przez drugi tydzień w związku z obawami dotyczącymi stóp procentowych
Zdjęcie za pośrednictwem CoinShares

Blockchain equities have faced pressure as well, marking their 11th consecutive week of outflows totaling $9 million. Concerns regarding the impact of the upcoming halving event on mining companies have contributed to investor apprehension.

Standard Chartered Maintains $150,000 Bitcoin Price Prognoza

Despite these challenges, Geoff Kendrick, head of digital assets research at Standard Chartered, remains optimistic about Bitcoin's prospects. He reaffirms the banku ambitious price target of $150,000 for Bitcoin by year-end, citing the influx of capital into U.S. Bitcoin ETFs as a klucz czynnikiem. 

U.S. Bitcoin ETFs have attracted approximately $12 billion in net inflows since their inception in early 2024. Speaking to BNN Bloomberg, Kendrick said:

“The ETF inflows in the U.S. have really dominated the demand-supply metrics so far in 2024. This is significant in terms of the ETFs’ performance to date.”

This report highlights the intricate relationship between investor sentiment, regulatory expectations, and market dynamics in the ever-evolving landscape of cryptocurrency investments.

Handlując na rynku kryptowalut, nie musi tak być „trafienie lub chybienie”. Chroń swój portfel za pomocą transakcji, które faktycznie przynoszą rezultaty, tak jak nasza premia sygnały kryptograficzne na Telegramie.


Chcesz dowiedzieć się, jak handlować kryptowalutami? Zdobądź wszystkie potrzebne informacje tutaj

Decentraland (MANAUSD) odwraca się, gdy ceny unikają nowych minimów

Market Analysis – Prices Avoid New Lows

MANAUSD experienced a reversal as price action failed to register a new lower low. This indicates a potential shift in market sentiment as buyers are eager to take control.

Kluczowe poziomy MANAUSD

Poziomy popytu: 0.4250 $, 0.3270 XNUMX $
Poziomy dostaw: 0.5680 USD, 0.7900 USD

Decentraland (MANAUSD) odwraca się, gdy ceny unikają nowych minimówMANAUSD experienced a significant drop in mid-April 2024, causing the price to slightly breach the $0.4250 demand level and taking out existing liquidity below. Following the liquidity being taken, the price formed a failed low, indicating a decrease in selling pressure, which could potentially lead to a rise in price.

The 4-hour timeframe supports a bullish bias as it broke the structure upwards. The 4-hour Moving Average also aligns with the bullish bias, with the current price trading above it. Additionally, the daily Relative Strength Index shows the price below the 30.0 oversold region, indicating a potential buildup of bullish strength.

Decentraland (MANAUSD) odwraca się, gdy ceny unikają nowych minimów

Oczekiwania rynkowe

The price is anticipated to increase quickly as liquidity below the $0.4250 level is being absorbed. It is expected that the supply level at $0.5680 will be surpassed as the price seeks to access liquidity situated above that level.

Możesz kupić Lucky Block tutaj. Kup LBLOCK

NoteKryptosygnały.org  nie jest doradcą finansowym. Przeprowadź badania przed zainwestowaniem środków w jakikolwiek składnik aktywów finansowych lub prezentowany produkt lub wydarzenie. Nie ponosimy odpowiedzialności za Twoje wyniki inwestycyjne.

Mieszanka (COMPUSD) doświadcza niedźwiedziego odwrócenia

Market Analysis – Price Strikes Major Resistance Zone

Compound (COMPUSD) has been embroiled in a protracted battle with resistance, particularly around the $74.460 mark, spanning nearly two years. Despite persistent efforts, the price has struggled to breach this significant barrier, with the earliest signs of resistance emerging back in May 2022.

Conversely, the demand threshold at $30.270 has acted as a formidable line of defense against further price declines. Each encounter with this level has triggered bullish reversals, resulting in a prolonged period of price oscillation confined within the range of $74.470 and $30.270.

Poziomy klucza złożonego

Poziomy popytu: 106.000 87.540 USD 74.460 XNUMX USD, XNUMX XNUMX USD
Poziomy dostaw: $ 30.270, $ 26.000, $ 25.000

Mieszanka (COMPUSD) doświadcza niedźwiedziego odwrócenia

March brought an unexpected twist to the narrative as market bulls capitalized on the favorable conditions presented by the bullish crypto season, driving the price above the resistance zone at $74.400. Yet, this bullish momentum proved fleeting, as the price encountered swift resistance around $97.540, leading to a rapid downturn.

Furthermore, a bullish parallel channel emerged, facilitating the invalidation of the long-term resistance zone at $74.460. However, the euphoria was short-lived as the price swiftly crashed below the parallel channel upon reaching the resistance zone of $97.550, signaling a potential shift toward bearish market sentiment.

Mieszanka (COMPUSD) doświadcza niedźwiedziego odwrócenia

Oczekiwania rynkowe

Adding to the bearish outlook, the price currently resides below the Moving Average (Periods 9 and 21), further affirming the prevailing bearishness in the market and sending cautious crypto signals. Analysts anticipate a continuation of the downward trajectory, with the price expected to decline further towards the previous low on the daily chart at $43.000.

Możesz kupić Lucky Block tutaj. Kup LBLOCK

NoteKryptosygnały.org  nie jest doradcą finansowym. Przeprowadź badania przed zainwestowaniem środków w jakikolwiek składnik aktywów finansowych lub prezentowany produkt lub wydarzenie. Nie ponosimy odpowiedzialności za Twoje wyniki inwestycyjne.

Prognozy cen transakcji Dash 2 na dziś, 23 kwietnia: Cena D2TUSD napotyka opór na poziomie podaży 0.00380 USD

Dash 2 Trade Price Forecast: D2TUSD Price Finds Resistance at $0.00380 Supply Level (April 23)
Istnieje możliwość zakupu tzw D2TUSD pair as the price now finds resistance at the $0.00380 supply level while climbing the bullish ladder and going up at the moment. However, the price will move higher above the current resistance level, if buyers should exert more force into the price action in the market, the $0.00505 high trend line might be retested soon which may expose the coin price further to a $0.01000 upper high trend line, resulting to a good entry time for coin buyers.

Kluczowe poziomy:
Poziomy oporu: $ 0.00500, 0.00600, 0.00700
Poziomy wsparcia: 0.00350, 0.00300, 0.00250

D2T (USD) Trend długoterminowy: uparty (wykres 4H)
D2TUSD is in a bullish trend market in its long-term view. The bulls are about to take over and push us higher. There are multiple possible targets at this point, but the pair looks quite bullish here as we can see the coin price trading above the EMA-50.
Prognozy cen transakcji Dash 2 na dziś, 23 kwietnia: Cena D2TUSD napotyka opór na poziomie podaży 0.00380 USD
The bulls’ pressure on the cryptocurrency to the $0.00376 resistance level in the previous action has allowed it to retain its upward growth.

An increase to a $0.00380 high level above the EMA-9 approaching the overhead resistance as the 4-hourly chart opens today indicates that the traders are actively buying at this level.

This current trend will enable the price of Dash 2 Handluj to remain on the upside and rise or break out to the upside. This will enable buyers to hold a firm grip over the asset.

Furthermore, the market is pointing up on the daily stochastic; this will quicken the emergence of more buyers to move the price of D2TUSD up to a significant level on the upside which might hit the $0.01000 supply trend mark, thus bringing a positive sentiment among the coin traders and registering a buy signal for the coin traders as the market remain strongly bullish soon in its higher time frame.

D2T (USD) Trend średnioterminowy: uparty (wykres 1H)
Dash 2 Handluj market also trades in a bullish trend market in the medium-term outlook. This is due to the high impact of the long-term traders on the price flow.
Prognozy cen transakcji Dash 2 na dziś, 23 kwietnia: Cena D2TUSD napotyka opór na poziomie podaży 0.00380 USD
Utrzymująca się bycza presja na wysoki poziom 0.00377 USD w poprzedniej akcji doprowadziła do ostatniego szczytu monety.

Earlier today, after completing the sideway moves, the D2TUSD buyers successfully pushed the coin price up to a $0.00380 supply level above the two moving averages shortly after the 1-hourly chart opened.

The current price at the $0.00380 resistance level suggests the returns of the buy traders in the market. The market participants are responding to this pattern, and its breakout should offer a good buy entry opportunity.

W związku z tym para skierowana w górę na dzienny stochastyczny oznacza, że ​​presja zakupowa może trwać i sugeruje możliwe odbudowanie poziomu podaży na poziomie 0.01000 XNUMX USD w nadchodzących dniach w średnioterminowym przedziale czasowym.

Two-Factor Authentication (2FA), our newest feature, will increase the security of your Dash 2 Trade account!


Chcesz monety, która ma ogromny potencjał ogromnych zwrotów? Ta moneta to Dash 2 Trade. Kup teraz D2T.

Prognoza ceny Bitcoina: BTC/USD przekracza 66,000 XNUMX dolarów: czy nadszedł czas na wzrost?

Prognoza ceny bitcoinów (BTC) - 22 kwietnia

Patrząc na wykres dzienny, prognoza ceny Bitcoina (BTC) pokazuje pozytywne sygnały i prawdopodobnie w najbliższym czasie wzrośnie jeszcze bardziej.

Długoterminowy trend BTC / USD: Zwyżkowy (wykres dzienny)

Kluczowe poziomy:

Poziomy oporu: $ 80,000, 82,000, 84,000

Poziomy wsparcia: $ 52,000, 50,000, 48,000

Bitcoin Price Prediction: BTC/USD Trades Above $66,000; Time to Resume Higher?
BTCUSD - wykres dzienny

Według wykresu dziennego BTC / USD breaches $66,000 as the new week’s high beckons. The king coin is seen trading well within the 9-day and 21-day moving averages at $66,130. Moreover, the Bitcoin price is within touching distance of forming a new daily high above the previous high of $66,000, which is quite remarkable.

Prognoza ceny Bitcoina: gdzie będzie następna cena Bitcoina?

W tej chwili Cena Bitcoin is trading comfortably toward the upper boundary of the channel as the price establishes a new bullish signal. Meanwhile, one could say that the long-term outlook favors the bulls, giving the daily close produced a few bullish candles with eyes now set on the daily resistances at $80,000, $82,000, and $84,000 respectively.

Meanwhile, any drop from the current level could lead to declines in the critical support below the lower boundary of the channel. However, in case BTC drops and touches the low of $60,000 support, then the king coin can rely on the long-term support levels at $52,000, $50,000, and $48,000. Moreover, the 9-day moving average is below the 21-day moving average, suggesting bearish signals.

BTC / USD Trend średnioterminowy: wahający się (wykres 4H)

Zgodnie z wykresem 4-godzinnym Bitcoin price is seen trading above the 9-day and 21-day moving averages at $66,132. However, today’s price move could be impressive if it climbs above the long-awaited resistance level of $70,000. Moreover, BTC/USD is now maintaining its bull run as the 9-day MA keeps hovering above the 21-day MA.

Bitcoin Price Prediction: BTC/USD Trades Above $66,000; Time to Resume Higher?
BTCUSD - wykres 4-godzinny

On the contrary, BTC may take a downward move if the bulls fail to push the price higher, and the coin may breach below the 9-day and 21-day moving averages, which could reach another support at $60,000 and below. Nevertheless, if the bulls find a decent resistance level of around $68,000, the coin may continue the bullish movement by crossing above the channel to hit the resistance level of $72,000 and above.

Możesz kupić Bitcoin tutaj. Kup BTC

$SPONGE (SPONGE/USD): Squeeze Play? Wstęgi Bollingera zaciskają się po teście wsparcia

In our previous analysis of GĄBKA/USD, we observed the market consolidating sideways near the $0.00005 price level. This level appears to be a temporary equilibrium point, with bulls and bears finding temporary parity. Swing highs and lows have been concentrated around this price. However, it’s noteworthy that bearish pressure tested lower levels in both the previous and current sessions. While this could suggest increasing bearish momentum, it also highlights the bulls’ continued defense around the $0.00005 support level.

Kluczowa dynamika rynku:

  • Poziomy odporności: 0.0010 USD, 0.0011 USD i 0.0012 USD.
  • Poziomy wsparcia: 0.000035 0.000030 $, 0.000025 XNUMX $ i XNUMX XNUMX $.

$SPONGE (SPONGE/USD): Squeeze Play? Wstęgi Bollingera zaciskają się po teście wsparcia

Zagłębiając się w analizę techniczną dla $SPONGE (SPONGE/USD):

The recent sharp contraction of the Bollinger Bands indicates a decline in volatility. Initially, both buyers and sellers failed to capitalize on the higher volatility, resulting in the sideways price action. This standoff likely contributed to the volatility decrease.

Ten rodzaj sygnał kryptograficzny, that is,this contraction, often precedes a breakout (price moves decisively above the upper band) or breakdown (price moves decisively below the lower band) from the recent trading range. Current technical indicators signal market indecision and consolidation.

The Relative Strength Index (RSI) sits near the midpoint, and the Moving Average Convergence Divergence (MACD) lines trade sideways above zero, suggesting neutrality. While the price currently resides slightly below the 20-day moving average, potentially hinting at a breakdown, the two recent price rejections on the downside suggest continued bullish strength around this price zone.

$SPONGE (SPONGE/USD): Squeeze Play? Wstęgi Bollingera zaciskają się po teście wsparcia

Spostrzeżenia z perspektywy 1 godziny:

Yesterday’s bearish move in SPONGE/USD unfolded over two one-hour sessions. Today, however, the bears’ attempt to push lower was contained within a single one-hour session. This potentially indicates a quicker rejection by the bulls compared to yesterday, suggesting a possible increase in bullish momentum. While this is a positive sign for the bulls, it’s not necessarily a confirmation of an imminent price breakout. Further observation and confirmation from other technical indicators are needed.

Kup SPONGE/USD!

Zainwestuj w najgorętszą i najlepszą monetę mema. Kup Gąbkę ($SPONGE) już dziś!

Handel Dogecoinem (DOGE/USD) utrzymuje się na bazie, utrzymując pozytywne tendencje

Prognoza ceny Dogecoina – 22 kwietnia

A gradual pushing effort has been embarked upon by bulls against bears in the way of exchanging price actions between the Dogecoin market versus the trade line of he Us Dollar, as the cena kryptoekonomiczna is on a base formation pattern, holding positive pushes.

According to technical analysis, the lower Bollinger Band trend line will be the main tool in determining whether the price continues to decline or resumes its upward trend. The resistance trade zone of he middle Bollinger indicator is tenable toward providing a decent resumption of rejections that could lead to generation of instant shorting entries based on the principle of catching up instantly while that assumption tends to play out.

DOGE/USD Rynek
Kluczowe poziomy:
Poziomy oporu: $ 0.18, 0.22, 0.26
Poziomy wsparcia: 0.12, 0.10, 0.08

DOGE / USD - wykres dzienny
The DOGE/USD daily shows that the crypto market is on a base creation style around the ponit of $0.15, holding positive pushes.

Variant candlesticks have been forming by generating bottoms close to the buy signal side of the lower Bollinger Band. The stochastic oscillators have remained at lower spots to depict that the market is in a mood of trying to gather catalysts.
DOGE/USD, DOGE/BTC, Dogecoin, analiza techniczna

If a fearful draw back appears against the lower Bollinger Band, will the DOGE/USD market buyers won’t recover quickly?

A production of a sudden bearish candlestick against the lower Bollinger Band indicator without a quick reversal motion may cause lower lows before bulls will be putting themselves together for surging, given that the Handel DOGE/USD is presently in a base formation manner around the value of $0.15, holding positive pushes.

Given the current situation, long-position movers are probably going to win inside the middle and lower lines of the Bollinger Bands. However, they must make long-term decisions about their position orders.

Bears tend not to have decent entries because most of the indicators have been placed at reasonable lower areas that do not support many velocities to the south side. If that is indeed the case, then any move into the lower Bollinger Band zone could encounter an extraordinary bounce, rendering it invalid in the process.
DOGE/USD, DOGE/BTC, Dogecoin, analiza techniczna
Analiza cen DOGE/BTC
W przeciwieństwie do tego Handel Dogecoinami is on a base featuring against the valuation of Bitcoin, holding positive pushes.

The stochastic oscillators have continued to oscillate on a significant lower axis, indicating that the base cryptocurrency is attempting to position itself to outperform its rival. The Bollinger Band trend lines are positioned at higher zones, signaling that the price is being held on ranging move as of this analysis.

Uwaga: Cryptosignals.org nie jest doradcą finansowym. Przeprowadź badania przed zainwestowaniem środków w jakikolwiek składnik aktywów finansowych lub prezentowany produkt lub wydarzenie. Nie ponosimy odpowiedzialności za Twoje wyniki inwestycyjne.


Możesz kupić Lucky Block tutaj. Kup LBLOCK