MANAUSD experienced a reversal as price action failed to register a new lower low. This indicates a potential shift in market sentiment as buyers are eager to take control.
MANAUSD experienced a significant drop in mid-April 2024, causing the price to slightly breach the $0.4250 demand level and taking out existing liquidity below. Following the liquidity being taken, the price formed a failed low, indicating a decrease in selling pressure, which could potentially lead to a rise in price.
The 4-hour timeframe supports a bullish bias as it broke the structure upwards. The 4-hour Moving Average also aligns with the bullish bias, with the current price trading above it. Additionally, the daily Relative Strength Index shows the price below the 30.0 oversold region, indicating a potential buildup of bullish strength.
Очекивање тржишта
The price is anticipated to increase quickly as liquidity below the $0.4250 level is being absorbed. It is expected that the supply level at $0.5680 will be surpassed as the price seeks to access liquidity situated above that level.
белешке: Цриптосигналс.орг није финансијски саветник. Урадите истраживање пре него што уложите средства у било који финансијски капитал или представљени производ или догађај. Нисмо одговорни за ваше резултате улагања.
Market Analysis – Price Strikes Major Resistance Zone
Compound (COMPUSD) has been embroiled in a protracted battle with resistance, particularly around the $74.460 mark, spanning nearly two years. Despite persistent efforts, the price has struggled to breach this significant barrier, with the earliest signs of resistance emerging back in May 2022.
Conversely, the demand threshold at $30.270 has acted as a formidable line of defense against further price declines. Each encounter with this level has triggered bullish reversals, resulting in a prolonged period of price oscillation confined within the range of $74.470 and $30.270.
March brought an unexpected twist to the narrative as market bulls capitalized on the favorable conditions presented by the bullish crypto season, driving the price above the resistance zone at $74.400. Yet, this bullish momentum proved fleeting, as the price encountered swift resistance around $97.540, leading to a rapid downturn.
Furthermore, a bullish parallel channel emerged, facilitating the invalidation of the long-term resistance zone at $74.460. However, the euphoria was short-lived as the price swiftly crashed below the parallel channel upon reaching the resistance zone of $97.550, signaling a potential shift toward bearish market sentiment.
Очекивање тржишта
Adding to the bearish outlook, the price currently resides below the Moving Average (Periods 9 and 21), further affirming the prevailing bearishness in the market and sending cautious crypto signals. Analysts anticipate a continuation of the downward trajectory, with the price expected to decline further towards the previous low on the daily chart at $43.000.
белешке: Цриптосигналс.орг није финансијски саветник. Урадите истраживање пре него што уложите средства у било који финансијски капитал или представљени производ или догађај. Нисмо одговорни за ваше резултате улагања.
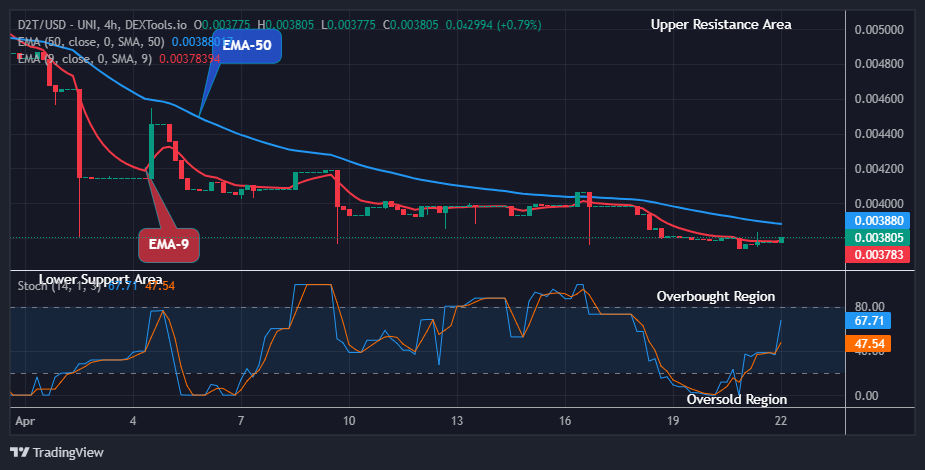
Dash 2 Trade Price Forecast: D2TUSD Price Finds Resistance at $0.00380 Supply Level (April 23) Постоји могућност куповине Д2ТУСД pair as the price now finds resistance at the $0.00380 supply level while climbing the bullish ladder and going up at the moment. However, the price will move higher above the current resistance level, if buyers should exert more force into the price action in the market, the $0.00505 high trend line might be retested soon which may expose the coin price further to a $0.01000 upper high trend line, resulting to a good entry time for coin buyers.
Д2Т (УСД) Дугорочни тренд: биковски (4Х графикон) Д2ТУСД is in a bullish trend market in its long-term view. The bulls are about to take over and push us higher. There are multiple possible targets at this point, but the pair looks quite bullish here as we can see the coin price trading above the EMA-50. The bulls’ pressure on the cryptocurrency to the $0.00376 resistance level in the previous action has allowed it to retain its upward growth.
An increase to a $0.00380 high level above the EMA-9 approaching the overhead resistance as the 4-hourly chart opens today indicates that the traders are actively buying at this level.
This current trend will enable the price of Дасх 2 Трговина to remain on the upside and rise or break out to the upside. This will enable buyers to hold a firm grip over the asset.
Furthermore, the market is pointing up on the daily stochastic; this will quicken the emergence of more buyers to move the price of D2TUSD up to a significant level on the upside which might hit the $0.01000 supply trend mark, thus bringing a positive sentiment among the coin traders and registering a buy signal for the coin traders as the market remain strongly bullish soon in its higher time frame.
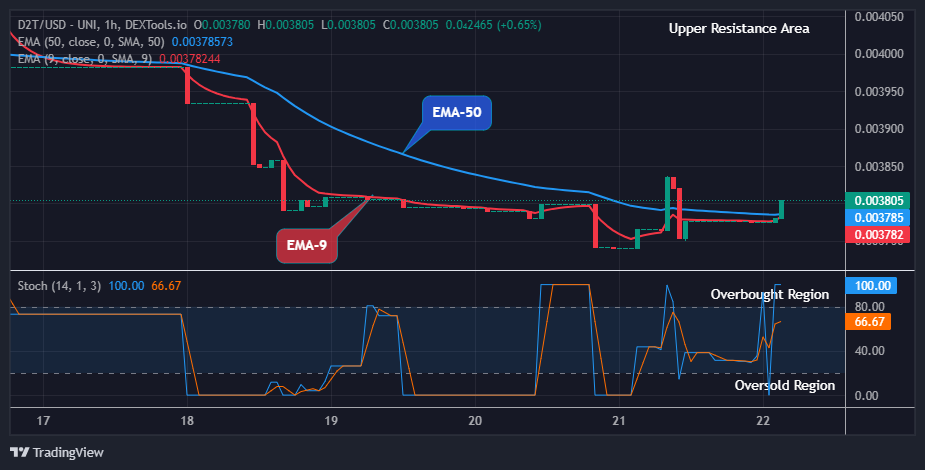
Д2Т (УСД) Средњорочни тренд: биковски (1Х графикон) Дасх 2 Трговина market also trades in a bullish trend market in the medium-term outlook. This is due to the high impact of the long-term traders on the price flow. Трајни биковски притисак на високи ниво од 0.00377 долара у претходној акцији довео је до недавног максимума новчића.
Earlier today, after completing the sideway moves, the Д2ТУСД buyers successfully pushed the coin price up to a $0.00380 supply level above the two moving averages shortly after the 1-hourly chart opened.
The current price at the $0.00380 resistance level suggests the returns of the buy traders in the market. The market participants are responding to this pattern, and its breakout should offer a good buy entry opportunity.
Дакле, пар који показује нагоре на дневном стохастику значи да се притисак куповине може наставити, и сугерише могући опоравак нивоа понуде од 0.01000 долара у наредним данима у средњорочном временском оквиру.
Two-Factor Authentication (2FA), our newest feature, will increase the security of your Dash 2 Trade account!
Тражили сте – испоручили смо.🔒
Када је у питању ваш новац, требало би да предузмете све доступне мере предострожности да га сачувате.
Учините свој Дасх 2 Траде налог још безбеднијим уз нашу нову функцију – Двофакторска аутентикација (2ФА)! пиц.твиттер.цом/јкРоМНкЕу9
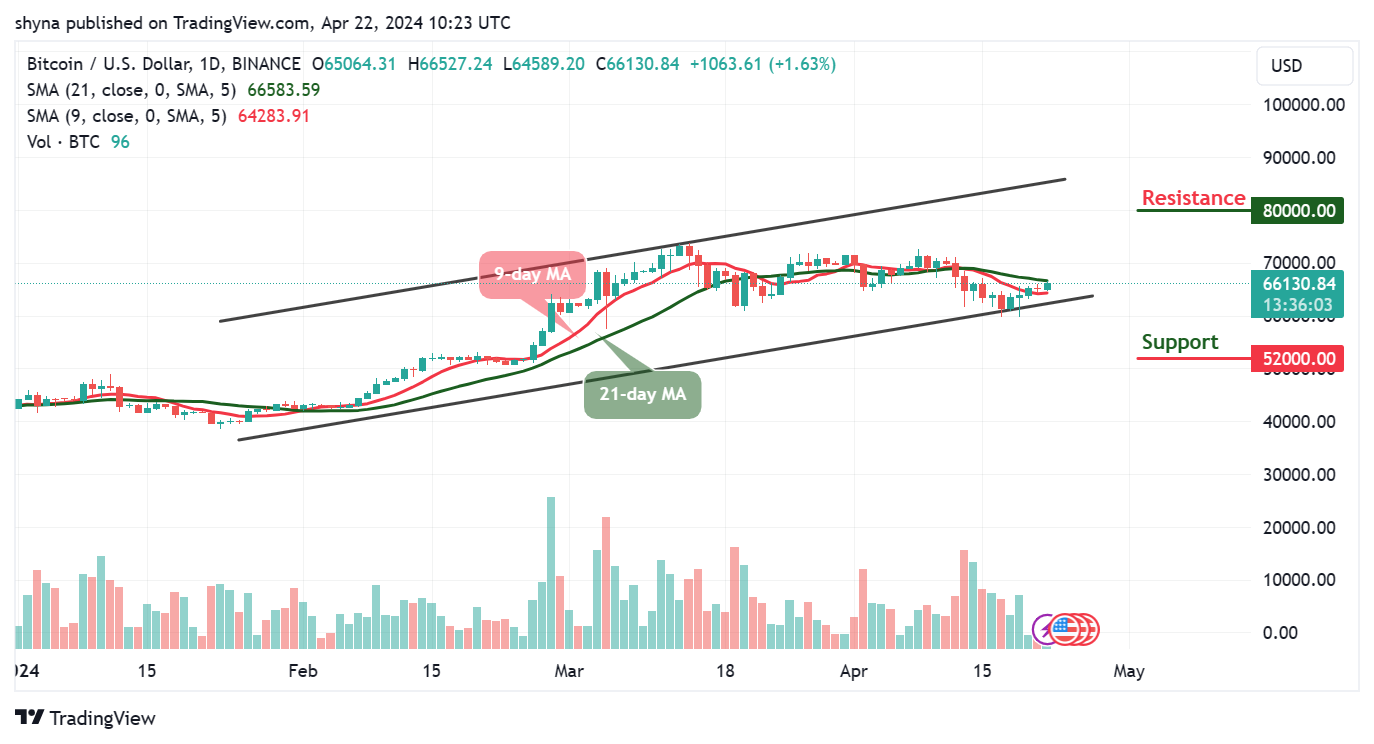
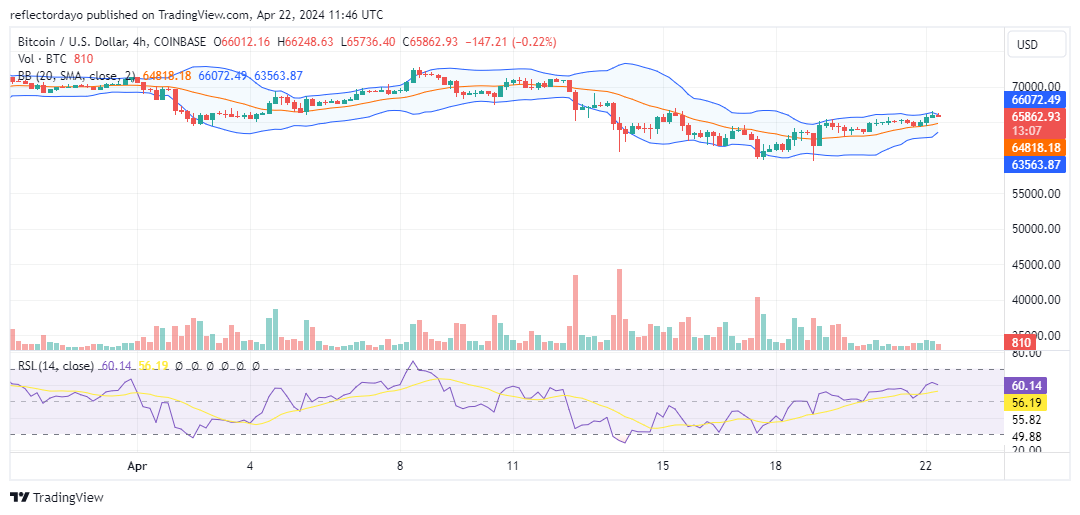
Према дневном графикону, БТЦ / УСД breaches $66,000 as the new week’s high beckons. The king coin is seen trading well within the 9-day and 21-day moving averages at $66,130. Moreover, the Bitcoin price is within touching distance of forming a new daily high above the previous high of $66,000, which is quite remarkable.
Предвиђање цене Битцоина: Где иде цена Битцоина?
Тренутно, Битцоин цена is trading comfortably toward the upper boundary of the channel as the price establishes a new bullish signal. Meanwhile, one could say that the long-term outlook favors the bulls, giving the daily close produced a few bullish candles with eyes now set on the daily resistances at $80,000, $82,000, and $84,000 respectively.
Meanwhile, any drop from the current level could lead to declines in the critical support below the lower boundary of the channel. However, in case BTC drops and touches the low of $60,000 support, then the king coin can rely on the long-term support levels at $52,000, $50,000, and $48,000. Moreover, the 9-day moving average is below the 21-day moving average, suggesting bearish signals.
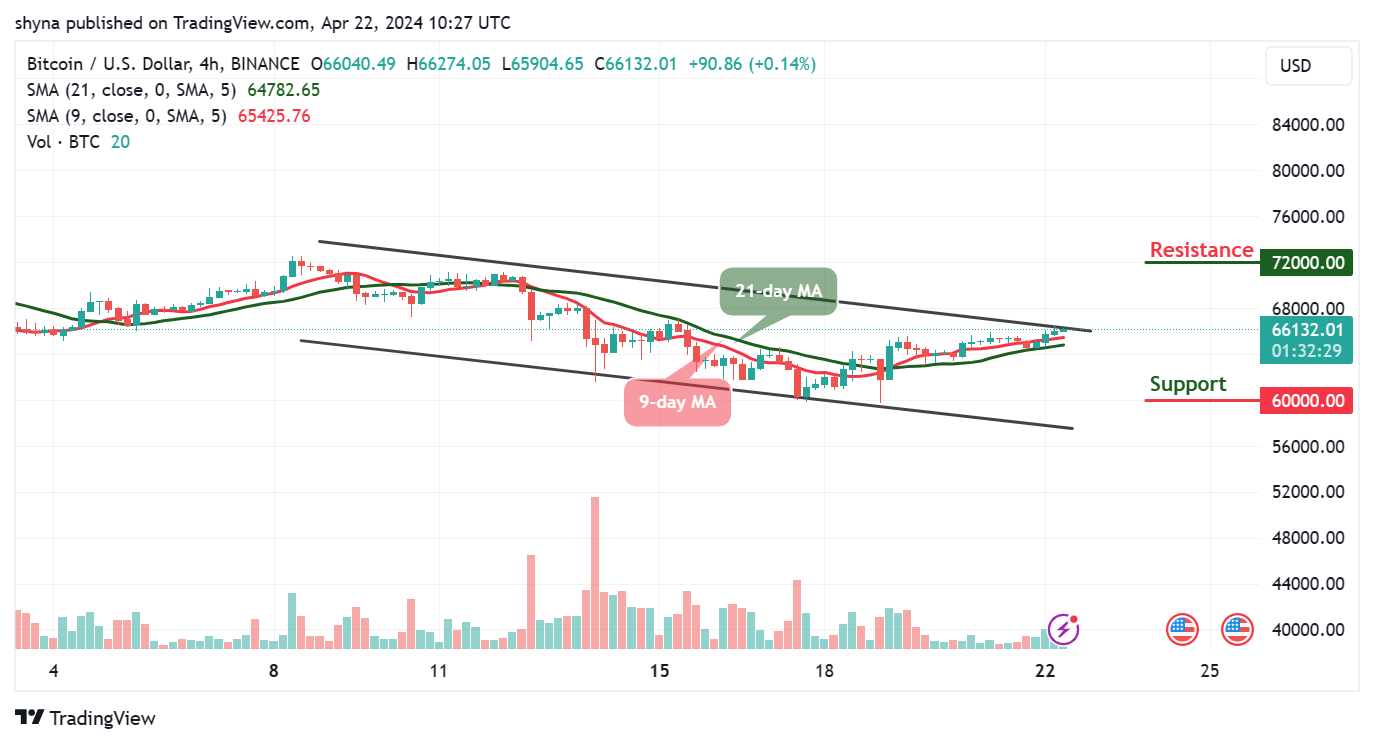
БТЦ / УСД средњорочни тренд: распон (4Х графикон)
Према четворосатном графикону, Bitcoin price is seen trading above the 9-day and 21-day moving averages at $66,132. However, today’s price move could be impressive if it climbs above the long-awaited resistance level of $70,000. Moreover, BTC/USD is now maintaining its bull run as the 9-day MA keeps hovering above the 21-day MA.
БТЦУСД - Графикон од 4 сата
On the contrary, BTC may take a downward move if the bulls fail to push the price higher, and the coin may breach below the 9-day and 21-day moving averages, which could reach another support at $60,000 and below. Nevertheless, if the bulls find a decent resistance level of around $68,000, the coin may continue the bullish movement by crossing above the channel to hit the resistance level of $72,000 and above.
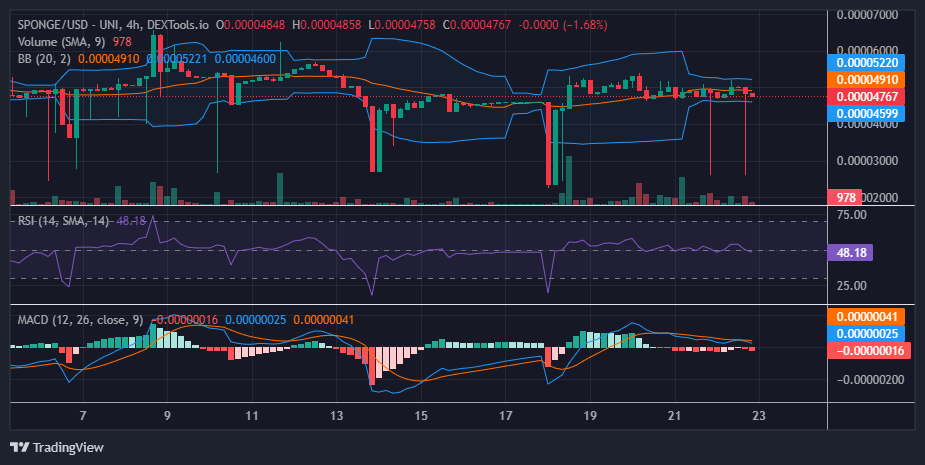
In our previous analysis of СПУНЖ/УСД, we observed the market consolidating sideways near the $0.00005 price level. This level appears to be a temporary equilibrium point, with bulls and bears finding temporary parity. Swing highs and lows have been concentrated around this price. However, it’s noteworthy that bearish pressure tested lower levels in both the previous and current sessions. While this could suggest increasing bearish momentum, it also highlights the bulls’ continued defense around the $0.00005 support level.
Кључна динамика тржишта:
Нивои отпора: 0.0010, 0.0011 и 0.0012 долара.
Нивои подршке: 0.000035, 0.000030 и 0.000025 долара.
Удубљивање у техничку анализу за СПУНГЕ (СПУНЖ/УСД):
The recent sharp contraction of the Bollinger Bands indicates a decline in volatility. Initially, both buyers and sellers failed to capitalize on the higher volatility, resulting in the sideways price action. This standoff likely contributed to the volatility decrease.
Ова врста крипто сигнал, that is,this contraction, often precedes a breakout (price moves decisively above the upper band) or breakdown (price moves decisively below the lower band) from the recent trading range. Current technical indicators signal market indecision and consolidation.
The Relative Strength Index (RSI) sits near the midpoint, and the Moving Average Convergence Divergence (MACD) lines trade sideways above zero, suggesting neutrality. While the price currently resides slightly below the 20-day moving average, potentially hinting at a breakdown, the two recent price rejections on the downside suggest continued bullish strength around this price zone.
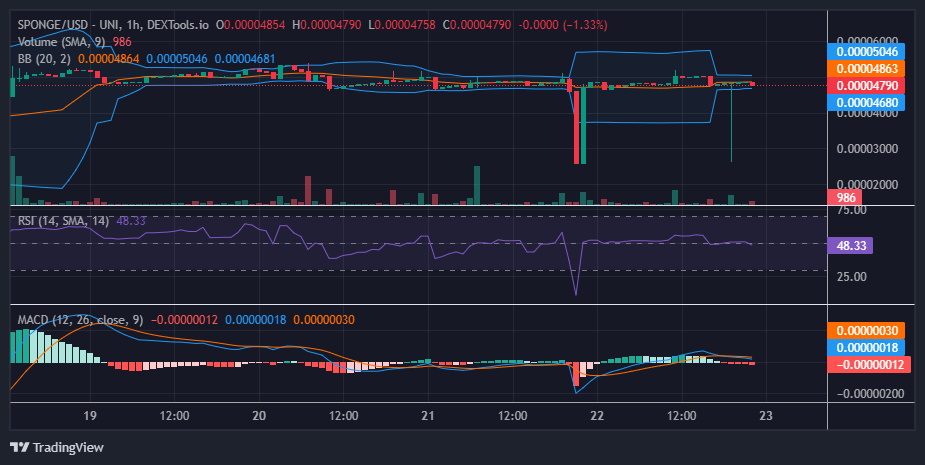
Увиди из једночасовне перспективе:
Yesterday’s bearish move in SPONGE/USD unfolded over two one-hour sessions. Today, however, the bears’ attempt to push lower was contained within a single one-hour session. This potentially indicates a quicker rejection by the bulls compared to yesterday, suggesting a possible increase in bullish momentum. While this is a positive sign for the bulls, it’s not necessarily a confirmation of an imminent price breakout. Further observation and confirmation from other technical indicators are needed.
A gradual pushing effort has been embarked upon by bulls against bears in the way of exchanging price actions between the Dogecoin market versus the trade line of he Us Dollar, as the крипто-економска цена is on a base formation pattern, holding positive pushes.
According to technical analysis, the lower Bollinger Band trend line will be the main tool in determining whether the price continues to decline or resumes its upward trend. The resistance trade zone of he middle Bollinger indicator is tenable toward providing a decent resumption of rejections that could lead to generation of instant shorting entries based on the principle of catching up instantly while that assumption tends to play out.
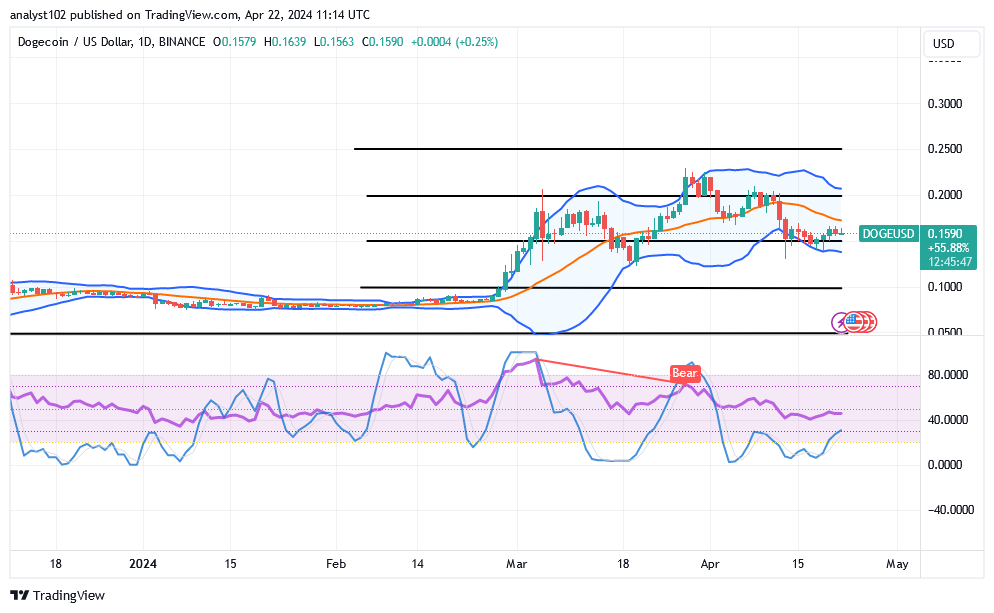
ДОГЕ / УСД - Дневни графикон The DOGE/USD daily shows that the crypto market is on a base creation style around the ponit of $0.15, holding positive pushes.
Variant candlesticks have been forming by generating bottoms close to the buy signal side of the lower Bollinger Band. The stochastic oscillators have remained at lower spots to depict that the market is in a mood of trying to gather catalysts.
If a fearful draw back appears against the lower Bollinger Band, will the DOGE/USD market buyers won’t recover quickly?
A production of a sudden bearish candlestick against the lower Bollinger Band indicator without a quick reversal motion may cause lower lows before bulls will be putting themselves together for surging, given that the ДОГЕ/УСД трговина is presently in a base formation manner around the value of $0.15, holding positive pushes.
Given the current situation, long-position movers are probably going to win inside the middle and lower lines of the Bollinger Bands. However, they must make long-term decisions about their position orders.
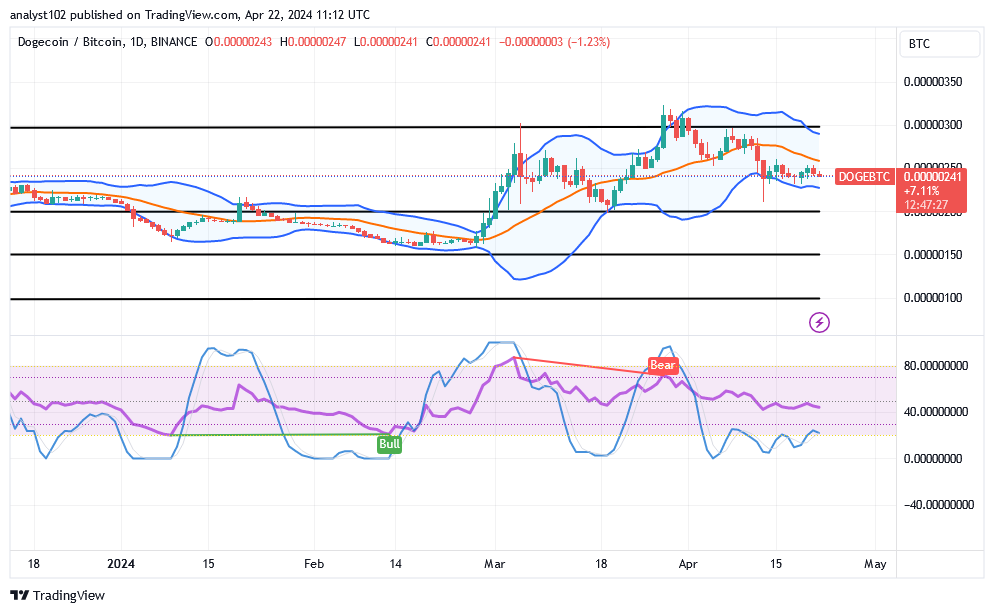
Bears tend not to have decent entries because most of the indicators have been placed at reasonable lower areas that do not support many velocities to the south side. If that is indeed the case, then any move into the lower Bollinger Band zone could encounter an extraordinary bounce, rendering it invalid in the process. ДОГЕ/БТЦ анализа цена Супротно томе, Догецоин трговина is on a base featuring against the valuation of Bitcoin, holding positive pushes.
The stochastic oscillators have continued to oscillate on a significant lower axis, indicating that the base cryptocurrency is attempting to position itself to outperform its rival. The Bollinger Band trend lines are positioned at higher zones, signaling that the price is being held on ranging move as of this analysis.
Напомена: Цриптосигналс.орг није финансијски саветник. Урадите своје истраживање пре него што уложите своја средства у било коју финансијску имовину или представљени производ или догађај. Не сносимо одговорност за ваше резултате улагања.
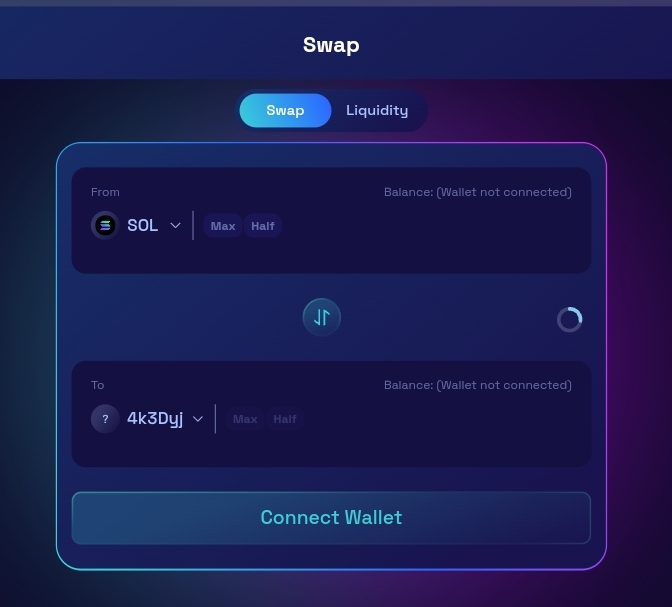
Raydium stands at the forefront of revolutionizing the decentralized finance (DeFi) ecosystem with its state-of-the-art platform. By harnessing the power of the Solana blockchain, Raudium delivers unparalleled advantages, including lightning-fast transaction speeds, seamless shared liquidity across its ecosystem, and pioneering yield-generating functionalities. But what truly distinguishes Raydium from its peers? Let’s delve deeper into the unique attributes that set Raydium apart and position it as a leader in the rapidly evolving DeFi landscape.
In contrast to traditional дефи protocols constrained within their liquidity pools, Raydium adopts a groundbreaking strategy by integrating a central order book. This innovative approach revolutionizes liquidity provision by facilitating seamless access to third-party order flow and fostering ecosystem-wide liquidity.
By transcending the limitations of isolated pools, Raydium creates a dynamic environment where liquidity is fluidly shared across various platforms and market participants, enhancing market depth and efficiency. This unique feature not only promotes greater liquidity but also expands trading opportunities, ultimately empowering users with a more robust and interconnected DeFi experience.
Advantages of Raydium:
1. Swift and Cost-effective: By harnessing Solana’s efficiency, Raydium accelerates transactions and slashes gas fees compared to Ethereum.
2. Centralized Liquidity Hub: Raydium’s integration with a central limit order book ensures a robust trading ecosystem with unparalleled liquidity.
3. Trader-Friendly Interface: Empower traders with features like ТрадингВиев charts and customizable limit orders for enhanced control over their trading experience.
Explore Raydium’s Possibilities
Embark on a transformative journey with Raydium and unlock the boundless possibilities that await within its dynamic ecosystem. Dive into a realm where innovation knows no bounds, and where cutting-edge technology merges seamlessly with groundbreaking financial solutions.
Доживите моћ децентрализовано finance like never before as you explore a vast array of opportunities for trading, liquidity provision, and yield generation. Whether you’re a seasoned investor seeking new avenues for growth or a DeFi enthusiast eager to dive into the world of decentralized exchanges, Raydium offers a gateway to limitless potential. Join us on this exhilarating adventure and discover the future of finance with Raydium.
1. Trade and Exchange: Seamlessly swap between tokens within liquidity pools or utilize advanced trading features like limit orders for a superior trading journey.
2. Earn Trading Rewards: By providing liquidity in Raydium’s pools, you can earn a share of trading fees generated by swaps within those pools.
3. Acquire RAY Tokens: Participate in liquidity farming and staking to earn RAY tokens, with more earning opportunities on the horizon.
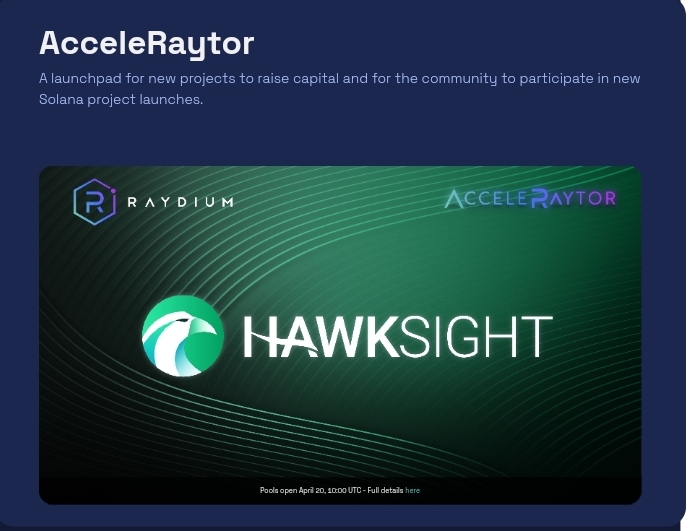
4. Propel Your Project: Whether you aim to list your project, establish a Fusion Pool, or join AcceleRaytor, Raydium offers avenues for growth and exposure. Register on the platform to get started.
5. Supercharge Your Platform: If you’re seeking to enhance your platform’s capabilities on Solana, Raydium is your ideal partner. Let’s collaborate to unleash the full potential of your project!
Introducing UI V3 (Beta): Elevating User Experience
Raydium’s latest iteration, UI V3 (Beta), brings a host of enhancements to amplify user experiences. With a more robust and intuitive interface, users can expect heightened usability, effectiveness, and productivity. Here’s what’s new:
Управљање портфељем: Experience the revamped portfolio page, your central hub for managing positions. Easily add or withdraw liquidity, collect yields, and create pools and positions directly from the pool list.
Управљање ликвидношћу: Discover all Raydium liquidity pools in one unified interface. Access CLMM, Standard (AMM pools), or ALL pools effortlessly. Toggle between list and card views for enhanced visibility.
Прилагођавање корисника: Find all your user settings and customizations conveniently located in the top right corner of your screen. Choose your preferred language from a growing list of supported languages to personalize your Raydium experience.
Буг Боунти: Join the bug hunt and help improve Raydium’s performance. Report bugs to earn a chance at 800 RAY per Beta week from the prize pool. To ensure fairness, Raydium reserves the right to disqualify users who misuse the bug reporting form.
Explore UI V3 (Beta) and elevate your Raydium journey today!
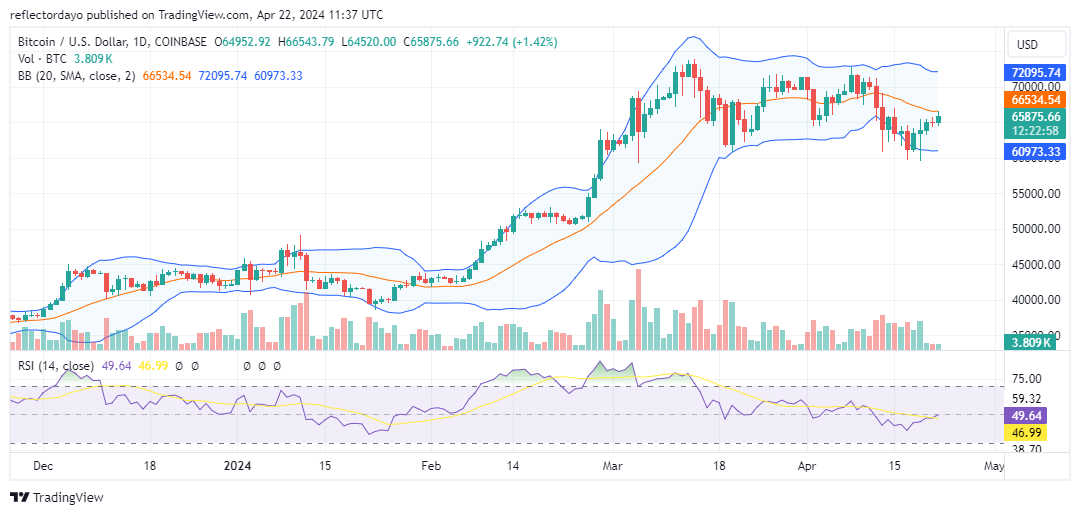
Since April 19th and 20th, coinciding with the Bitcoin halving event, there has been a noticeable equilibrium in supply and demand within the market. This equilibrium suggests a hesitancy among traders to determine the market’s next direction, likely in anticipation of the event’s outcome. Following the completion of the halving event, the market has exhibited a gradual upward trajectory in price. As of recently, the Bitcoin market has reestablished support above the $65,000 threshold, indicating a stabilizing trend. Presently, the market appears to be approaching equilibrium.
The Bitcoin market is currently showing signs of an upward trend, albeit progressing at a measured pace. While price action indicates a gradual increase, resistance has become apparent near the $66,000 mark, slightly below the 20-day moving average. Despite the nuanced progress in the bull market, demand currently surpasses supply. However, a notable concern arises from the trading volume since April 19th. The volume of trade indicator reveals a series of three consistently small histograms since that date. Although, according to this крипто сигнал, trading volume has been low, demand continues to outstrip supply, resulting in market price rallies.
Предвиђање цене БТЦ/УСД: 4-часовна анализа графикона
Анализирајући 4-сатни графикон, we observe a resistance zone ranging from $66,000 to $66,500. Price action has stabilized within this range as bulls and bears engage in a balanced struggle. Notably, bearish positions around this level appear to be facing bullish pressure, evident in the consistent formation of higher lows by the bulls. A surge in trading volume could inject momentum into the market and potentially accelerate the ongoing bullish trend.
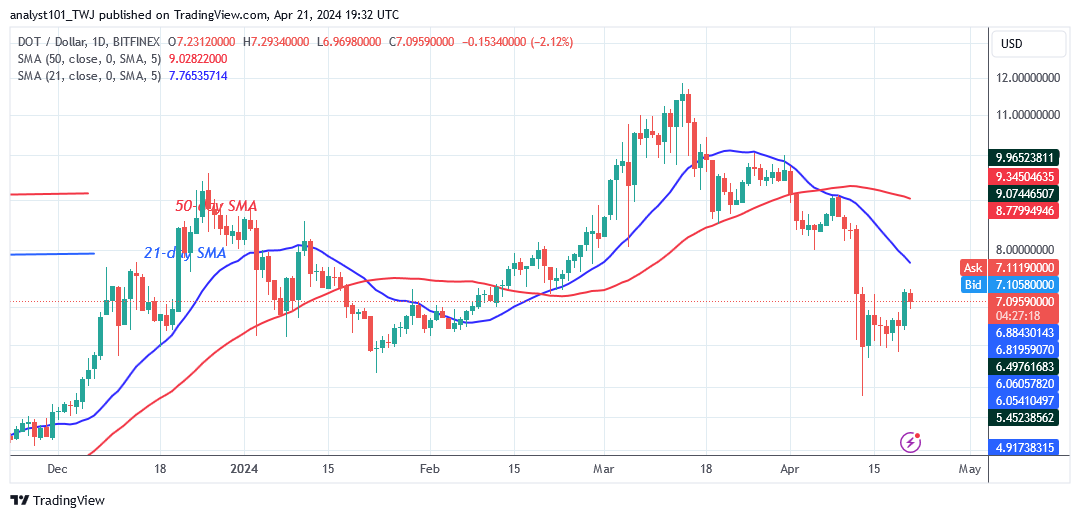
Полкадот (ДОТ) дугорочна анализа: медведаст Полкадот'с (ДОТ) price has returned following the price drop on April 13, 2024, as purchasers recoup. The altcoin had previously plummeted to a low of $5.67 before bulls purchased the dips. The altcoin corrected upward and remained above the $6.20 support level. Over the last week, the altcoin has wavered between $6.20 support and below the moving average lines. The upward correction is encountering a first resistance at the high of $7.29.
Polkadot will resume its bullish trend if it rebounds and breaks above the moving average lines or the resistance level at $9.00. The bullish momentum will continue till the previous high of $11.85. However, if the bullish scenario is invalidated, the range-bound move will continue. Полкадот тренутно вреди 7.14 долара.
ДОТ / УСД - Дневни графикон
Технички индикатори: Главни нивои отпора - 10 $, 12 $, 14 $ Главни нивои подршке - 8, 6, 4 долара
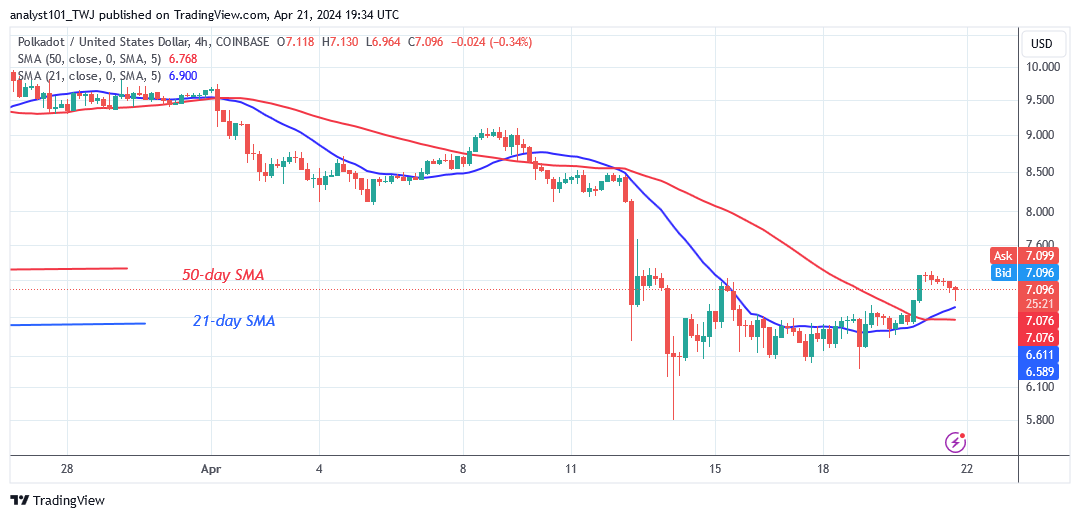
Анализа индикатора Полкадот (ДОТ) Polkadot is gaining on the 4-hour chart since the price bars are higher than the moving averages. The rising movement has been hampered by the $7.25 opposition. The bullish momentum will be continued if the altcoin trades in the bullish trend zone or above the resistance level of $9.00.
Који је следећи правац за Полкадот (ДОТ)? Polkadot is still trading above the $6.20 support level following the end of the bearish trend as purchasers recoup. The altcoin is currently trading between $6.20 and $7.25. When current price levels are breached, the cryptocurrency will trend. Meanwhile, крипто сигнал has remained range-bound pending the start of the trend.
Белешка: Цриптосигналс.орг није финансијски саветник. Истражите пре него што уложите средства у било коју финансијску имовину или представљени производ или догађај. Нисмо одговорни за ваше резултате улагања
 MANAUSD experienced a significant drop in mid-April 2024, causing the price to slightly breach the $0.4250 demand level and taking out existing liquidity below. Following the liquidity being taken, the price formed a failed low, indicating a decrease in selling pressure, which could potentially lead to a rise in price.