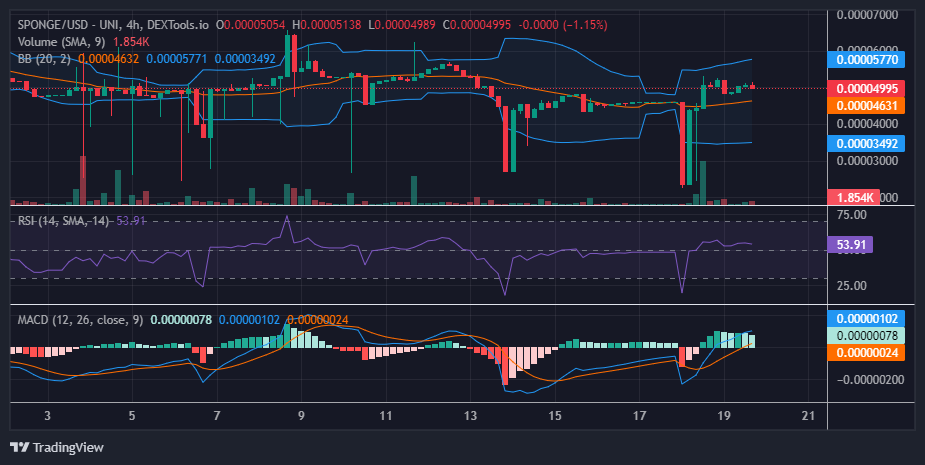
For a span of two days, the $స్పాంజ్ market remained stagnant at approximately $0.000044 as buyers and sellers found themselves in a deadlock. However, the market regained momentum when a sudden hyper-bearish move escalated market volatility since yesterday’s trading session. This, in turn, revived the bull market as traders began to buy the dip. This momentum continued into today as the market witnessed a notable shift in dynamics, marked by a substantial surge in price. This upturn followed the emergence of a Dragonfly Doji candlestick pattern around the $0.000044 price threshold, catalyzing a significant breakout. Consequently, bullish sentiment is poised to prevail, targeting the $0.00005 price milestone.
కీ మార్కెట్ డైనమిక్స్:
ప్రతిఘటన స్థాయిలు: $0.0010, $0.0011 మరియు $0.0012.
మద్దతు స్థాయిలు: $0.000035, $0.000030 మరియు $0.000025.
$ స్పాంజ్ (స్పాంజ్/USD) కోసం సాంకేతిక విశ్లేషణను పరిశీలిస్తోంది:
The Dragonfly Doji signals a noteworthy recovery in the bullish market following a sharp dip to the $0.000024 price level. However, market activity then stagnated around the $0.000044 mark before a breakout occurred. The strength of this breakout compelled bears to retreat to the $0.00005 price level. Despite their resurgence at this level, a near-support level has formed at $0.0000482, effectively halting further price declines.
Indicators suggest a marginal victory for the bulls, with the Relative Strength Index (RSI) indicating bullish momentum slightly above the 50 level. Additionally, the RSI line has consistently hovered around the 53 level for a few sessions. If this back-and-forth between bulls and bears persists, volatility may decrease, leading to Bollinger bands converging into narrower bands. Such a convergence could signal an imminent price breakout.
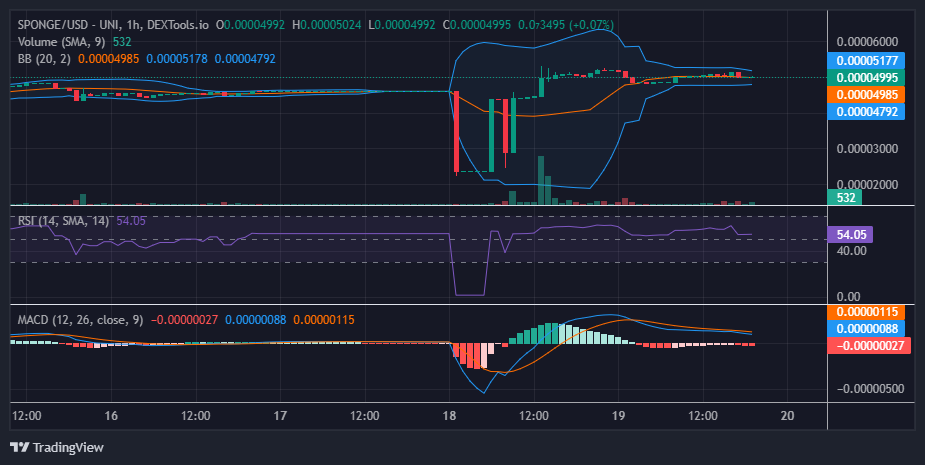
1-గంట దృక్కోణం నుండి అంతర్దృష్టులు:
1-గంటల చార్ట్ కోణం నుండి, the price action is exhibiting sideways movement within a narrow range, slightly above the 20-day moving average. This consolidation phase suggests an impending climax in the ongoing tug-of-war between buyers and sellers, hinting at a potential breakout in the near future. Given this క్రిప్టో సిగ్నల్, that is, the current position above the 20-day moving average, the breakout is anticipated to occur in the upside direction.
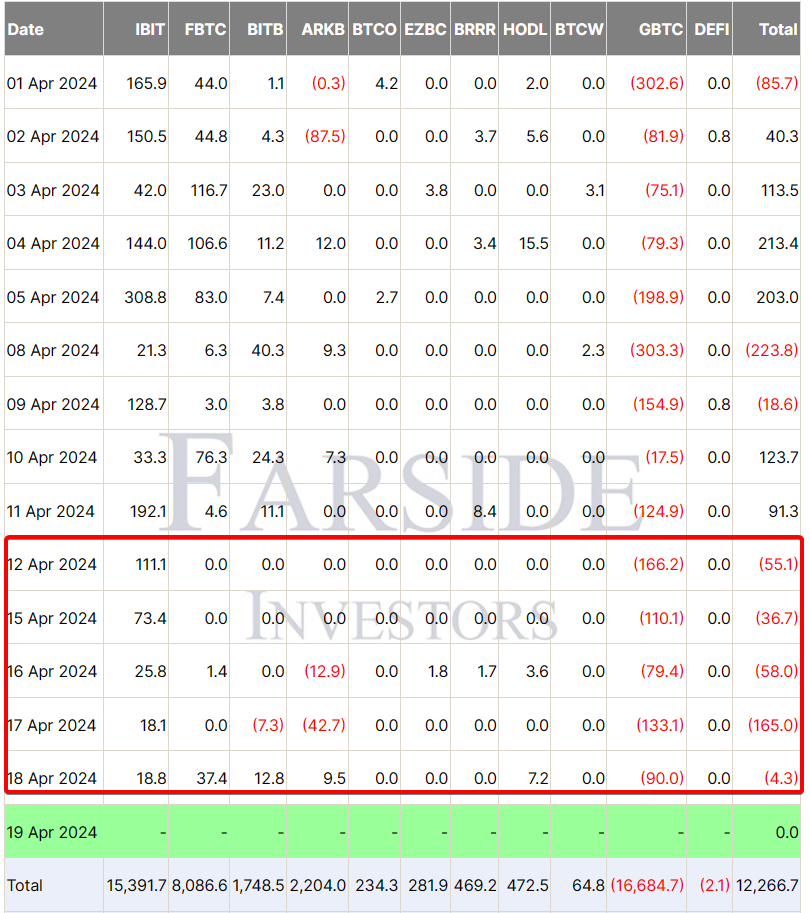
Spot Bitcoin (BTC) exchange-traded funds (ETFs) based in the U.S. are undergoing a notable trend, catching the attention of market participants. In the last five days, these ETFs have witnessed a consistent outflow, totaling $4.3 million as of Thursday. This development comes as the cryptocurrency community anticipates the upcoming mining reward halving, an event historically associated with a bullish market.
Net Outflows for Bitcoin ETFs Exceed $319 Million in 5 Days
According to industry reports from Farside Investors, as reported by CoinDesk, a net outflow exceeding $319 million has been observed from these ETFs since April 12. వారందరిలో, Grayscale’s Bitcoin Trust (GBTC) has seen a significant decrease, losing $166.2 million in a single day (on April 12).అయితే, the negative trend was partially offset by inflows into Fidelity’s FBTC and BlackRock’s IBIT.
Image via Farside Investors
Grayscale’s underperformance can be attributed to its fee structure since its inception. While the outflows from GBTC are not overly concerning, the recent slowdown in inflows into other Bitcoin ETFs is noteworthy. For example, BlackRock’s IBIT experienced only $18.8 million in inflows on Thursday, a sharp contrast to the $308.8 million peak earlier in the month.
Matrixport’s market update highlights a slowdown in కీ liquidity drivers, such as the growth of stablecoins and inflows into U.S.-listed Bitcoin ETFs. ఈ suggests a saturation in demand for these financial products, as not even a 10-15% dip in Bitcoin prices has sparked significant net inflows.
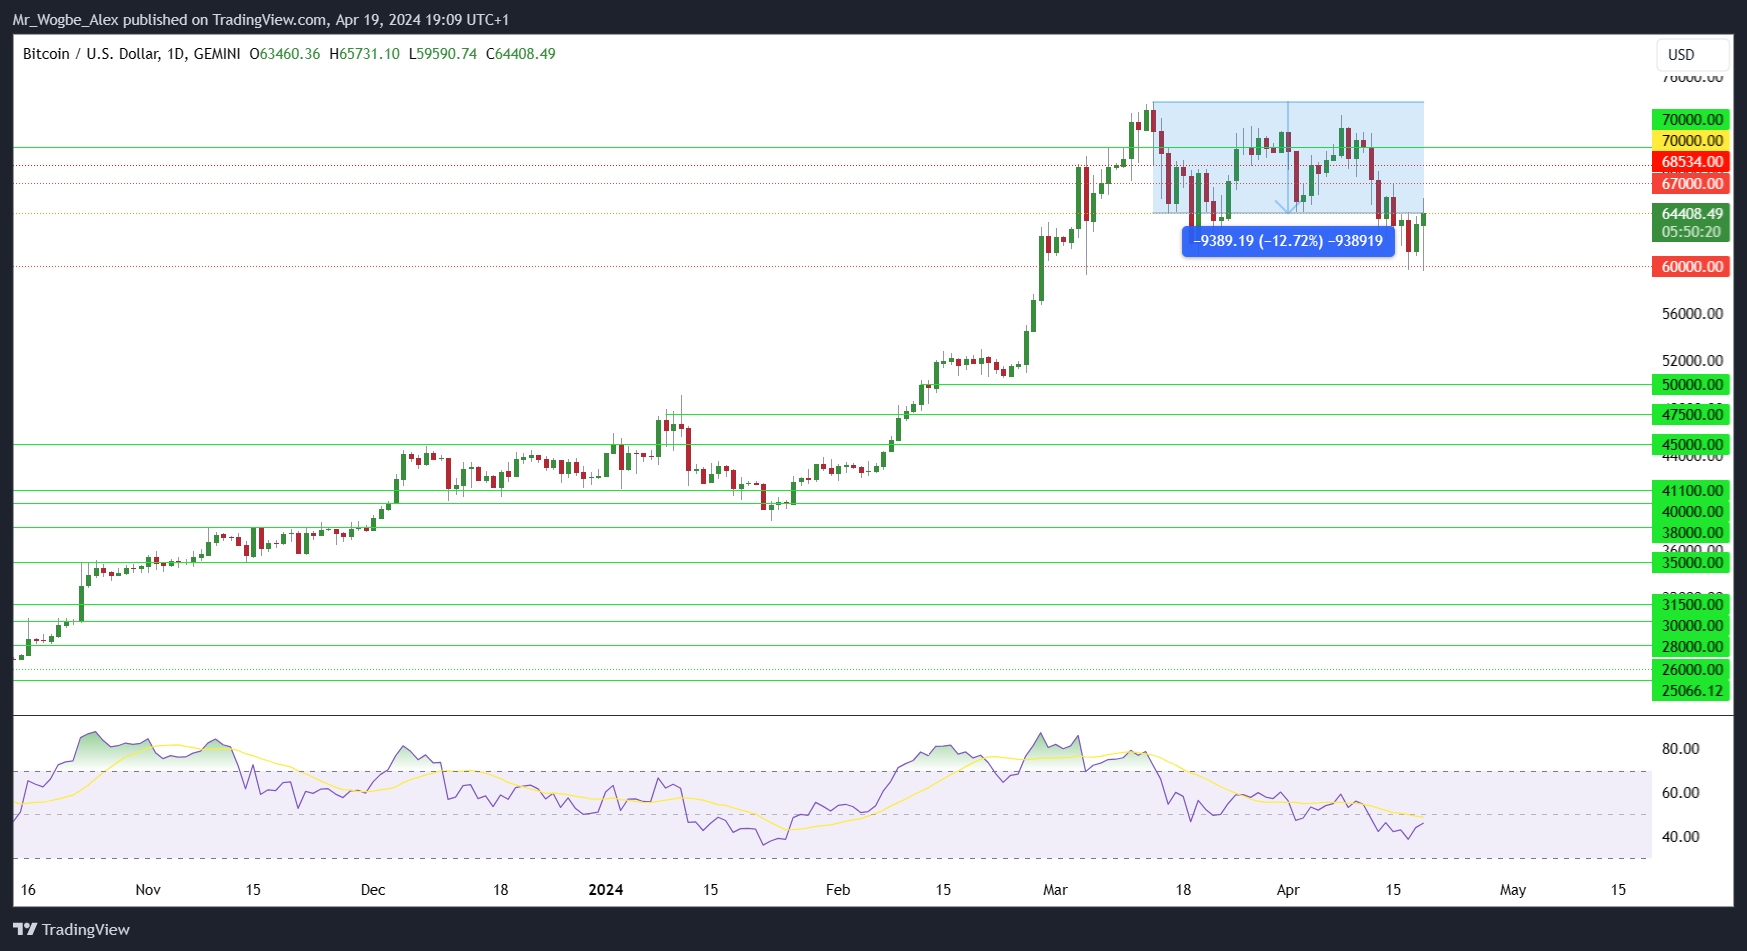
Bitcoin is currently trading at $64,400, reflecting a 12.7% decrease from its all-time high of over $73,797 last month.
BTCUSD డైలీ చార్ట్
Several factors contribute to this downturn, including impending U.S. tax payments, reduced expectations of Federal Reserve rate cuts, and geopolitical tensions, particularly between Iran and Israel.
The impending halving event, scheduled for late Friday, will reduce the per-block coin emission from 6.25 BTC to 3.125 BTC, halving the rate at which new Bitcoins సృష్టించబడతాయి. While past halvings have resulted in significant price rallies, the extent and duration of these increases have varied.
Despite the prevailing belief in the crypto community that the halving will drive Bitcoin’s long-term upward trajectory, financial giants like గోల్డ్మన్ సాచ్స్ మరియు JP మోర్గాన్ offer differing views. JPMorgan, in particular, has hinted at the possibility of a more pronounced price correction post-halving.
As the market observes the halving with మిశ్రమం excitement and caution, the movements in Bitcoin ETFs provide insights into investor sentiment leading up to this critical event. The coming days will reveal whether historical patterns persist or if the market is charting a new path.
క్రిప్టో మార్కెట్ను వర్తకం చేసేటప్పుడు, అది ఉండవలసిన అవసరం లేదు "హిట్ ఆర్ మిస్." మా ప్రీమియం లాగానే ఫలితాలను ఇచ్చే ట్రేడ్లతో మీ పోర్ట్ఫోలియోను భద్రపరచుకోండి క్రిప్టో సిగ్నల్స్ టెలిగ్రామ్లో.
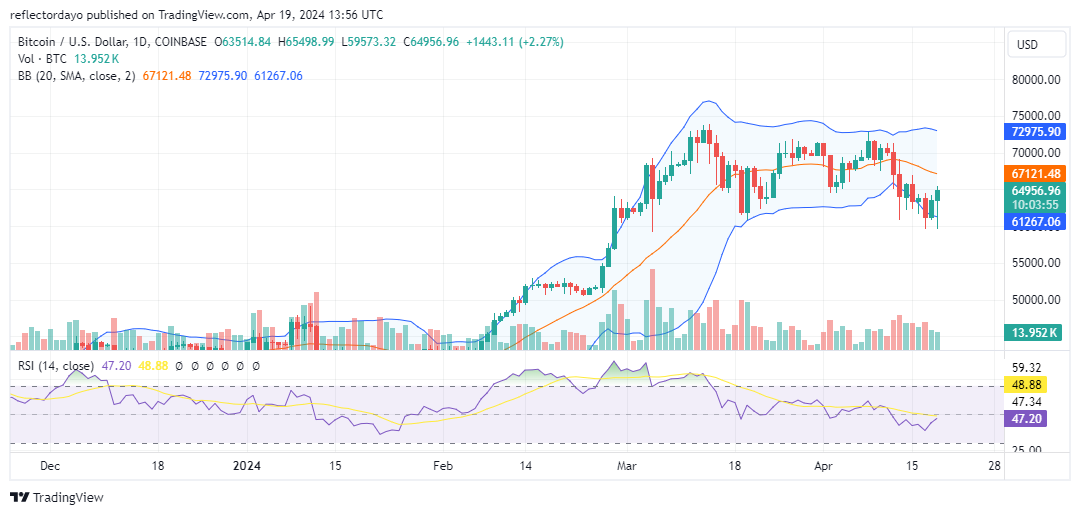
In the first half of March, the Bitcoin market surged into the price range of $60,000 to $75,000. Subsequently, as time progressed, the notable volatility subsided. Initially, it appeared that bullish momentum was establishing stronger support around the $65,000 level, exerting pressure on bearish positions at $75,000. However, by early April, increasing volatility favored bears, who occupied the $72,000 price level, while bulls faltered in maintaining the $65,000 level.
Consequently, they retreated to the support zone around the $60,000 price threshold. Presently, the market shows signs of rebounding from this level.
Bitcoin మార్కెట్ డేటా
BTC/USD Price Now: $64,798
BTC/USD Market Cap: $1.2 trillion
BTC/USD Circulating Supply: 19.7 million
BTC/USD Total Supply: 19.7 million
BTC/USD CoinMarketCap Ranking: #1
కీ స్థాయిలు
ప్రతిఘటన: $65,000, $70,000 మరియు $75,000.
మద్దతు: $60,000, $55,000 మరియు $50,000.
The Bitcoin Market Through the Lens of Indicators
నేటి Bitcoin market is exhibiting signs of strength, as evident from the analysis of today’s trading activities represented by the candlestick chart. While today’s trading sessions have been marked by considerable volatility, the emergence of a hammer formation suggests that bullish sentiment is gaining momentum, indicating a potential shift in market control.
Currently, bullish forces are exerting pressure on the $65,000 resistance level, despite lingering bearish sentiment at this threshold. Breaking through this resistance level is crucial for the market, as it would negate the development of a bearish trend. This is particularly significant given the bearish performance observed earlier in the week, as indicated by the Bollinger Bands beginning to trend downward. However, surpassing this threshold would effectively nullify the emergence of an impending bearish trend.
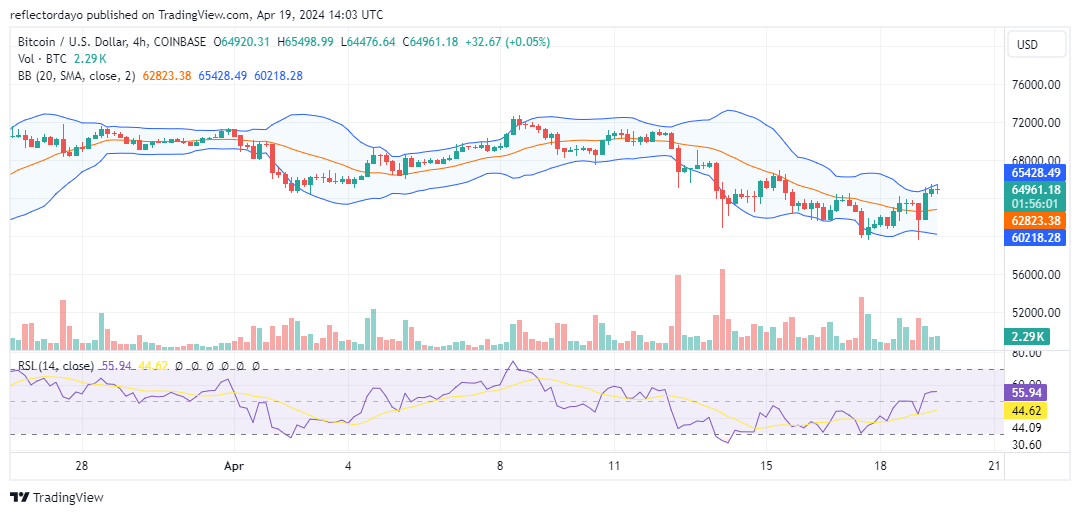
BTC/USD Price Prediction: 4-Hour Chart Analysis
The Bitcoin market has reached a stalemate as both buyers and sellers grapple for control at the $65,000 price level. Despite this క్రిప్టో సిగ్నల్, volatility remains notably high, with the price fluctuating within close proximity to this threshold. A closer examination of the current 4-hour session reveals minimal support and resistance around the $65,000 mark, indicating a state of indecision among traders. This lack of consensus has left the market at a crossroads, with neither side able to push the price significantly below support or above resistance levels. It appears traders are awaiting a catalyst, possibly in the form of news, to prompt decisive action in the market.
As the crypto realm expands, an often-overlooked domain is DePin, merging technology’s structural support for AI coins. Exploring DePin’s interplay with AI reveals a world of opportunity and innovation.
శక్తి
In 2023, Messari introduced Decentralized Physical Infrastructure Networks (డిపిన్), envisioning a landscape where blockchain transforms real-world infrastructure deployment and management. Token incentives drive construction and maintenance, fostering a market predicted to reach $3.5 trillion by 2028.
Recent strides in DePin affirm Messari’s foresight, with projects advancing toward this lofty valuation.
దృశ్యాన్ని సెట్ చేస్తోంది
DePin revolutionizes infrastructure conception, construction, and interaction, hailed as the “next blockchain frontier.” It stands as a beacon of innovation in today’s crypto landscape.
But what sets it apart? Why does DePin captivate the brightest minds in crypto?
The answer lies in its dual nature: ముందుగా, DePin harmonizes the realms of crypto and AI, offering a tangible application of both fields.
It embodies a real-world crypto use case, reshaping infrastructure development and fostering efficiency, accessibility, and innovation.
At its core, DePin employs blockchain to crowdsource infrastructure projects, tapping into collective intelligence, skills, and resources. Tokenization incentivizes and rewards contributions, fostering community engagement and investment.
Present Status of DePin
DePin’s current landscape spans over 650 projects across six core sectors: critical infrastructure computing, AI, wireless, sensors, energy, and services. Together, these initiatives boast a market capitalization surpassing $22 billion, generating around $15 million in on-chain annual recurring revenue (ARR).
Notably, the DePin network has witnessed a surge of over 600,000 nodes, indicative of significant growth trajectories.
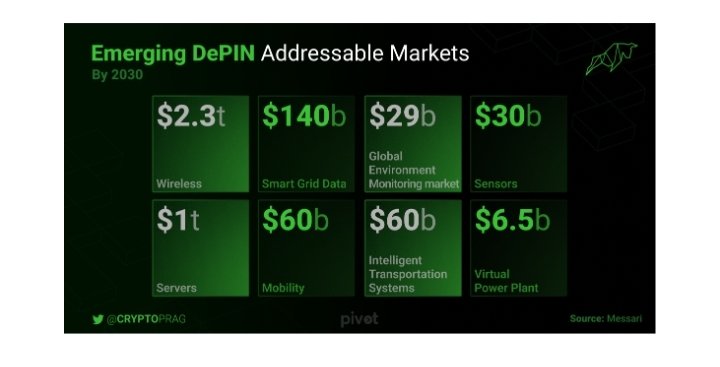
Anticipated drivers of growth include market expansion to $3.5 trillion by 2028, escalating demand for high-quality streaming and online content, increased necessity for valuable datasets spanning various industries, and a growing need for online data storage solutions and software-based DePin networks.
Moreover, the supply side is primed for expansion, with a rise in nodes and the emergence of decentralized marketplaces connecting GPU owners with rendering power-seeking creators.
Notably, DePin networks derive revenue from tangible utility rather than speculative investments, ensuring transparent and real-time payment mechanisms traceable on the blockchain. Founders in this domain prioritize the development of open-source hardware and software solutions to accelerate the growth of valuable on-chain products and services, while diverse use cases continue to emerge within the Web3 ecosystem.
Exciting Projects on DePin
Now that you’re acquainted with DePin’s essence and operational framework, let’s delve into some of the most captivating ventures within the DePin sphere.
ఏతిర్
Aethir crafts a distributed GPU-driven computational framework tailored for versatile enterprise applications.
It establishes a bridge between businesses harboring dormant GPU capabilities and sectors craving computational prowess, spanning realms like AI, virtual computing, cloud gaming, and cryptocurrency mining.
1. This approach optimizes resource allocation while providing a budget-friendly resolution for high-demand sectors, obviating the necessity for hardware investments.
2. At the core of Aethir’s ecosystem lies the $ATH token, serving as the conduit for transactions within this dynamic marketplace.
3. On the demand side, entities procure $ATH tokens to lease computational muscle, while suppliers and investors reap $ATH tokens as incentives.
4. Aethir’s dedication to reinvesting profits into acquiring $ATH fortifies its worth, positioning it as a sturdy investment choice.
Io.net
io.net offers entry to distributed GPU clusters tailored for machine learning, tackling challenges such as constrained accessibility, steep expenses, and subpar hardware selections found in centralized platforms.
1. Similar to Aethir, io.net consolidates dormant GPUs into a DePIN, furnishing substantial computational prowess for industries reliant on intensive computing tasks.
2. io.net elevates its portfolio with three distinct offerings: io.net Cloud for expandable GPU clusters, io.net Worker for computational oversight, and io.net Explorer for network analytics, furnishing a comprehensive solution tailored for both users and providers of GPU resources.
GamerHash
Introduced in 2017, GamerHash has surged by an impressive 2600% year to date, boasting a user base of 760K. Originally geared towards enabling gamers to accrue earnings via cryptocurrency mining, the platform has evolved significantly since its inception.
1. Expanding its horizons, it is now venturing into technical integrations and unveiling a fresh AI application. Its goal: is to furnish GPU capabilities for AI, 3D rendering, LLM models, and data analysis, all under the innovative DePin initiative.
2. Teaming up with AI L1 endeavors and top players in the DePin market, GamerHash is poised to emerge as a formidable B2C power supplier amid the prevailing GPU scarcity.
3. Significant achievements encompass surpassing 2 million transactions to gamers’ wallets, doling out rewards exceeding $15 million, and boasting active users whose hardware value eclipses $20 million.
4. The AI product evolution unfolds systematically, spanning from an initial proof-of-concept for GPU power contribution to the incorporation of gaming GPUs into computing marketplaces for generative AI model tasks. This strategic approach not only tackles the GPU shortage but also holds promise for resolving a significant industry challenge.
5. GamerHash’s proprietary token, GamerCoin ($GHX), boasts a total supply of 808 million tokens, with 80% already in circulation. Currently operational on both BSC and ETH networks, the platform has ambitious plans to extend its presence to Solana in the near future.
ముగింపు
In the convergence of DePin, where crypto and AI unite, lies a blueprint for a future where technology transcends boundaries, reshaping the physical world around us. As DePin continues to evolve, it serves as a testament to the boundless potential of blockchain technology and the collaborative spirit driving innovation forward.
Embracing this paradigm shift, we embark on a journey toward a more interconnected, efficient, and equitable world, propelled by the synergies of crypto, AI, and decentralized infrastructure.
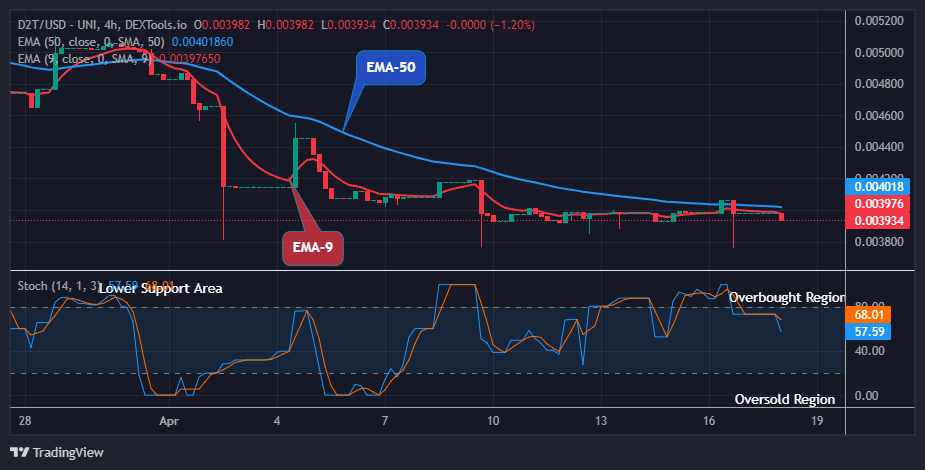
Dash 2 Trade Price Forecast: D2TUSD Will Jump Soon, Watch out for BUY! (April 19) D2TUSD will jump soon as the selling pressure is moving towards the exhaustion stage. The coin could be ready for an upward surge soon if adequate preparation is done by the bulls by exchanging hands with the sell traders at the current support level. Therefore, if the buy investors could prove harder and put a hold on the $0.00393 current support level, the bulls may drive the price action to hit the previous high of $0.00510 resistance value, which might extend further to a $0.01000 upper resistance level, registering a high potential for the coin buyers.
కీ స్థాయిలు: ప్రతిఘటన స్థాయిలు: $ 0.00500, $ 0.00600, $ 0.00700 మద్దతు స్థాయిలు: $ 0.00300, $ 0.00200, $ 0.00100
D2T (USD) దీర్ఘకాలిక ట్రెండ్: బేరిష్ (4H) మా డాష్ 2 ట్రేడ్ price is trading below the supply levels in its higher time frame. The sustained bearish pressure in the past few hours has made the cryptocurrency price remain below the supply trend levels at its recent low. This will soon be invalidated as the trend is now approaching the oversold region of the crypto market. ఇదిలా ఉండగా, ప్రస్తుత ధర D2TUSD at a $0.00393 low value below the supply trend lines has not stale the market condition of the coin. Further, investors may seize the opportunity now buy the coin at a lower price and look for more gains ahead.
Meanwhile, the price of Dash 2 Trade could reverse soon as the coin price is now moving towards the oversold region. This will enable the coin buyers to resume afterward and push the price upwards, so we can now grow in confidence that a potential buy is coming near.
If this is attained by the bulls, the price jump could hit the $0.01000 resistance level in the coming days, indicating a strong supply zone for a potential BUY in its higher time frame.
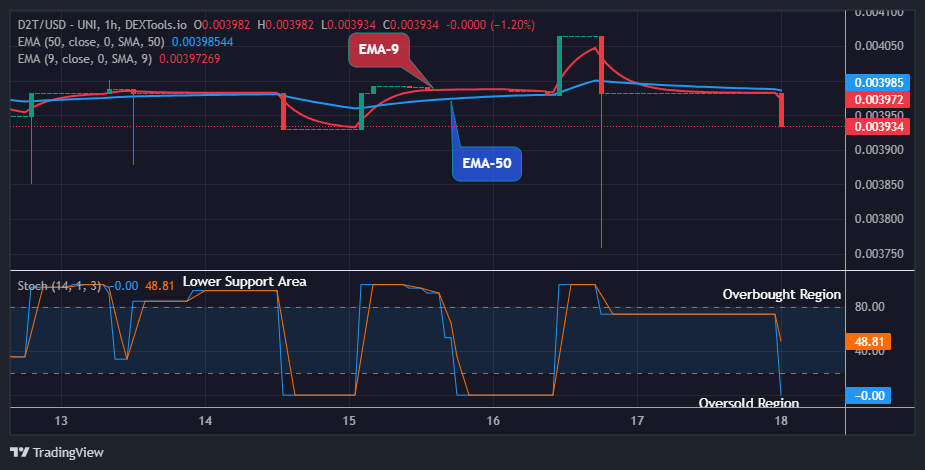
D2T (USD) మధ్యస్థ-కాల ధోరణి: బేరిష్ (1H) నాణెం మీడియం-టర్మ్ ఔట్లుక్లో బేరిష్ ట్రెండ్ మార్కెట్లో కూడా వర్తకం చేస్తుంది. ధరల ప్రవాహంపై స్వల్పకాలిక వ్యాపారుల అధిక ప్రభావం దీనికి కారణం. The persistent move by the sell traders in the previous action has dropped the coin price below the supply levels in recent times.
After a series of sideway moves, the bears drop the D2TUSD price down to a low of $0.00393 trend line below the moving averages shortly after the 1-hour chart opens today.
Further, an increase in the buying pressure might reverse the trend and push the price of డాష్ 2 ట్రేడ్ up to retest the previous high of $0.00406 mark, obtaining a higher footing to rise higher.
ఇంతలో, మార్కెట్ ధర ప్రకారం మరింత ప్రతికూలతలు అసంభవం D2TUSD has reached the oversold region. The coin will resume an uptrend soon and this may lead the price action to reach the $0.01000 upper high level in the upcoming days.
Possibly the most useful technique for enhancing your trading success is backtesting.
⚒️ Backtesting is perhaps the most valuable tool to improve your trading performance.
In many ways it’s a gamechanger, allowing you to see how your strategies will fair in real-world market conditions.
In a recent report, JPMorgan analysts shed light on the anticipated impact of the upcoming Bitcoin halving event. As the crypto community eagerly awaits this significant milestone, the question on everyone’s mind is: How will it affect the world’s most popular cryptocurrency?
Bitcoin halving, which occurs approximately every four years, is a crucial event in the cryptocurrency ecosystem. During this event, the issuance rewards for Bitcoin miners are cut in half.
Miners currently receive 6.25 BTC per block; after the halving, this reward will decrease to 3.125 BTC per block.
నివేదించిన ప్రకారం బ్లూమ్బెర్గ్, JPMorgan’s analysts assert that the current bitcoin price already has the upcoming halving priced in. In their report, they state, “We do not expect bitcoin price increases post-halving as it has already been priced in.” This perspective challenges the notion that halvings inevitably lead to price surges.
🚨JUST IN: JPMORGAN EXPECTS # బిట్కాయిన్ PRICE TO KEEP DIPPING AFTER THE HALVING!
JPMorgan’s Reasons for Cautious Expectations Around the Bitcoin Halving
According to JPMorgan analysts, the factors contributing to the cautious outlook on the upcoming బిట్కాయిన్ సగం ఉన్నాయి:
Overbought Condition Worries: Despite recent declines, JPM fears that Bitcoin remains in “overbought conditions.” This assessment is based on an analysis of open interest in bitcoin futures.
Volatility-Adjusted Price: JPMorgan’s volatility-adjusted price for bitcoin stands at $45,000. Comparing this to the current market price of $63,500 reveals that bitcoin is trading at a premium, according to the analysts.
ఉత్పత్తి ఖర్చు: The analysts highlight that Bitcoin’s price exceeds its projected production cost post-halving. With a projected cost of $42,000, the current price of around $63,500 raises concerns.
వెంచర్ క్యాపిటల్ ఫండింగ్: Despite the broader resurgence in the crypto market, venture capital funding for cryptocurrencies has been tepid this year. This lack of substantial investment could dampen price growth, per the report.
Bitcoin Hashrate and Miner Consolidation
Furthermore, the halving is expected to impact Bitcoin miners significantly. As the issuance rewards decrease, some miners may find their operations unprofitable. Consequently, we can expect a significant drop in hashrate—the computing power dedicated to securing the network.
However, JPMorgan believes that publicly listed mining companies are likely to weather the storm better than smaller players. Likewise, consolidation among miners is expected, with larger firms dominating the landscape.
In response to reduced profitability, mining firms may explore diversification. Regions with lower energy costs, such as Latin America or Africa, could become attractive destinations. Repurposing inefficient mining rigs for salvage value might also be on the agenda for struggling miners.
While some speculate that miners could switch to mining Bitcoin hard fork cryptocurrencies, JPMorgan’s analysts dismiss this as “highly unlikely.” These specialized rigs are optimized for Bitcoin mining, and venturing into smaller-cap altcoins would likely yield little profit.
In summary, the Bitcoin halving is set to bring both challenges and opportunities. As the crypto community watches closely, the market’s response will ultimately determine the fate of digital gold.
క్రిప్టో మార్కెట్ను వర్తకం చేసేటప్పుడు, అది ఉండవలసిన అవసరం లేదు "హిట్ ఆర్ మిస్." మా ప్రీమియం లాగానే ఫలితాలను ఇచ్చే ట్రేడ్లతో మీ పోర్ట్ఫోలియోను భద్రపరచుకోండి క్రిప్టో సిగ్నల్స్ టెలిగ్రామ్లో.
Quant (QNT) has rebounded impressively from its recent low of $85 just five days ago, currently trading at $108. The token has a market cap of $1,289,345,778 USD and a 24-hour trading volume of $18,415,618 USD.
Quant is up 4.58% in the last 24 hours and holds a CoinMarketCap ranking of #68. Strong demand and positive sentiment surround the project, fueled by its focus on blockchain interoperability and strategic భాగస్వామ్యాలు.
Whether QNT can sustain its bull run depends on broader market trends and future developments, including regulatory clarity and advancements in the Quant Network.
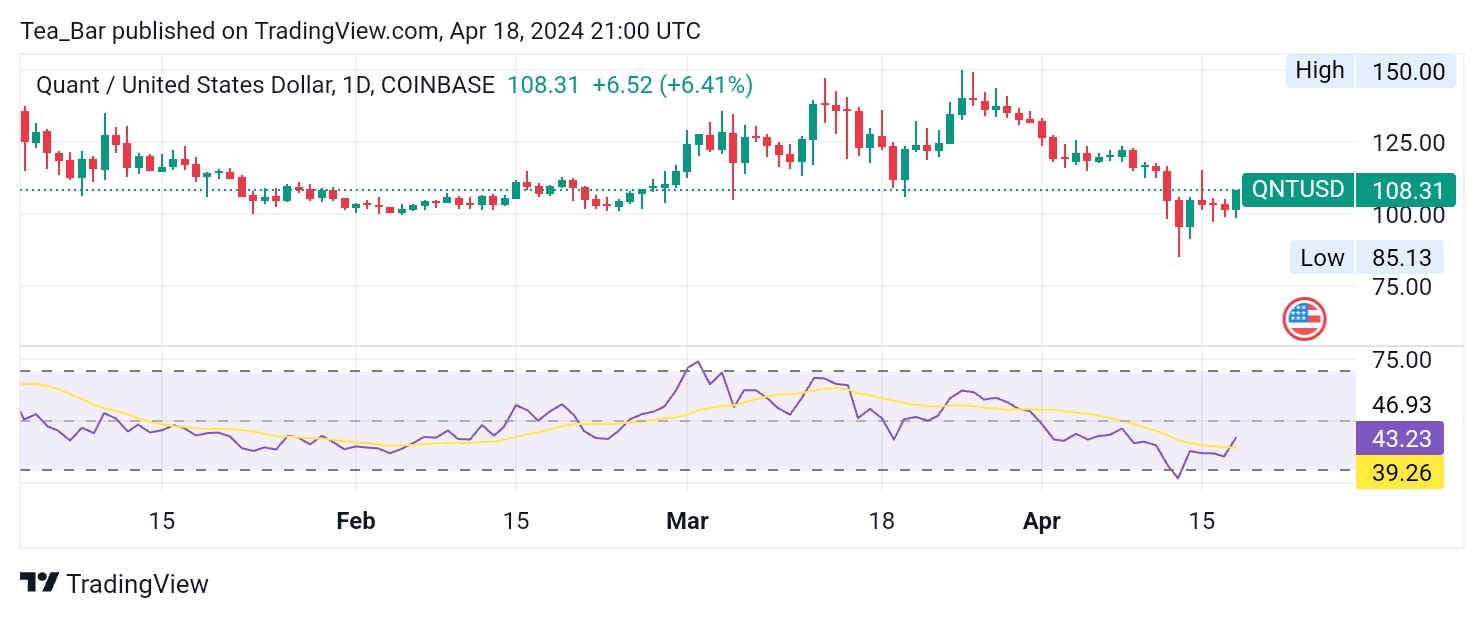
QNT/USD దీర్ఘకాలిక ట్రెండ్: బుల్లిష్ (డైలీ చార్ట్) ముఖ్య స్థాయిలు: ప్రతిఘటన స్థాయిలు: $ 110, $ 112, $ 114 మద్దతు స్థాయిలు: $ 105, $ 103, $ 100 quant (QNT) has exhibited a strong rebound in the daily market, rising from a low of $85 to $108. This price movement is backed by the daily Relative Strength Index (RSI) reading of 43.23.
An RSI of 43.23 suggests the market is in a neutral zone, indicating potential for further movement to a bullish region. While the RSI is close to the oversold threshold, it provides space for future price growth without reaching the overbought range.
This technical indicator highlights a balanced market environment, where QNT can continue its upward trend. Overall, Quant’s market activity reflects sustained positive sentiment and potential for ongoing growth.
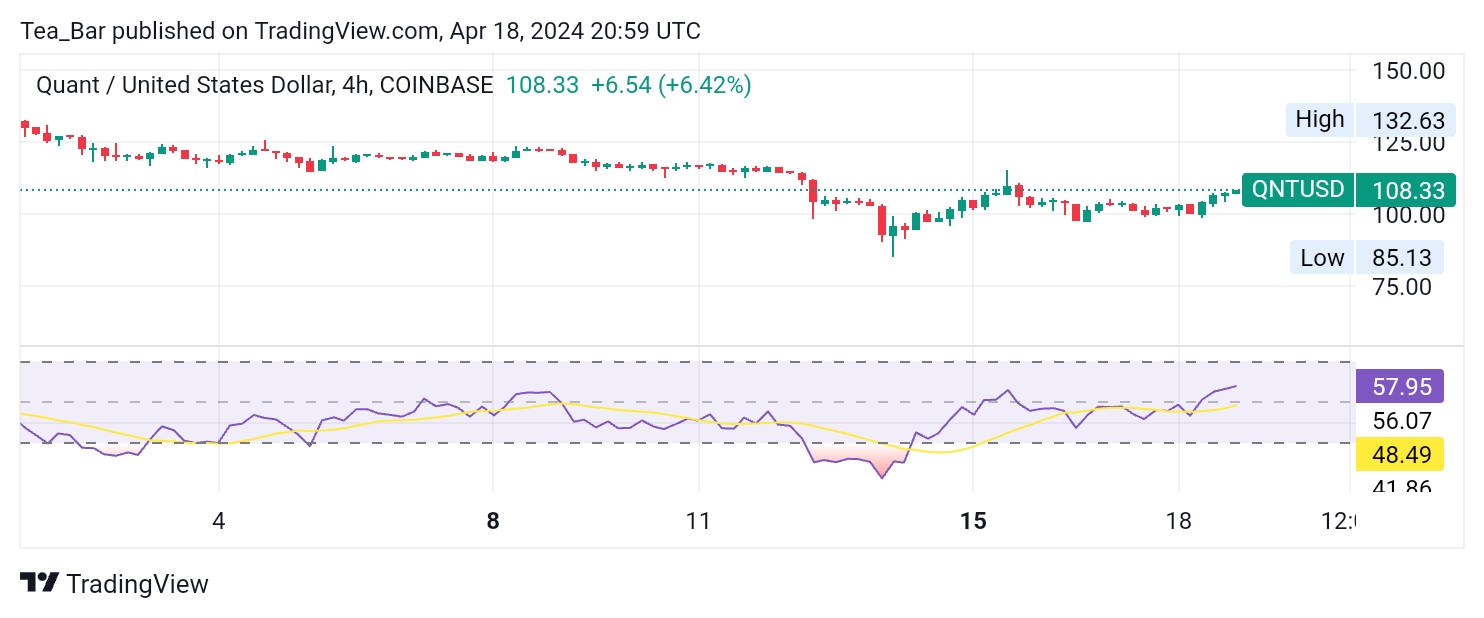
QNTUSD Medium-term Trend: Bullish (4H chart) Quant (QNT) has displayed notable upward momentum in the 4-hour market. The 4-hour Relative Strength Index (RSI) stands at 57.95, pointing to a market with moderate bullishness.This RSI value signals potential for additional price gains while remaining safely below the overbought threshold. The market’s intermediate-term outlook is optimistic, with Quant’s steady rise suggesting strong demand and positive expectations for future growth. The 4-hour chart provides a snapshot of sustained bullish sentiment, paving the way for further upward movement in the near term.
Quant (QNT) Positioned for Continued Bullish Trajectory The token’s rapid recovery from a low of $85 to $108, coupled with a market cap exceeding $1.28 billion and a strong 24-hour trading volume, underscores robust interest and optimism surrounding the project.The daily Relative Strength Index (RSI) of 43.23 suggests a neutral stance in the market, indicating potential for continued price appreciation.
Meanwhile, the 4-hour RSI of 57.95 reveals moderate bullish momentum, pointing to further gains.Quant’s emphasis on blockchain interoperability and strategic alliances is fostering a wave of enthusiasm around its future prospects.
This, combined with a balanced market and consistent demand, indicates QNT is on track for sustained upward movement in the coming days.
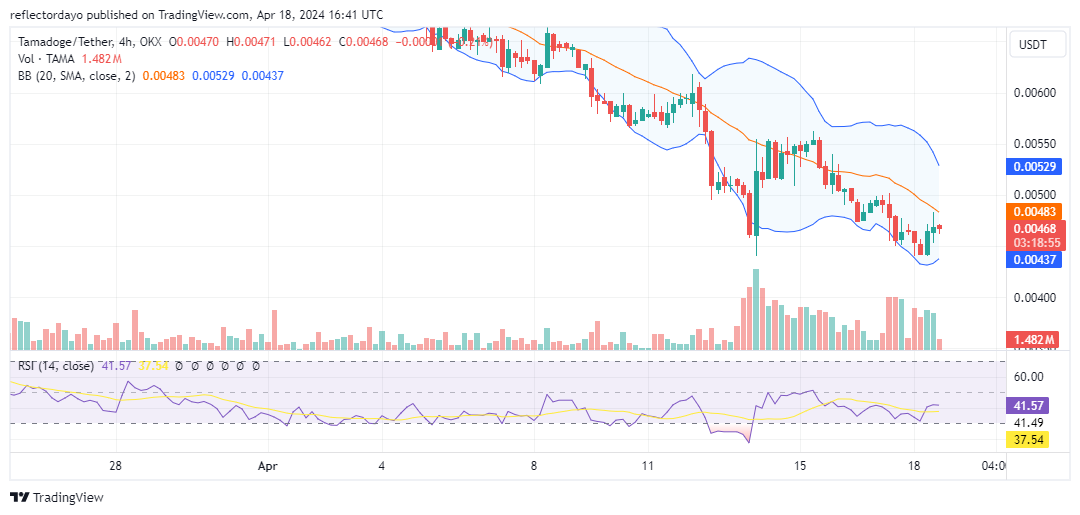
The Tamadoge market exhibited heightened volatility subsequent to a decline below the $0.00005 price threshold, following a protracted struggle for market dominance between bullish and bearish forces. This escalation in volatility can be attributed to the significance of the $0.00005 level as a key support zone; its breach elicited a pronounced bearish sentiment among traders. As a result, bulls were compelled to regroup around the $0.000045 mark. Leveraging the increased volatility, they have since managed to muster significant momentum, steering the market towards a resurgence in bullish sentiment.
కీ స్థాయిలు
ప్రతిఘటన: $0.013, $0.014 మరియు $0.015.
మద్దతు: $0.0045, $0.0040 మరియు $0.0035.
TAMA/USD ధర విశ్లేషణ: సూచికల పాయింట్ ఆఫ్ వ్యూ
Bulls have begun to converge at the $0.000045 price level, marking a pivotal juncture from which they are initiating a reversal of the market’s trajectory towards the upside. However, this bullish momentum faces considerable resistance. In the preceding 4-hour trading session, the క్రిప్టో సిగ్నాl featured a candlestick with a small body and long upper and lower shadows, indicating a balance between demand and supply. Currently, the bullish recovery appears capped around $0.000047, while the Bollinger Bands continue to delineate a downward-trending price channel. The initial step towards reorienting the తమదోగే market in an upward direction may entail a consolidation phase. Subsequently, as bearish sentiment dissipates at this level, a price ascent is anticipated.
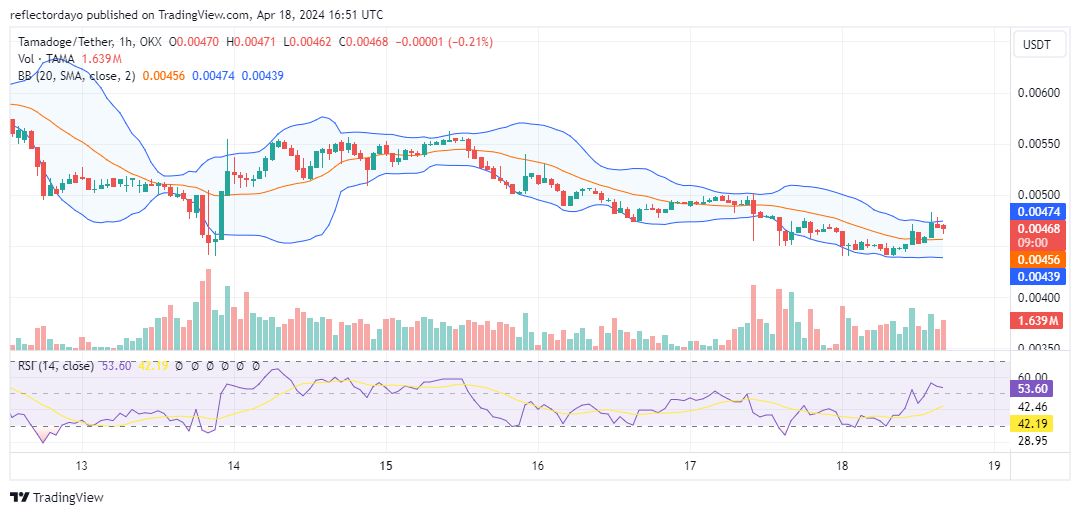
Tamadoge స్వల్పకాలిక ఔట్లుక్: 1-గంటల చార్ట్
The market’s 1-hour timeframe also indicates a ranging trend. Upon reaching the $0.000045 price level during the bearish phase, the market exhibited a period of stagnation, attributed to significant bullish activity at this level. Shortly thereafter, a bullish reversal was observed, driving the market upward. Nevertheless, bearish resistance has emerged at $0.000047. Presently, bullish pressure is evident at this resistance level, with the price action maintaining a position above the 20-day moving average.
Get your fair share of $TAMA in this play-to-earn runner game with lively graphics, humorous characters, and quick gameplay.
Tamadoge Pursuit is out now 🐶🏃
With Vibrant graphics, quirky characters, and fast-paced gameplay, earn your share of $సరి on this play to earn runner game.
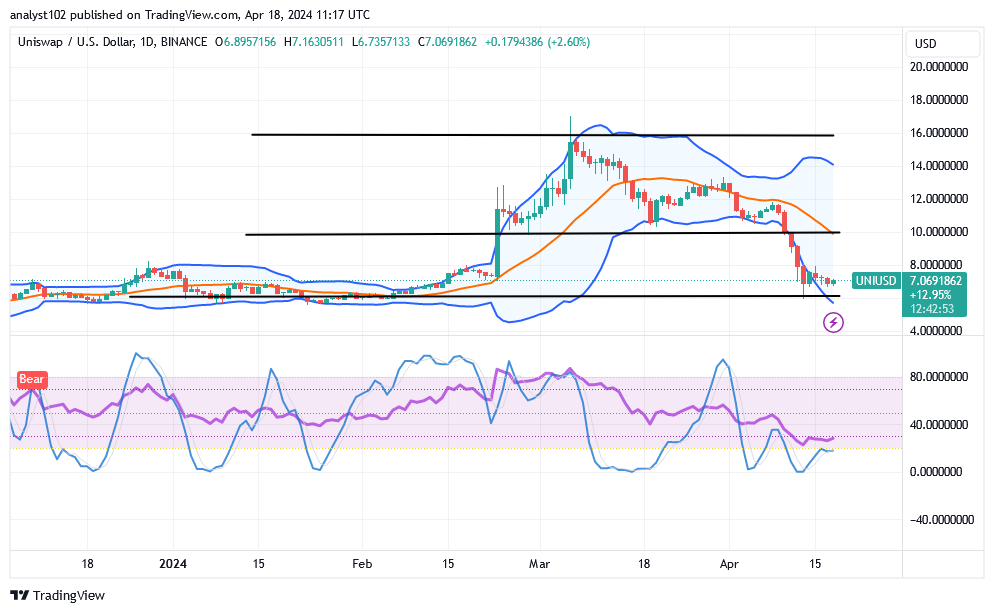
Quite some momentum has been allowed to go in the way of declines while bulls and bears have been struggling against others around indicators’ imaginary spots of trending, given that the UNI/USD మార్కెట్ is presently building footsteps, hovering around the value line of $7.
Over a couple of days back, forces to the south direction around the lower Bollinger Band trend line have been made to be losing capacities gradually in a line of trying to produce a probable long range of low price actions that are majorly expected to give in back to smooth paths toward securing stable increases thereof.
UNI / USD మార్కెట్ కీ స్థాయిలు: ప్రతిఘటన స్థాయిలు: $ 9, $ 11, $ 13 మద్దతు స్థాయిలు: $ 6, $ 5, $ 4
UNI / USD - డైలీ చార్ట్ The UNI/USD daily chart reveals the crypto-economic market is building footsteps around the line of $7, as the price is hovering around the line.
The stochastic oscillators have been observed, over some sessions to have been swinging around some points not too far above the oversold region. And they do dip mostly in the area many times to signify that forces to the reduction direction are getting weaker.
Can there be additional avenues for the downside given that the BTC/USD market is currently trading near $7?
It would be out of technical principle method of trading for sellers to go further to the downside, given that the UNI/USD market is currently building footsteps, hovering around the point of $7.
Some indicators are at considerably to the downside to touch maximal decrease spots that are psychologically ideal for buyers to get reshape toward getting decent entries to make comebacks. Looking at the effect of he corrections, the market has been made to put in back for another round of moving into rising direction.
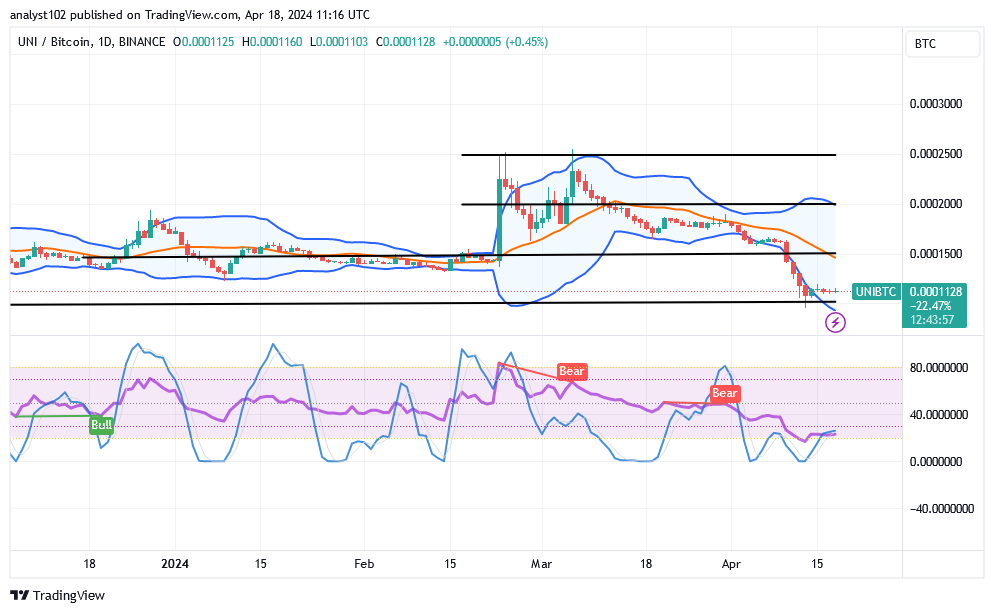
Right now, bears need to exercise caution while positioning themselves in relation to the lower Bollinger Band trend line. One of he reasons backing that logical thoughts is that an oversold reading condition has depicted by the stochastic oscillators to imply that it would be riskier for sellers to run safely on a profiteering manner even if there will be a line of delays in he price actions. UNI / BTC ధర విశ్లేషణ దీనికి విరుద్ధంగా, ది యూనిస్వాప్ ట్రేడ్ is currently building footsteps against the valuation of Botcoin, hovering around the lower Bollinger Band.
The stochastic oscillators have been seen swinging around the oversold region with less out of the spots to the upside. . The lower moving component of the Bollinger Band trend lines has been in a losing condition, indicating that there is pressure on the base crypto economy to decrease. Nevertheless, it doesn’t appear that the trends are becoming more severe in order to decline freely. \ గమనిక:Cryptosignals.org ఆర్థిక సలహాదారు కాదు. ఏదైనా ఆర్థిక ఆస్తి లేదా సమర్పించిన ఉత్పత్తి లేదా ఈవెంట్లో మీ నిధులను పెట్టుబడి పెట్టడానికి ముందు మీ పరిశోధన చేయండి. మీ పెట్టుబడి ఫలితాలకు మేము బాధ్యత వహించము.