Bitcoin Halving: นักวิเคราะห์ JPMorgan คาดว่า BTC จะลดลง

In a recent report, JPMorgan analysts shed light on the anticipated impact of the upcoming Bitcoin halving event. As the crypto community eagerly awaits this significant milestone, the question on everyone’s mind is: How will it affect the world’s most popular cryptocurrency?

Bitcoin halving, which occurs approximately every four years, is a crucial event in the cryptocurrency ecosystem. During this event, the issuance rewards for Bitcoin miners are cut in half.

Miners currently receive 6.25 BTC per block; after the halving, this reward will decrease to 3.125 BTC per block.

รายงานโดย บลูมเบิร์ก, JPMorgan’s analysts assert that the current bitcoin price already has the upcoming halving priced in. In their report, they state, “We do not expect bitcoin price increases post-halving as it has already been priced in.” This perspective challenges the notion that halvings inevitably lead to price surges.

JPMorgan’s Reasons for Cautious Expectations Around the Bitcoin Halving

According to JPMorgan analysts, the factors contributing to the cautious outlook on the upcoming Bitcoin ลดลงครึ่งหนึ่ง รวมถึง:

  • Overbought Condition Worries: Despite recent declines, JPM fears that Bitcoin remains in “overbought conditions.” This assessment is based on an analysis of open interest in bitcoin futures.
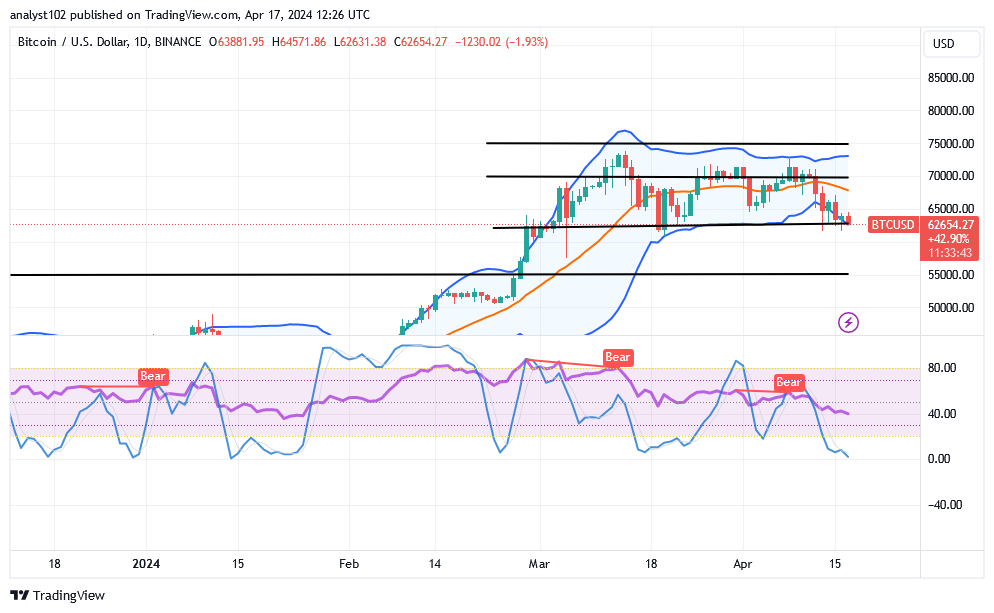
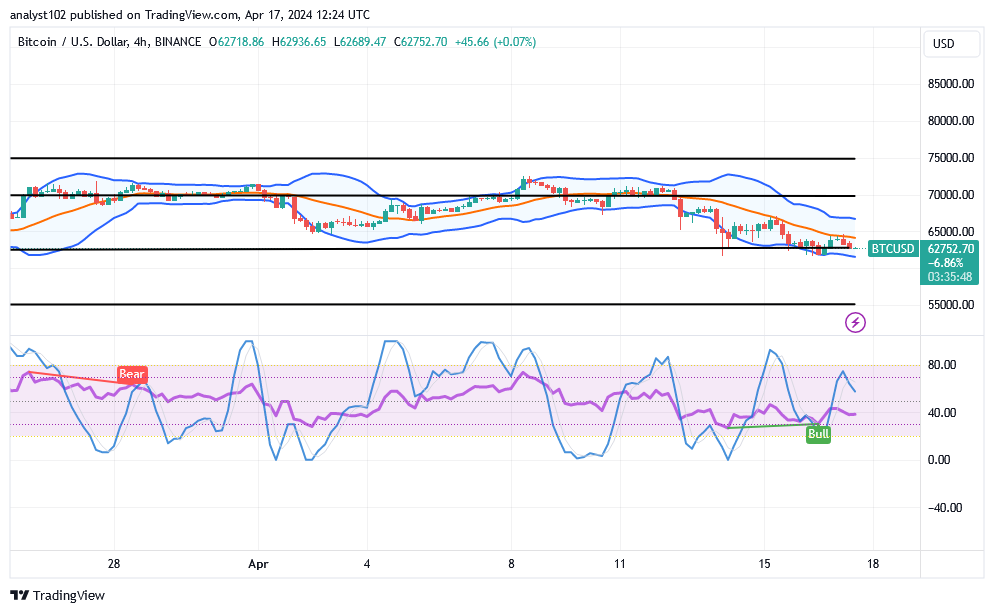
  • Volatility-Adjusted Price: JPMorgan’s volatility-adjusted price for bitcoin stands at $45,000. Comparing this to the current market price of $63,500 reveals that bitcoin is trading at a premium, according to the analysts.
  • ต้นทุนการผลิต: The analysts highlight that Bitcoin’s price exceeds its projected production cost post-halving. With a projected cost of $42,000, the current price of around $63,500 raises concerns.
  • การระดมทุนจากการร่วมลงทุน: Despite the broader resurgence in the crypto market, venture capital funding for cryptocurrencies has been tepid this year. This lack of substantial investment could dampen price growth, per the report.

Bitcoin Hashrate and Miner Consolidation

Furthermore, the halving is expected to impact Bitcoin miners significantly. As the issuance rewards decrease, some miners may find their operations unprofitable. Consequently, we can expect a significant drop in hashrate—the computing power dedicated to securing the network.

However, JPMorgan believes that publicly listed mining companies are likely to weather the storm better than smaller players. Likewise, consolidation among miners is expected, with larger firms dominating the landscape.

In response to reduced profitability, mining firms may explore diversification. Regions with lower energy costs, such as Latin America or Africa, could become attractive destinations. Repurposing inefficient mining rigs for salvage value might also be on the agenda for struggling miners.

While some speculate that miners could switch to mining Bitcoin hard fork cryptocurrencies, JPMorgan’s analysts dismiss this as “highly unlikely.” These specialized rigs are optimized for Bitcoin mining, and venturing into smaller-cap altcoins would likely yield little profit.

In summary, the Bitcoin halving is set to bring both challenges and opportunities. As the crypto community watches closely, the market’s response will ultimately determine the fate of digital gold.

เมื่อซื้อขายตลาด crypto ไม่จำเป็นต้องเป็นเช่นนั้น "โดนหรือพลาด." ปกป้องพอร์ตโฟลิโอของคุณด้วยการซื้อขายที่ให้ผลลัพธ์จริง เช่นเดียวกับพรีเมี่ยมของเรา สัญญาณการเข้ารหัสลับ บนโทรเลข


สนใจที่จะเรียนรู้วิธีการซื้อขาย crypto รายวันหรือไม่? รับข้อมูลทั้งหมดที่คุณต้องการที่นี่

Quant (QNT) จะยังคงวิ่งกระทิงต่อไปหลังจากระดับต่ำสุดที่ 85 ดอลลาร์หรือไม่

Quant (QNT) ดีดตัวขึ้นอย่างน่าประทับใจจากระดับต่ำสุดล่าสุดที่ 85 ดอลลาร์เมื่อห้าวันก่อน โดยปัจจุบันซื้อขายที่ 108 ดอลลาร์ โทเค็นมีมูลค่าตลาดอยู่ที่ $1,289,345,778 USD และปริมาณการซื้อขายตลอด 24 ชั่วโมงอยู่ที่ $18,415,618 USD

Quant เพิ่มขึ้น 4.58% ในช่วง 24 ชั่วโมงที่ผ่านมา และครองอันดับ CoinMarketCap ที่ #68 ความต้องการที่แข็งแกร่งและทัศนคติเชิงบวกล้อมรอบโครงการ โดยได้รับแรงหนุนจากการมุ่งเน้นไปที่การทำงานร่วมกันและกลยุทธ์ของบล็อกเชน ความร่วมมือ.

QNT จะสามารถรักษาภาวะกระทิงได้หรือไม่นั้น ขึ้นอยู่กับแนวโน้มของตลาดในวงกว้างและการพัฒนาในอนาคต รวมถึงความชัดเจนด้านกฎระเบียบและความก้าวหน้าใน Quant Network

QNT/USD แนวโน้มระยะยาว: รั้น (กราฟรายวัน)
ระดับที่สำคัญ:
ระดับความต้านทาน: $ 110, $ 112, $ 114
ระดับการสนับสนุน: $ 105, $ 103, $ 100
Quant (QNT) จะยังคงวิ่งกระทิงต่อไปหลังจากระดับต่ำสุดที่ 85 ดอลลาร์หรือไม่
ควอนท์ (QNT) มีการฟื้นตัวอย่างแข็งแกร่งในตลาดรายวัน โดยเพิ่มขึ้นจากระดับต่ำสุดที่ 85 ดอลลาร์เป็น 108 ดอลลาร์ การเคลื่อนไหวของราคานี้ได้รับการสนับสนุนจาก Relative Strength Index (RSI) รายวันที่อ่านได้ 43.23

RSI ที่ 43.23 บ่งชี้ว่าตลาดอยู่ในโซนเป็นกลาง ซึ่งบ่งชี้ถึงศักยภาพในการเคลื่อนไหวต่อไปสู่ภูมิภาคกระทิง แม้ว่า RSI จะอยู่ใกล้กับเกณฑ์การขายมากเกินไป แต่ก็ให้พื้นที่สำหรับการเติบโตของราคาในอนาคตโดยไม่ต้องถึงช่วงการซื้อมากเกินไป

ตัวบ่งชี้ทางเทคนิคนี้เน้นย้ำถึงสภาพแวดล้อมทางการตลาดที่สมดุล ซึ่ง QNT สามารถดำเนินแนวโน้มขาขึ้นต่อไปได้ โดยรวมแล้ว กิจกรรมทางการตลาดของ Quant สะท้อนให้เห็นถึงความรู้สึกเชิงบวกที่ยั่งยืนและศักยภาพในการเติบโตอย่างต่อเนื่อง

QNTUSD แนวโน้มระยะกลาง: รั้น (กราฟ 4H)
Quant (QNT) มีโมเมนตัมขาขึ้นที่โดดเด่นในตลาด 4 ชั่วโมง Relative Strength Index (RSI) 4 ชั่วโมงอยู่ที่ 57.95 ชี้ไปที่ตลาดที่มีภาวะกระทิงปานกลาง ค่า RSI นี้ส่งสัญญาณถึงความเป็นไปได้ที่ราคาจะเพิ่มขึ้นเพิ่มเติม ในขณะที่ยังคงอยู่ต่ำกว่าเกณฑ์การซื้อมากเกินไปอย่างปลอดภัย
Quant (QNT) จะยังคงวิ่งกระทิงต่อไปหลังจากระดับต่ำสุดที่ 85 ดอลลาร์หรือไม่
แนวโน้มระยะกลางของตลาดเป็นไปในแง่ดี โดยการเติบโตอย่างต่อเนื่องของ Quant บ่งบอกถึงอุปสงค์ที่แข็งแกร่งและความคาดหวังเชิงบวกสำหรับการเติบโตในอนาคต กราฟราย 4 ชั่วโมงให้ภาพรวมของความเชื่อมั่นขาขึ้นที่ยั่งยืน ปูทางสำหรับการเคลื่อนไหวขาขึ้นต่อไปในระยะเวลาอันใกล้

Quant (QNT) อยู่ในตำแหน่งสำหรับวิถีกระทิงต่อเนื่อง
การฟื้นตัวอย่างรวดเร็วของโทเค็นจากระดับต่ำสุดที่ 85 ดอลลาร์เป็น 108 ดอลลาร์ ประกอบกับมูลค่าตลาดที่เกิน 1.28 พันล้านดอลลาร์ และปริมาณการซื้อขายที่แข็งแกร่งตลอด 24 ชั่วโมง ตอกย้ำถึงความสนใจที่แข็งแกร่งและการมองโลกในแง่ดีโดยรอบโครงการ ดัชนี Relative Strength Index (RSI) รายวันที่ 43.23 บ่งชี้ว่า จุดยืนที่เป็นกลางในตลาด บ่งชี้ถึงศักยภาพในการแข็งค่าของราคาอย่างต่อเนื่อง

ในขณะเดียวกัน RSI 4 ชั่วโมงที่ 57.95 เผยให้เห็นโมเมนตัมขาขึ้นในระดับปานกลาง ซึ่งชี้ไปที่การเพิ่มขึ้นอีก Quant ให้ความสำคัญกับ blockchain การทำงานร่วมกันและพันธมิตรเชิงกลยุทธ์กำลังส่งเสริมกระแสความกระตือรือร้นเกี่ยวกับโอกาสในอนาคต

เมื่อรวมกับตลาดที่สมดุลและความต้องการที่สอดคล้องกัน บ่งชี้ว่า QNT กำลังอยู่ในเส้นทางที่จะมีการเคลื่อนไหวขาขึ้นอย่างต่อเนื่องในอีกไม่กี่วันข้างหน้า

ทำการซื้อขาย Quant ที่ชนะกับเรา รับ QNT โปรดคลิกที่นี่เพื่ออ่านรายละเอียดเพิ่มเติม.

Tamadoge (TAMA/USD) ฟื้นตัวจากระดับราคาต่ำกว่า $0.005

The Tamadoge market exhibited heightened volatility subsequent to a decline below the $0.00005 price threshold, following a protracted struggle for market dominance between bullish and bearish forces. This escalation in volatility can be attributed to the significance of the $0.00005 level as a key support zone; its breach elicited a pronounced bearish sentiment among traders. As a result, bulls were compelled to regroup around the $0.000045 mark. Leveraging the increased volatility, they have since managed to muster significant momentum, steering the market towards a resurgence in bullish sentiment.

ระดับคีย์

  • แนวต้าน: $0.013, $0.014 และ $0.015
  • การสนับสนุน: 0.0045 ดอลลาร์ 0.0040 ดอลลาร์ และ 0.0035 ดอลลาร์

Tamadoge (TAMA/USD) ฟื้นตัวจากระดับราคาต่ำกว่า $0.005

การวิเคราะห์ราคา TAMA/USD: มุมมองของอินดิเคเตอร์

Bulls have begun to converge at the $0.000045 price level, marking a pivotal juncture from which they are initiating a reversal of the market’s trajectory towards the upside. However, this bullish momentum faces considerable resistance. In the preceding 4-hour trading session, the สัญญาณการเข้ารหัสลับl featured a candlestick with a small body and long upper and lower shadows, indicating a balance between demand and supply. Currently, the bullish recovery appears capped around $0.000047, while the Bollinger Bands continue to delineate a downward-trending price channel. The initial step towards reorienting the ทามาโดเกะ market in an upward direction may entail a consolidation phase. Subsequently, as bearish sentiment dissipates at this level, a price ascent is anticipated.

Tamadoge (TAMA/USD) ฟื้นตัวจากระดับราคาต่ำกว่า $0.005

แนวโน้มระยะสั้น Tamadoge: แผนภูมิ 1 ชั่วโมง

The market’s 1-hour timeframe also indicates a ranging trend. Upon reaching the $0.000045 price level during the bearish phase, the market exhibited a period of stagnation, attributed to significant bullish activity at this level. Shortly thereafter, a bullish reversal was observed, driving the market upward. Nevertheless, bearish resistance has emerged at $0.000047. Presently, bullish pressure is evident at this resistance level, with the price action maintaining a position above the 20-day moving average.

Get your fair share of $TAMA in this play-to-earn runner game with lively graphics, humorous characters, and quick gameplay.

คุณต้องการเหรียญที่จะมีมูลค่าเพิ่มขึ้น 100 เท่าในอีกไม่กี่เดือนข้างหน้าหรือไม่? นั่นมันทามาโดเกะ ซื้อ TAMA วันนี้!

การค้า Uniswap (UNI/USD) กำลังสร้างความก้าวหน้า โดยอยู่ที่ $7

การทำนายราคา Uniswap - 18 เมษายน

โมเมนตัมค่อนข้างมากได้รับอนุญาตให้เข้าสู่ขาลง ในขณะที่ตลาดกระทิงและตลาดหมีกำลังดิ้นรนต่อสู้กับตลาดอื่น ๆ เกี่ยวกับจุดที่ตัวบ่งชี้ในจินตนาการของแนวโน้ม โดยพิจารณาจาก UNI/USD ตลาด ปัจจุบันกำลังสร้างรอยเท้า โดยวนเวียนอยู่รอบๆ เส้นมูลค่าที่ 7 ดอลลาร์

เมื่อสองสามวันก่อน แรงไปทางทิศใต้รอบเส้นแนวโน้ม Bollinger Band ที่ต่ำกว่าได้สูญเสียความสามารถไปทีละน้อยในแนวที่พยายามสร้างการเคลื่อนไหวของราคาต่ำในระยะยาวที่น่าจะเป็นไปได้ ซึ่งส่วนใหญ่คาดว่าจะตอบแทนกลับ สู่เส้นทางที่ราบเรียบไปสู่การเพิ่มขึ้นอย่างมั่นคง

ตลาด UNI / USD
ระดับสำคัญ:
ระดับแนวต้าน: $ 9, $ 11, $ 13
ระดับการสนับสนุน: $ 6, $ 5, $ 4

UNI / USD - กราฟรายวัน
แผนภูมิรายวันของ UNI/USD เผยให้เห็นว่าตลาดเศรษฐกิจสกุลเงินดิจิทัลกำลังก้าวไปรอบๆ เส้น $7 เนื่องจากราคากำลังวนเวียนอยู่รอบๆ เส้น

มีการสังเกต stochastic oscillators ในบางช่วงที่มีการแกว่งไปรอบ ๆ จุดหนึ่งซึ่งอยู่ไม่ไกลจากบริเวณที่ขายมากเกินไป และส่วนใหญ่จะจุ่มลงในพื้นที่หลายครั้งเพื่อแสดงว่าแรงที่มุ่งสู่ทิศทางการลดกำลังอ่อนลง
การค้า Uniswap (UNI/USD) กำลังสร้างความก้าวหน้า โดยอยู่ที่ $7

จะมีช่องทางเพิ่มเติมสำหรับข้อเสียหรือไม่เนื่องจากตลาด BTC/USD ซื้อขายใกล้ระดับ $7 ในปัจจุบัน

มันจะนอกเหนือหลักการทางเทคนิคในการซื้อขายสำหรับผู้ขายที่จะก้าวไปสู่ข้อเสียต่อไป เนื่องจาก ตลาด UNI/USDขณะนี้กำลังสร้างรอยเท้า โดยอยู่ที่ประมาณ 7 ดอลลาร์

ตัวชี้วัดบางตัวมีข้อเสียอย่างมากในการแตะจุดลดลงสูงสุด ซึ่งเป็นอุดมคติทางจิตวิทยาสำหรับผู้ซื้อในการปรับเปลี่ยนไปสู่การได้รับรายการที่เหมาะสมเพื่อกลับมา เมื่อพิจารณาถึงผลกระทบของการปรับฐาน ตลาดได้เตรียมการกลับเข้าสู่ทิศทางขาขึ้นอีกรอบ

ขณะนี้ ตลาดหมีจำเป็นต้องใช้ความระมัดระวังในขณะที่วางตำแหน่งตัวเองให้สัมพันธ์กับเส้นแนวโน้ม Bollinger Band ที่ต่ำกว่า เหตุผลประการหนึ่งที่สนับสนุนความคิดเชิงตรรกะนั้นก็คือ สภาพการอ่านที่ขายมากเกินไปนั้นแสดงให้เห็นโดย stochastic oscillators เพื่อบอกเป็นนัยว่ามันจะมีความเสี่ยงมากกว่าสำหรับผู้ขายที่จะทำงานอย่างปลอดภัยในลักษณะเก็งกำไร แม้ว่าจะมีความล่าช้าในการเคลื่อนไหวของราคาก็ตาม
การค้า Uniswap (UNI/USD) กำลังสร้างความก้าวหน้า โดยอยู่ที่ $7
การวิเคราะห์ราคา UNI / BTC
ในทางตรงกันข้าม ซื้อขาย Uniswap ขณะนี้กำลังสร้างรอยเท้าต่อต้านการประเมินมูลค่าของ Botcoin โดยวนเวียนอยู่รอบ ๆ Bollinger Band ที่ต่ำกว่า

มีการพบว่า stochastic oscillators แกว่งไปรอบๆ บริเวณที่มีการขายมากเกินไป โดยมีจุดกลับหัวน้อยกว่า - องค์ประกอบที่เคลื่อนไหวด้านล่างของเส้นแนวโน้ม Bollinger Band อยู่ในสภาพที่สูญเสีย ซึ่งบ่งชี้ว่ามีแรงกดดันต่อเศรษฐกิจสกุลเงินดิจิทัลพื้นฐานให้ลดลง อย่างไรก็ตาม ดูเหมือนว่าแนวโน้มจะไม่รุนแรงขึ้นจนสามารถลดลงได้อย่างอิสระ
\
หมายเหตุ Cryptosignals.org ไม่ใช่ที่ปรึกษาทางการเงิน ทำการวิจัยของคุณก่อนที่จะลงทุนเงินของคุณในสินทรัพย์ทางการเงินหรือผลิตภัณฑ์หรือเหตุการณ์ที่นำเสนอ เราไม่รับผิดชอบต่อผลการลงทุนของคุณ


คุณสามารถซื้อ Lucky Block ได้ที่นี่ ซื้อ LBLOCK

$SPONGE (SPONGE/USD) แสดงสัญญาณความแข็งแกร่ง แนวโน้มขาขึ้นที่เป็นไปได้

Over the preceding two days, our observations revealed prolonged stability in the ฟองน้ำ/USD market, characterized by a consistent presence around the $0.000045 price level. During this period, price action remained stagnant, resulting in a flat trajectory. The equilibrium persisted due to an apparent deadlock between supply and demand, rendering both bulls and bears incapable of exerting significant influence. Notably, the market maintained a static state at the $0.000045 price level.

However, according to today’s สัญญาณเข้ารหัส, we noted sudden market developments indicating a potential shift in sentiment, hinting at the possibility of an impending upswing.

การเปลี่ยนแปลงของตลาดที่สำคัญ:

  • ระดับความต้านทาน: $0.0010, $0.0011 และ $0.0012
  • ระดับการสนับสนุน: 0.000035 ดอลลาร์ 0.000030 ดอลลาร์และ 0.000025 ดอลลาร์

$SPONGE (SPONGE/USD) แสดงสัญญาณความแข็งแกร่ง แนวโน้มขาขึ้นที่เป็นไปได้

เจาะลึกการวิเคราะห์ทางเทคนิคสำหรับ $SPONGE (SPONGE/USD):

While the market gridlock persisted, a significant breakout occurred in the bear market during the initial trading session of the day, driving prices down to the $0.000023 level. Subsequently, the following trading session witnessed a surge in bullish sentiment, leading traders to capitalize on the dip and elevating the market back to the $0.000045 level. This rapid and volatile price swing repeated itself in the third trading session.

The resilience displayed by the bulls in swiftly recovering from the test of lower price levels underscores their strength within this price range. As the bull market gathers momentum, it is conceivable that subsequent tests of lower levels may result in the establishment of higher lows. Such occurrences could potentially catalyze a bullish breakout above the $0.000045 level, signaling the emergence of a bullish trend.

$SPONGE (SPONGE/USD) แสดงสัญญาณความแข็งแกร่ง แนวโน้มขาขึ้นที่เป็นไปได้

ข้อมูลเชิงลึกจากมุมมอง 1 ชั่วโมง:

Higher lows have begun to emerge on the SPONGE/USD market chart, as observed from the 1-hour chart perspective. This development signifies a positive trend for bullish traders, indicating a gradual accumulation of bullish momentum. However, a slight adjustment in the resistance level, shifting from $0.000045 to approximately $0.000044, suggests a temporary claim by bears for this resistance threshold. Yet, given the persistent strength exhibited by the bulls, there is potential for this price level to eventually yield.

Wonderful news! Over 9.8 million $SPONGE coins have been staked as of right now!

ลงทุนในเหรียญมีมที่ร้อนแรงและดีที่สุด ซื้อฟองน้ำ ($SPONGE) วันนี้!

ราคา Bitcoin (BTC/USD) กำลังลดลง กำลังคาดเดาฐาน

การทำนายราคา Bitcoin - 17 เมษายน

It has been significantly demonstrated that the process that could let bulls regain their stances in the BTC/USD การค้า against bears has not been gaining a healthy weight, given that the crypto business is presently lowering and conjecturing a base reconstruction move around the point of $60,000.

If the correction movements that have taken center stage in the exchange lines continue, it would be a shocking move that would eventually see the price of the cryptocurrency drop much lower, to a support level of $50,000. However, given that the cycle of rebounding has been garnering a lot of attention this month, that scenario might not offer a highly technical arrangement setup to achieve excellent shorting entry.

ตลาด BTC / USD
ระดับสำคัญ:
ระดับแนวต้าน: $ 70,000, $ 75,000, $ 80,000
ระดับการสนับสนุน: $ 55,000, $ 52,500, $ 50,000

BTC / USD - กราฟรายวัน
The BTC/USD daily chart reveals that the crypto market is lowering, conjecturing a low around the point of $60,000.

The Bollinger Band trend lines are positioned at higher trade zones, with their lower part being relatively stretched by the reactions of sellers. Variant low-falling forces have been made on the feature of candlesticks to denote that some falls are in place. The stochastic oscillators are in the oversold region, denoting that a consolidation movement is tentatively going on.
ราคา Bitcoin (BTC/USD) กำลังลดลง กำลังคาดเดาฐาน

As there has been a correction in the price of Bitcoin over USD, should sellers freely execute shorting orders at $60,000?

It might not be too safe for sellers to continue to execute selling position orders below the point of $60,000, as the ตลาด BTC / USD is lowering, conjecturing a base even around the point mentioned.

Upon noticing a tiny upward spike signal, long-position movers with substantial equity may start to introduce a portion of their money to the smallest lot size. In order to run long-term, they will need to abandon their position and pay attention to the stochastic oscillators heading upward.

In the event that short-position movers in the Bitcoin/USD market manage to regain decent entry, the middle Bollinger Band trend line will be a more useful tool, particularly around the $70,000 resistance level. To provide a clear indication of a shorting order, there must be some pulls toward or toward the value line, together with rejection signals at the top end of the candlestick’s development.
ราคา Bitcoin (BTC/USD) กำลังลดลง กำลังคาดเดาฐาน
แผนภูมิ BTC / USD 4 ชั่วโมง
พื้นที่ BTC / USD 4-hour chart shows that the crypto market is lowering and conjecturing a base reformation around $60,000.

The Bollinger Band trend lines have managed to briefly bend southbound to connote that boundaries of getting back rebounds are being formed. In order to acquire a curved shape on the south side beyond the line of 80, the stochastic oscillators have veered upward. Psychologically, it would be acceptable to wait for index bounces before placing a buy order.


หมายเหตุ Cryptosignals.org ไม่ใช่ที่ปรึกษาทางการเงิน ทำการวิจัยของคุณก่อนที่จะลงทุนเงินของคุณในสินทรัพย์ทางการเงินหรือผลิตภัณฑ์หรือเหตุการณ์ที่นำเสนอ เราไม่รับผิดชอบต่อผลการลงทุนของคุณ


คุณสามารถซื้อ Lucky Block ได้ที่นี่ ซื้อ LBLOCK

Super Trump (STRUMP/USD) Gathers Momentum: Bullish Sentiment Emerges at $0.0023

Based on the chart utilized for this analysis, it appears that the Super Trump market experienced a market peak in early April. Subsequently, significant selling pressure emerged, initiating a downward trend following an initial peak at $0.0068. The sustained selling pressure rendered the support level at approximately $0.003 insufficient to reverse the market trajectory. Such formidable selling activity necessitated a reconsolidation of bullish forces around $0.0023. Currently, there are indications of a market reversal towards the upside from this point onward.

Super Trump Market Data

  • STRUMP/USD Price Now: $0.0032
  • STRUMP/USD Market Cap: $5.4 million
  • STRUMP/USD Circulating Supply: 1.79 billion
  • STRUMP/USD Total Supply: 2.34 billion
  • STRUMP/USD CoinMarketCap Ranking: #1245

Super Trump (STRUMP/USD) Gathers Momentum: Bullish Sentiment Emerges at $0.0023

ระดับคีย์

  • ความต้านทาน: 0.0035 ดอลลาร์ 0.0040 ดอลลาร์และ 0.0045 ดอลลาร์
  • สนับสนุน: 0.0023 ดอลลาร์ 0.0020 ดอลลาร์และ 0.0018 ดอลลาร์

 Super Trump Through the Lens of Indicators

Initially, on April 12, the Super Trump market tested the $0.002 price level. Subsequently, on April 14, bullish activity around the $0.0025 price level once again redirected the price trajectory. However, bears reemerged at the $0.005 price level, instigating a renewed bearish trend. Nevertheless, bulls demonstrated resilience yet again, reversing the market’s direction at $0.0023.

Observations of the Bollinger Bands indicate a market within a wide range, suggesting a state of ranging. To establish a clear trend, a breakout is expected either above $0.005 or below $0.0020. The current market volatility is underscored by the Relative Strength Index, which reflects significant fluctuations. Notably, there is a gradual buildup of bullish momentum.

Super Trump (STRUMP/USD) Gathers Momentum: Bullish Sentiment Emerges at $0.0023

STRUMP Price Prediction: 4-Hour Chart Analysis 

Examining the market through a finer lens reveals a systematic progression by the bulls; the สัญญาณเข้ารหัส evidently portrays the establishment of marginally higher lows. Their momentum is further underscored by their successful breach above the $0.0030 price threshold, potentially transforming prior resistance into support. Consequently, the prevailing trend indicates a retreat by the bears in response to the mounting bullish momentum.

แลกเปลี่ยนเหรียญ crypto บน BYBIT!

ผู้ซื้อ APEUSD วางแผนที่จะฟื้นความแข็งแกร่งท่ามกลางสภาวะตลาดที่เข้มงวด

Market Analysis – The Bears Look Forward to More Flow

APEUSD buyers plan to recover strength amidst rigid market conditions. The APEUSD market has been experiencing a bearish trend. However, recent developments suggest that buyers are planning to regain their strength and push back against the downward pressure. 

ระดับสำคัญของ APEUSD

ระดับความต้านทาน: 2.7100 เหรียญ, 2.4900 เหรียญ 
Support Levels: $2.3100, $.15700

ผู้ซื้อ APEUSD วางแผนที่จะฟื้นความแข็งแกร่งท่ามกลางสภาวะตลาดที่เข้มงวด

The bearish market flow in the APEUSD market has been evident in recent times. At the beginning of the month, sellers had an easy drop below the significant level of $1.860. This downward momentum continued as sellers managed to push the price down to the $1.5700 level. However, the buyers at this level attempted to initiate a recovery, but their efforts were not sufficient. It is possible that the lack of interest from investors hindered their progress.
 
Following the consolidation above the $1.5700 market zone, sellers gained the upper hand once again. The price dropped significantly, reaching as low as the $0.9900 market zone. This dominance by sellers indicates strong bearish sentiment in the APEUSD market. However, it is important to note that the buyers have recently started to make a resupply in an attempt to fight back.
 
The price oscillator is currently declining, indicating a downward trend in the market. This suggests that sellers are still determined to continue their strike. Additionally, the momentum indicator is dropping, further reinforcing the notion that sellers are fighting back.

ผู้ซื้อ APEUSD วางแผนที่จะฟื้นความแข็งแกร่งท่ามกลางสภาวะตลาดที่เข้มงวด

ความคาดหวังของตลาด 

The battle between buyers and sellers in the APEUSD market is currently centered around the significant level of $1.2000. This level holds great importance as it represents a potential turning point for the market. If the buyers manage to overcome the selling pressure and push the price above this level, it could signify a shift in market sentiment and a potential reversal of the bearish trend.

Despite the efforts of buyers and sellers, the APEUSD market remains rigid. Traders should anticipate more price flow as the battle between buyers and sellers continues.

คุณสามารถซื้อ Lucky Block ได้ที่นี่ ซื้อ LBLOCK

หมายเหตุCryptosignals.org ไม่ใช่ที่ปรึกษาทางการเงิน ทำวิจัยของคุณก่อนลงทุนเงินของคุณในสินทรัพย์ทางการเงินหรือผลิตภัณฑ์หรืองานนำเสนอ เราจะไม่รับผิดชอบต่อผลการลงทุนของคุณ

Decentraland (MANAUSD) ส่งสัญญาณการฝ่าวงล้อมหยาบคาย

การวิเคราะห์ตลาด: การฝ่าวงล้อมหยาบคายจากแนวโน้มการรวมตัว

ในการเคลื่อนไหวของราคาเมื่อเร็วๆ นี้ MANAUSD มีลักษณะเฉพาะคือการบรรจบกันของจุดสูงสุดที่ต่ำกว่าและจุดต่ำสุดที่สูงขึ้น ซึ่งสะท้อนถึงราคาในช่วงเวลาของการแข็งตัว การควบรวมกิจการส่งผลให้เกิดรูปแบบสามเหลี่ยมสมมาตรกับตลาด แตกออก เพื่อบ่งบอกถึงอคติขาลง

ระดับสำคัญของ MANAUSD

ระดับความต้องการ: $0.4480, $0.3200
ระดับการจัดหา: $0.7030, $0.8130

Decentraland (MANAUSD) ส่งสัญญาณการฝ่าวงล้อมหยาบคาย

MANAUSD แตะระดับสูงสุดใหม่ในช่วงกลางเดือนมีนาคม 2024 ซึ่งสูงกว่าระดับอุปทานที่ 0.7030 ดอลลาร์ ซึ่งบ่งบอกถึงแนวโน้มขาขึ้นในช่วงแรก อย่างไรก็ตาม ราคาสร้างรูปแบบสามเหลี่ยมสมมาตร ซึ่งบ่งชี้ถึงความผันผวนของภาวะกระทิงที่ลดลง ต่อมาราคาทะลุต่ำกว่าสามเหลี่ยม ซึ่งเป็นสัญญาณการกลับตัวของภาวะหมีในการเคลื่อนไหวของราคาในปัจจุบัน

การฝ่าวงล้อมขาลงส่งผลให้มีการลดลงอย่างมีนัยสำคัญหลังจากทะลุระดับอุปสงค์ที่ 0.4480 ดอลลาร์ ทำให้สภาพคล่องด้านล่างหายไป และไม่มีที่ว่างสำหรับการกลับตัวที่อาจเกิดขึ้น ราคาที่ลดลงอย่างรวดเร็วทำให้เกิด Fair Value Gap (FVG) ในกรอบเวลา 4 ชั่วโมง ดัชนี Relative Strength Index รายวันแสดงให้เห็นว่าราคาอยู่ต่ำกว่าภูมิภาคที่มีการซื้อมากเกินไปที่ 30.0 ซึ่งบ่งชี้ถึงความเป็นไปได้ที่จะเกิดการถอยกลับที่คาดว่าจะเติมเต็มช่องว่างมูลค่ายุติธรรมที่เปิดอยู่

Decentraland (MANAUSD) ส่งสัญญาณการฝ่าวงล้อมหยาบคาย

ความคาดหวังของตลาด

โมเมนตัมขาลงคาดว่าจะดำเนินต่อไปหลังจากการย้อนกลับของราคาไปยัง Fair Value Gap โดยตลาดคาดว่าจะลดลงอีกต่ำกว่า 0.3200 ดอลลาร์

คุณสามารถซื้อ Lucky Block ได้ที่นี่ ซื้อ LBLOCK

หมายเหตุ Cryptosignals.org ไม่ใช่ที่ปรึกษาทางการเงิน ทำวิจัยของคุณก่อนลงทุนเงินของคุณในสินทรัพย์ทางการเงินหรือผลิตภัณฑ์หรืองานนำเสนอ เราจะไม่รับผิดชอบต่อผลการลงทุนของคุณ