Bitcoin Halving: JPMorgan Analysts Expect BTC to Drop

In a recent report, JPMorgan analysts shed light on the anticipated impact of the upcoming Bitcoin halving event. As the crypto community eagerly awaits this significant milestone, the question on everyone’s mind is: How will it affect the world’s most popular cryptocurrency?

Bitcoin halving, which occurs approximately every four years, is a crucial event in the cryptocurrency ecosystem. During this event, the issuance rewards for Bitcoin miners are cut in half.

Miners currently receive 6.25 BTC per block; after the halving, this reward will decrease to 3.125 BTC per block.

ווי געמאלדן דורך בלומבערג, JPMorgan’s analysts assert that the current bitcoin price already has the upcoming halving priced in. In their report, they state, “We do not expect bitcoin price increases post-halving as it has already been priced in.” This perspective challenges the notion that halvings inevitably lead to price surges.

JPMorgan’s Reasons for Cautious Expectations Around the Bitcoin Halving

According to JPMorgan analysts, the factors contributing to the cautious outlook on the upcoming ביטקאָין כאַווינג אַרייַננעמען:

  • Overbought Condition Worries: Despite recent declines, JPM fears that ביטקאָין remains in “overbought conditions.” This assessment is based on an analysis of open interest in bitcoin futures.
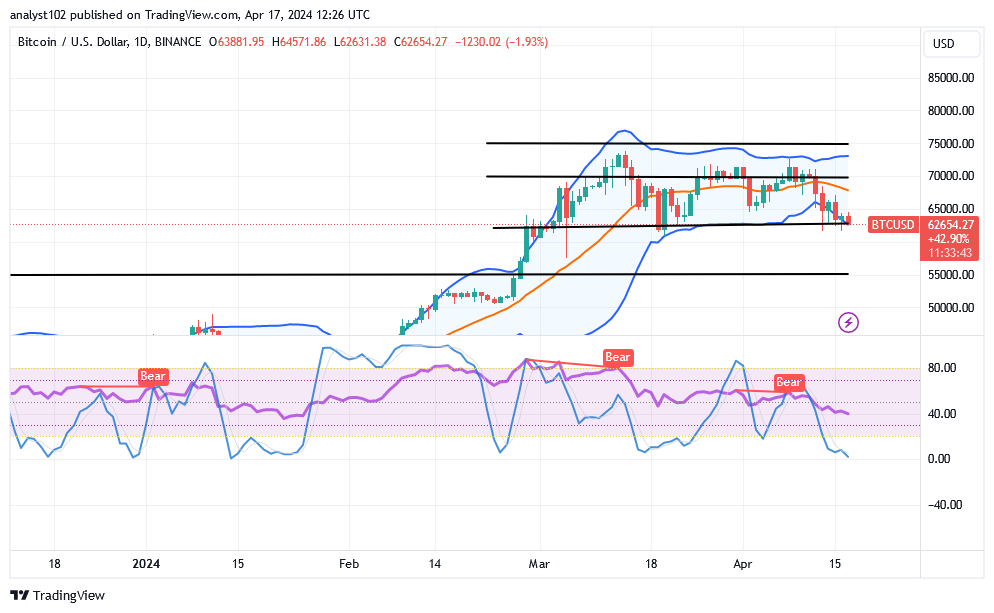
  • Volatility-Adjusted Price: JPMorgan’s volatility-adjusted price for bitcoin stands at $45,000. Comparing this to the current market price of $63,500 reveals that bitcoin is trading at a premium, according to the analysts.
  • פּראָדוקציע קאָסטן: The analysts highlight that Bitcoin’s price exceeds its projected production cost post-halving. With a projected cost of $42,000, the current price of around $63,500 raises concerns.
  • ווענטורע קאַפּיטאַל פאַנדינג: Despite the broader resurgence in the crypto market, venture capital funding for cryptocurrencies has been tepid this year. This lack of substantial investment could dampen price growth, per the report.

Bitcoin Hashrate and Miner Consolidation

Furthermore, the halving is expected to impact Bitcoin miners significantly. As the issuance rewards decrease, some miners may find their operations unprofitable. Consequently, we can expect a significant drop in hashrate—the computing power dedicated to securing the network.

However, JPMorgan believes that publicly listed mining companies are likely to weather the storm better than smaller players. Likewise, consolidation among miners is expected, with larger firms dominating the landscape.

In response to reduced profitability, mining firms may explore diversification. Regions with lower energy costs, such as Latin America or Africa, could become attractive destinations. Repurposing inefficient mining rigs for salvage value might also be on the agenda for struggling miners.

While some speculate that miners could switch to mining Bitcoin hard fork cryptocurrencies, JPMorgan’s analysts dismiss this as “highly unlikely.” These specialized rigs are optimized for Bitcoin mining, and venturing into smaller-cap altcoins would likely yield little profit.

In summary, the Bitcoin halving is set to bring both challenges and opportunities. As the crypto community watches closely, the market’s response will ultimately determine the fate of digital gold.

ווען טריידינג די קריפּטאָ מאַרק, עס טוט נישט האָבן צו זיין "שלאָגן אָדער פאַרפירן." באַוואָרענען דיין פּאָרטפעל מיט טריידז וואָס אַקשלי געבן רעזולטאַטן, פּונקט ווי אונדזער פּרעמיע קריפּטאָ סיגנאַלז אויף טעלעגראַם.


אינטערעסירט אין לערנען ווי צו טאָג האַנדל קריפּטאָ? באַקומען אַלע די אינפֿאָרמאַציע איר דאַרפֿן דאָ

Will Quant (QNT) Maintain Its Bull Run After a Low of $85?

Quant (QNT) has rebounded impressively from its recent low of $85 just five days ago, currently trading at $108. The token has a market cap of $1,289,345,778 USD and a 24-hour trading volume of $18,415,618 USD.

Quant is up 4.58% in the last 24 hours and holds a CoinMarketCap ranking of #68. Strong demand and positive sentiment surround the project, fueled by its focus on blockchain interoperability and strategic פּאַרטנערשיפּס.

Whether QNT can sustain its bull run depends on broader market trends and future developments, including regulatory clarity and advancements in the Quant Network.

QNT/USD לאנג-טערמין גאַנג: בולליש (טעגלעך טשאַרט)
שליסל לעוועלס:
קעגנשטעל לעוועלס: $ 110, $ 112, $ 114
שטיצן לעוועלס: $ 105, $ 103, $ 100
Will Quant (QNT) Maintain Its Bull Run After a Low of $85?
קוואַנט (QNT) has exhibited a strong rebound in the daily market, rising from a low of $85 to $108. This price movement is backed by the daily Relative Strength Index (RSI) reading of 43.23.

An RSI of 43.23 suggests the market is in a neutral zone, indicating potential for further movement to a bullish region. While the RSI is close to the oversold threshold, it provides space for future price growth without reaching the overbought range.

This technical indicator highlights a balanced market environment, where QNT can continue its upward trend. Overall, Quant’s market activity reflects sustained positive sentiment and potential for ongoing growth.

QNTUSD Medium-term Trend: Bullish (4H chart)
Quant (QNT) has displayed notable upward momentum in the 4-hour market. The 4-hour Relative Strength Index (RSI) stands at 57.95, pointing to a market with moderate bullishness.This RSI value signals potential for additional price gains while remaining safely below the overbought threshold.
Will Quant (QNT) Maintain Its Bull Run After a Low of $85?
The market’s intermediate-term outlook is optimistic, with Quant’s steady rise suggesting strong demand and positive expectations for future growth. The 4-hour chart provides a snapshot of sustained bullish sentiment, paving the way for further upward movement in the near term.

Quant (QNT) Positioned for Continued Bullish Trajectory
The token’s rapid recovery from a low of $85 to $108, coupled with a market cap exceeding $1.28 billion and a strong 24-hour trading volume, underscores robust interest and optimism surrounding the project.The daily Relative Strength Index (RSI) of 43.23 suggests a neutral stance in the market, indicating potential for continued price appreciation.

Meanwhile, the 4-hour RSI of 57.95 reveals moderate bullish momentum, pointing to further gains.Quant’s emphasis on בלאָקקטשאַין interoperability and strategic alliances is fostering a wave of enthusiasm around its future prospects.

This, combined with a balanced market and consistent demand, indicates QNT is on track for sustained upward movement in the coming days.

אָרט ווינינג קוואַנט טריידז מיט אונדז. באַקומען QNT דאָ.

Tamadoge (TAMA/USD) Recovers From Below the $0.005 Price Level

The Tamadoge market exhibited heightened volatility subsequent to a decline below the $0.00005 price threshold, following a protracted struggle for market dominance between bullish and bearish forces. This escalation in volatility can be attributed to the significance of the $0.00005 level as a key support zone; its breach elicited a pronounced bearish sentiment among traders. As a result, bulls were compelled to regroup around the $0.000045 mark. Leveraging the increased volatility, they have since managed to muster significant momentum, steering the market towards a resurgence in bullish sentiment.

שליסל לעוועלס

  • קעגנשטעל: $0.013, $0.014 און $0.015.
  • שטיצן: $0.0045, $0.0040 און $0.0035.

Tamadoge (TAMA/USD) Recovers From Below the $0.005 Price Level

TAMA / USD פּרייַז אַנאַליסיס: די פונט פון מיינונג פון די ינדיקאַטאָרס

Bulls have begun to converge at the $0.000045 price level, marking a pivotal juncture from which they are initiating a reversal of the market’s trajectory towards the upside. However, this bullish momentum faces considerable resistance. In the preceding 4-hour trading session, the קריפּטאָ סיגנאַl featured a candlestick with a small body and long upper and lower shadows, indicating a balance between demand and supply. Currently, the bullish recovery appears capped around $0.000047, while the Bollinger Bands continue to delineate a downward-trending price channel. The initial step towards reorienting the טאַמאַדאָגע market in an upward direction may entail a consolidation phase. Subsequently, as bearish sentiment dissipates at this level, a price ascent is anticipated.

Tamadoge (TAMA/USD) Recovers From Below the $0.005 Price Level

טאַמאַדאָגע קורץ-טערמין אַוטלוק: 1-שעה טשאַרט

The market’s 1-hour timeframe also indicates a ranging trend. Upon reaching the $0.000045 price level during the bearish phase, the market exhibited a period of stagnation, attributed to significant bullish activity at this level. Shortly thereafter, a bullish reversal was observed, driving the market upward. Nevertheless, bearish resistance has emerged at $0.000047. Presently, bullish pressure is evident at this resistance level, with the price action maintaining a position above the 20-day moving average.

Get your fair share of $TAMA in this play-to-earn runner game with lively graphics, humorous characters, and quick gameplay.

צי איר ווילן אַ מאַטבייע וואָס וועט זיין 100 מאל מער ווערטפול אין די קומענדיק ביסל חדשים? דאָס איז Tamadoge. קויפן TAMA הייַנט!

Uniswap (UNI/USD) Trade Is Building Footsteps, Hovering at $7

פּרידיקשאַן פון וניסוואַפּ - 18 אפריל

Quite some momentum has been allowed to go in the way of declines while bulls and bears have been struggling against others around indicators’ imaginary spots of trending, given that the UNI/USD מאַרק is presently building footsteps, hovering around the value line of $7.

Over a couple of days back, forces to the south direction around the lower Bollinger Band trend line have been made to be losing capacities gradually in a line of trying to produce a probable long range of low price actions that are majorly expected to give in back to smooth paths toward securing stable increases thereof.

וני / וסד מאַרקעט
שליסל לעוועלס:
קעגנשטעל לעוועלס: $ 9, $ 11, $ 13
שטיצן לעוועלס: $ 6, $ 5, $ 4

UNI / USD - טעגלעך טשאַרט
The UNI/USD daily chart reveals the crypto-economic market is building footsteps around the line of $7, as the price is hovering around the line.

The stochastic oscillators have been observed, over some sessions to have been swinging around some points not too far above the oversold region. And they do dip mostly in the area many times to signify that forces to the reduction direction are getting weaker.
Uniswap (UNI/USD) Trade Is Building Footsteps, Hovering at $7

Can there be additional avenues for the downside given that the BTC/USD market is currently trading near $7?

It would be out of technical principle method of trading for sellers to go further to the downside, given that the UNI / USD מאַרקt is currently building footsteps, hovering around the point of $7.

Some indicators are at considerably to the downside to touch maximal decrease spots that are psychologically ideal for buyers to get reshape toward getting decent entries to make comebacks. Looking at the effect of he corrections, the market has been made to put in back for another round of moving into rising direction.

Right now, bears need to exercise caution while positioning themselves in relation to the lower Bollinger Band trend line. One of he reasons backing that logical thoughts is that an oversold reading condition has depicted by the stochastic oscillators to imply that it would be riskier for sellers to run safely on a profiteering manner even if there will be a line of delays in he price actions.
Uniswap (UNI/USD) Trade Is Building Footsteps, Hovering at $7
UNI / BTC פּרייס אַנאַליסיס
אין קאַנטראַסט, די יוניסוואַפּ האַנדל is currently building footsteps against the valuation of Botcoin, hovering around the lower Bollinger Band.

The stochastic oscillators have been seen swinging around the oversold region with less out of the spots to the upside. . The lower moving component of the Bollinger Band trend lines has been in a losing condition, indicating that there is pressure on the base crypto economy to decrease. Nevertheless, it doesn’t appear that the trends are becoming more severe in order to decline freely.
\
נאטיץ: Cryptosignals.org איז נישט אַ פינאַנציעל אַדווייזער. טאָן דיין פאָרשונג איידער ינוועסטינג דיין געלט אין קיין פינאַנציעל אַסעט אָדער דערלאנגט פּראָדוקט אָדער געשעעניש. מיר זענען נישט פאַראַנטוואָרטלעך פֿאַר דיין ינוועסטינג רעזולטאַטן.


איר קענען קויפן Lucky Block דאָ. קויפן LBLOCK

$SPONGE (SPONGE/USD) Shows Signs of Strength, Upward Trend Possible

Over the preceding two days, our observations revealed prolonged stability in the שוואָם / וסד market, characterized by a consistent presence around the $0.000045 price level. During this period, price action remained stagnant, resulting in a flat trajectory. The equilibrium persisted due to an apparent deadlock between supply and demand, rendering both bulls and bears incapable of exerting significant influence. Notably, the market maintained a static state at the $0.000045 price level.

However, according to today’s קריפּטאָ סיגנאַל, we noted sudden market developments indicating a potential shift in sentiment, hinting at the possibility of an impending upswing.

שליסל מאַרק דינאַמיק:

  • קעגנשטעל לעוועלס$0.0010, $0.0011 און $0.0012.
  • שטיצן לעוועלס: 0.000035 0.000030, 0.000025 XNUMX, און XNUMX XNUMX $.

$SPONGE (SPONGE/USD) Shows Signs of Strength, Upward Trend Possible

דעלווינג אין טעכניש אַנאַליסיס פֿאַר $ שוואָם (שוואָם / וסד):

While the market gridlock persisted, a significant breakout occurred in the bear market during the initial trading session of the day, driving prices down to the $0.000023 level. Subsequently, the following trading session witnessed a surge in bullish sentiment, leading traders to capitalize on the dip and elevating the market back to the $0.000045 level. This rapid and volatile price swing repeated itself in the third trading session.

The resilience displayed by the bulls in swiftly recovering from the test of lower price levels underscores their strength within this price range. As the bull market gathers momentum, it is conceivable that subsequent tests of lower levels may result in the establishment of higher lows. Such occurrences could potentially catalyze a bullish breakout above the $0.000045 level, signaling the emergence of a bullish trend.

$SPONGE (SPONGE/USD) Shows Signs of Strength, Upward Trend Possible

ינסייץ פון די 1-שעה פּערספּעקטיוו:

Higher lows have begun to emerge on the SPONGE/USD market chart, as observed from the 1-hour chart perspective. This development signifies a positive trend for bullish traders, indicating a gradual accumulation of bullish momentum. However, a slight adjustment in the resistance level, shifting from $0.000045 to approximately $0.000044, suggests a temporary claim by bears for this resistance threshold. Yet, given the persistent strength exhibited by the bulls, there is potential for this price level to eventually yield.

Wonderful news! Over 9.8 million $SPONGE coins have been staked as of right now!

ינוועסטירן אין די האָטטעסט און בעסטער מעמע מאַטבייע. קויפן שוואָם ($ שוואָם) הייַנט!

ביטקאָין (בטק / וסד) פּרייַז איז לאָוערינג, קאַנדזשעקטוערינג אַ באַזע

פּראָגנאָז פון ביטקאָין פּרייס - 17 אפריל

עס איז באטייטיק דעמאַנסטרייטיד אַז דער פּראָצעס וואָס קען לאָזן בולז ריגיין זייער שטעלעס אין די בטק / וסד האַנדל קעגן בערז האט נישט געווינען אַ געזונט וואָג, ווייַל די קריפּטאָ געשעפט איז דערווייַל לאָוערינג און קאַנדזשעקטוערינג אַ באַזע ריקאַנסטראַקשאַן מאַך אַרום די פונט פון $ 60,000.

אויב די קערעקשאַן מווומאַנץ וואָס האָבן גענומען צענטער בינע אין די וועקסל שורות פאָרזעצן, עס וואָלט זיין אַ שאַקינג מאַך וואָס יווענטשאַוואַלי וועט זען די פּרייַז פון די קריפּטאָקוררענסי פאַלן פיל נידעריקער, צו אַ שטיצן מדרגה פון $ 50,000. אָבער, ווייַל דער ציקל פון ריבאַונדינג האט גאַרנערד אַ פּלאַץ פון ופמערקזאַמקייט דעם חודש, דער סצענאַר קען נישט פאָרשלאָגן אַ העכסט טעכניש אָרדענונג סעטאַפּ צו דערגרייכן ויסגעצייכנט שאָרטינג פּאָזיציע.

בטק / וסד מאַרקעט
שליסל לעוועלס:
קעגנשטעל לעוועלס: $ 70,000, $ 75,000, $ 80,000
שטיצן לעוועלס: $ 55,000, $ 52,500, $ 50,000

בטק / וסד - טעגלעך טשאַרט
די BTC / USD טעגלעך טשאַרט ריווילז אַז די קריפּטאָ מאַרק איז לאָוערינג, קאַנדזשעקטינג אַ נידעריק אַרום די פונט פון $ 60,000.

די Bollinger Band גאַנג שורות זענען פּאַזישאַנד אין העכער האַנדל זאָנעס, מיט זייער נידעריקער טייל איז לעפיערעך אויסגעשטרעקט דורך די ריאַקשאַנז פון סעלערז. וואַריאַנט נידעריק-פאַלינג פאָרסעס האָבן שוין געמאכט אויף די שטריך פון מנורות צו אָנווייַזן אַז עטלעכע פאלס זענען אין פּלאַץ. די סטאָטשאַסטיק אַסאַלייטערז זענען אין די אָוווערסאָלד געגנט, דינאָוטינג אַז אַ קאַנסאַלאַדיישאַן באַוועגונג איז טענטאַטיוולי געגאנגען אויף.
ביטקאָין (בטק / וסד) פּרייַז איז לאָוערינג, קאַנדזשעקטוערינג אַ באַזע

ווי עס איז געווען אַ קערעקשאַן אין די פּרייַז פון ביטקאָין איבער וסד, זאָל סעלערז פרילי ויספירן שאָרטינג אָרדערס ביי $ 60,000?

עס קען נישט זיין צו זיכער פֿאַר סעלערז צו פאָרזעצן צו ויספירן סעלינג שטעלע אָרדערס אונטער די פונט פון $ 60,000, ווי די בטק / וסד מאַרק איז לאָוערינג, קאַנדזשעקטינג אַ באַזע אפילו אַרום די פונט דערמאנט.

ווען איר באמערקט אַ קליינטשיק אַרוף ספּייק סיגנאַל, לאַנג-פּאָזיציע מאָווערס מיט היפּש יוישער קען אָנהייבן צו באַקענען אַ טייל פון זייער געלט צו דער קלענסטער פּלאַץ גרייס. אין סדר צו לויפן לאַנג-טערמין, זיי וועלן דאַרפֿן צו פאַרלאָזן זייער שטעלע און באַצאָלן ופמערקזאַמקייט צו די סטאָטשאַסטיק אַסאַלייטערז כעדינג אַרוף.

אין דער געשעעניש אַז מאָווערס פון קורץ-שטעלע אין די ביטקאָין / וסד מאַרק פירן צו ריגיין לייַטיש פּאָזיציע, די מיטל גאַנג שורה פון Bollinger Band וועט זיין אַ מער נוציק געצייַג, ספּעציעל אַרום די קעגנשטעל מדרגה פון $ 70,000. צו צושטעלן אַ קלאָר אָנווייַז פון אַ שאָרטינג סדר, עס מוזן זיין עטלעכע פּולז צו אָדער צו די ווערט שורה, צוזאַמען מיט רידזשעקשאַן סיגנאַלז אין די שפּיץ סוף פון די אַנטוויקלונג פון די לייַכטער.
ביטקאָין (בטק / וסד) פּרייַז איז לאָוערינג, קאַנדזשעקטוערינג אַ באַזע
בטק / וסד 4-שעה טשאַרט
די בטק / וסד 4-שעה טשאַרט ווייזט אַז די קריפּטאָ מאַרק איז לאָוערינג און קאַנדזשעקטינג אַ באַזע רעפאָרמאַטיאָן אַרום $ 60,000.

די גאַנג שורות פון Bollinger Band האָבן געראטן צו בעקיצער בייגן סאַוטבאַונד צו אָנווייַזן אַז די באַונדריז פון באַקומען צוריק ריבאַונדז זענען געשאפן. אין סדר צו קריגן אַ קערווד פאָרעם אויף די דרום זייַט ווייַטער פון די שורה פון 80, די סטאָטשאַסטיק אַסאַלייטערז האָבן וועערד אַרוף. פּסיטשאָלאָגיקאַללי, עס וואָלט זיין פּאַסיק צו וואַרטן פֿאַר אינדעקס באַונסיז איידער איר שטעלן אַ קויפן סדר.


נאטיץ: Cryptosignals.org איז נישט אַ פינאַנציעל אַדווייזער. טאָן דיין פאָרשונג איידער ינוועסטינג דיין געלט אין קיין פינאַנציעל אַסעט אָדער דערלאנגט פּראָדוקט אָדער געשעעניש. מיר זענען נישט פאַראַנטוואָרטלעך פֿאַר דיין ינוועסטינג רעזולטאַטן.


איר קענען קויפן Lucky Block דאָ. קויפן LBLOCK

Super Trump (STRUMP/USD) Gathers Momentum: Bullish Sentiment Emerges at $0.0023

Based on the chart utilized for this analysis, it appears that the Super Trump market experienced a market peak in early April. Subsequently, significant selling pressure emerged, initiating a downward trend following an initial peak at $0.0068. The sustained selling pressure rendered the support level at approximately $0.003 insufficient to reverse the market trajectory. Such formidable selling activity necessitated a reconsolidation of bullish forces around $0.0023. Currently, there are indications of a market reversal towards the upside from this point onward.

Super Trump Market Data

  • STRUMP/USD Price Now: $0.0032
  • STRUMP/USD Market Cap: $5.4 million
  • STRUMP/USD Circulating Supply: 1.79 billion
  • STRUMP/USD Total Supply: 2.34 billion
  • STRUMP/USD CoinMarketCap Ranking: #1245

Super Trump (STRUMP/USD) Gathers Momentum: Bullish Sentiment Emerges at $0.0023

שליסל לעוועלס

  • קעגנשטעל: 0.0035 0.0040, 0.0045 XNUMX, און XNUMX XNUMX $.
  • שטיצן: 0.0023 0.0020, 0.0018 XNUMX, און XNUMX XNUMX $.

 Super Trump Through the Lens of Indicators

Initially, on April 12, the Super Trump market tested the $0.002 price level. Subsequently, on April 14, bullish activity around the $0.0025 price level once again redirected the price trajectory. However, bears reemerged at the $0.005 price level, instigating a renewed bearish trend. Nevertheless, bulls demonstrated resilience yet again, reversing the market’s direction at $0.0023.

Observations of the Bollinger Bands indicate a market within a wide range, suggesting a state of ranging. To establish a clear trend, a breakout is expected either above $0.005 or below $0.0020. The current market volatility is underscored by the Relative Strength Index, which reflects significant fluctuations. Notably, there is a gradual buildup of bullish momentum.

Super Trump (STRUMP/USD) Gathers Momentum: Bullish Sentiment Emerges at $0.0023

STRUMP Price Prediction: 4-Hour Chart Analysis 

Examining the market through a finer lens reveals a systematic progression by the bulls; the קריפּטאָ סיגנאַל evidently portrays the establishment of marginally higher lows. Their momentum is further underscored by their successful breach above the $0.0030 price threshold, potentially transforming prior resistance into support. Consequently, the prevailing trend indicates a retreat by the bears in response to the mounting bullish momentum.

האַנדל קריפּטאָ קאָינס אויף BYBIT!

APEUSD בויערס פּלאַן צו צוריקקריגן שטאַרקייַט צווישן שטרענג מאַרק טנאָים

Market Analysis – The Bears Look Forward to More Flow

APEUSD buyers plan to recover strength amidst rigid market conditions. The APEUSD market has been experiencing a bearish trend. However, recent developments suggest that buyers are planning to regain their strength and push back against the downward pressure. 

APEUSD שליסל לעוועלס

קעגנשטעל לעוועלס: $ 2.7100, $ 2.4900 
Support Levels: $2.3100, $.15700

APEUSD בויערס פּלאַן צו צוריקקריגן שטאַרקייַט צווישן שטרענג מאַרק טנאָים

The bearish market flow in the APEUSD market has been evident in recent times. At the beginning of the month, sellers had an easy drop below the significant level of $1.860. This downward momentum continued as sellers managed to push the price down to the $1.5700 level. However, the buyers at this level attempted to initiate a recovery, but their efforts were not sufficient. It is possible that the lack of interest from investors hindered their progress.
 
Following the consolidation above the $1.5700 market zone, sellers gained the upper hand once again. The price dropped significantly, reaching as low as the $0.9900 market zone. This dominance by sellers indicates strong bearish sentiment in the APEUSD market. However, it is important to note that the buyers have recently started to make a resupply in an attempt to fight back.
 
The price oscillator is currently declining, indicating a downward trend in the market. This suggests that sellers are still determined to continue their strike. Additionally, the momentum indicator is dropping, further reinforcing the notion that sellers are fighting back.

APEUSD בויערס פּלאַן צו צוריקקריגן שטאַרקייַט צווישן שטרענג מאַרק טנאָים

מאַרק עקספּעקטאַטיאָן 

The battle between buyers and sellers in the APEUSD market is currently centered around the significant level of $1.2000. This level holds great importance as it represents a potential turning point for the market. If the buyers manage to overcome the selling pressure and push the price above this level, it could signify a shift in market sentiment and a potential reversal of the bearish trend.

Despite the efforts of buyers and sellers, the APEUSD market remains rigid. Traders should anticipate more price flow as the battle between buyers and sellers continues.

איר קענען קויפן Lucky Block דאָ. קויפן LBLOCK

טאָןcryptosignals.org איז ניט אַ פינאַנציעל אַדווייזער. טאָן דיין פאָרשונג איידער איר ינוועסטירן דיין געלט אין קיין פינאַנציעל אַסעט אָדער דערלאנגט פּראָדוקט אָדער געשעעניש. מיר זענען נישט פאַראַנטוואָרטלעך פֿאַר דיין ינוועסטינג רעזולטאַטן.

Decentraland (MANAUSD) סיגנאַלז אַ בעריש ברייקאַוט

Market Analysis: Bearish Breakout From a Consolidating Trend

In recent price action, MANAUSD is characterized by the converging of lower highs and higher lows, which reflects price in a period of consolidation. The consolidation resulted in the formation of a symmetrical triangle pattern, with the market ברייקינג אויס to indicate a bearish bias.

MANAUSD שליסל לעוועלס

פאָדערונג לעוועלס: $ 0.4480, $ 0.3200
צושטעלן לעוועלס: $ 0.7030, $ 0.8130

Decentraland (MANAUSD) סיגנאַלז אַ בעריש ברייקאַוט

MANAUSD reached a new major high in mid-March 2024, surpassing the $0.7030 supply level, suggesting an initial bullish trend. However, the price formed a symmetrical triangle pattern, indicating a decrease in bullish volatility. The price subsequently broke below the triangle, signaling a bearish reversal in the current price action.

The bearish breakout resulted in a significant decline after breaking through the $0.4480 demand level, clearing the liquidity below and leaving no room for any potential retracement. The sharp drop in price led to the formation of a Fair Value Gap (FVG) in the 4-hour timeframe. The daily Relative Strength Index shows that the price is well below the 30.0 overbought region, indicating a potential for a pullback that is expected to fill the open Fair Value Gap.

Decentraland (MANAUSD) סיגנאַלז אַ בעריש ברייקאַוט

מאַרק עקספּעקטאַטיאָן

Bearish momentum is expected to continue after a price retracement to the Fair Value Gap, with the market anticipated to drop further below $0.3200.

איר קענען קויפן Lucky Block דאָ. קויפן LBLOCK

נאטיץ: cryptosignals.org איז ניט אַ פינאַנציעל אַדווייזער. טאָן דיין פאָרשונג איידער איר ינוועסטירן דיין געלט אין קיין פינאַנציעל אַסעט אָדער דערלאנגט פּראָדוקט אָדער געשעעניש. מיר זענען נישט פאַראַנטוואָרטלעך פֿאַר דיין ינוועסטינג רעזולטאַטן.