Market Analysis – Compound Remain in Consolidation Fold
COMPOUND sellers hint at a sell breakout. Compound has been experiencing a קאַנסאַלאַדיישאַן פאַסע in the crypto market, with the price struggling to gain momentum between the key levels of $76.820 and $68.250. This consolidation phase indicates a period of indecision and a battle between buyers and sellers for control of the market.
Compound key level
קעגנשטעל לעוועלס: $ 98.300, $ 81.600 שטיצן לעוועלס: $ 56.900, $ 68.250 Despite starting with a weak foot, the buyers in the Compound market gained power and rose after consolidating above the $56.000 significant level. This consolidation phase indicates a temporary pause in the market and a potential accumulation of prices. Over time, the buyers in the compound market continued to make extra efforts, pushing the price up to the $100.000 level. This indicates strong bullish sentiment and a potential target for the buyers.
The bulls in the market recently exited their pursuit, leading to a drop in price to the $68.250 key level. This indicates a potential resistance level and a temporary setback for the buyers. Despite the accumulating phase for Compound, the sellers in the market are showing interest in pushing the price lower. This indicates a potential shift in control from the buyers to the sellers.
מאַרק עקספּעקטאַטיאָן
The Bollinger Band indicator is piling in before a potential breakout in the compound market. This indicates a potential increase in volatility and a possible shift in market direction. The momentum indicator in the compound market is already on the rise, suggesting a possible time for a breakout. This indicates a potential increase in buying or selling pressure and a shift in market sentiment. Traders should closely monitor the momentum indicator for any signs of a breakout or a continuation of the current market trend.
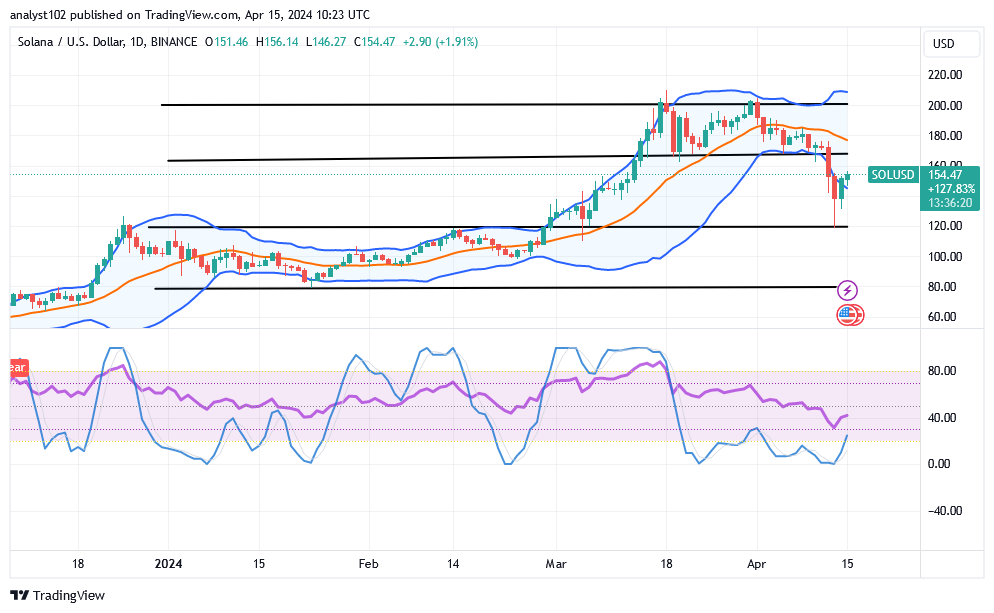
Recently, price reactions that featured is in the control of bears to make corrections, given that the סאָל / וסד האַנדל downsizes from around the resistance of $200 to find support at $120.
The last three days of bearish market movements tested the $120 value line before making a sudden shift that produced promising positive swings that are currently visible in the market. It is evident that purchasers are now motivated to revive their ways by making decisions that will keep the price above the support zone.
SOL / USD - טעגלעך טשאַרט The SOL/USD daily chart reveals that the crypto-economic market downsizes, finding support at $120.
The trend lines of both the lower and the middle Bollinger Bands are going to be instrumental in deciding the real direction that the price will follow in the near time. The stochastic oscillators have been in the oversold region, signifying that the price is tentatively in a consolidation mode.
Should buyers take advantage of the two bullish candlesticks that are currently forming in the SOL/USD trade?
As there has been about two bullish candlesticks formation, it appears that correction has been gradually ended, given that the SOL / USD מאַרק downsizes, finding support at $120.
With the emergence of a bullish candlestick during yesterday’s operations, it is highly expected of long-position pushers to star coming back provided that the support of $120 remains firmly established against any aggressive reversal to the south side. The middle Bollinger Band around $180 needs to be breached upside to propel the moves back to the point of $200.
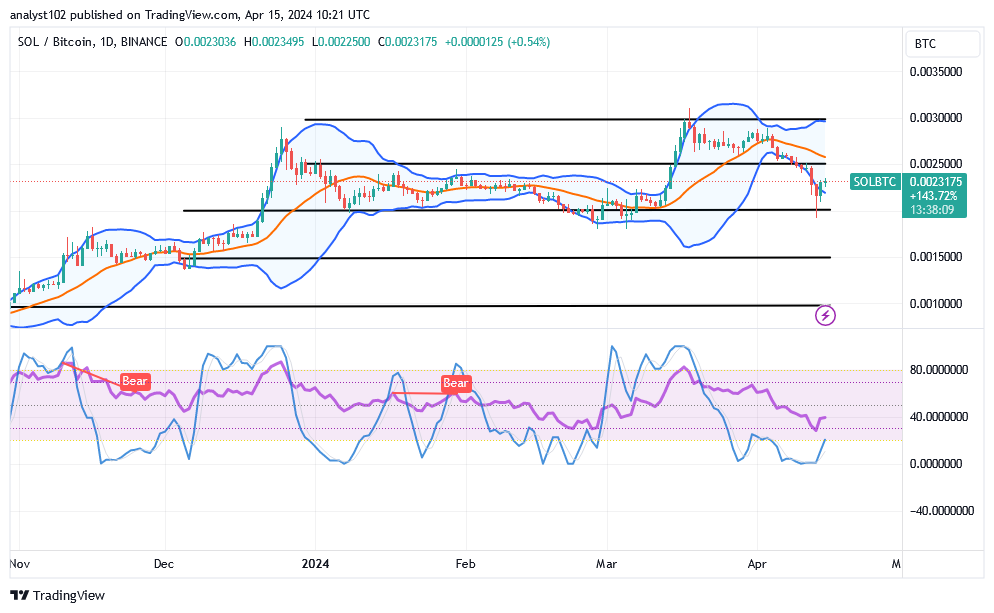
An increase movement has been portraying in the market presently, therefore, sellers would have to be cautious of making a launch. Short-position placers may be tending to have a good entry while a bullish candlestick tends to actively reverse against more than the half size of its length at a given point in time. סאָל / בטק פּרייַז אַנאַליסיס אין קאַנטראַסט, די סאָלאַנאַ מאַרק downsizes against the point of Bitcoin, finding support at the lower end of he lower Bollinger Band.
In accordance with the weight of the counter crypto, the lower Bollinger Band trend lines have been severely declining in a southerly manner. The Stochastic oscillators are in the oversold region moving relatively in a consolidation manner to denote that buying force is striving to make a recoup.
נאטיץ: Cryptosignals.org is not a financial advisor. Do your research before investing your funds in any financial asset or presente product or event. We are not responsible for your investing results.
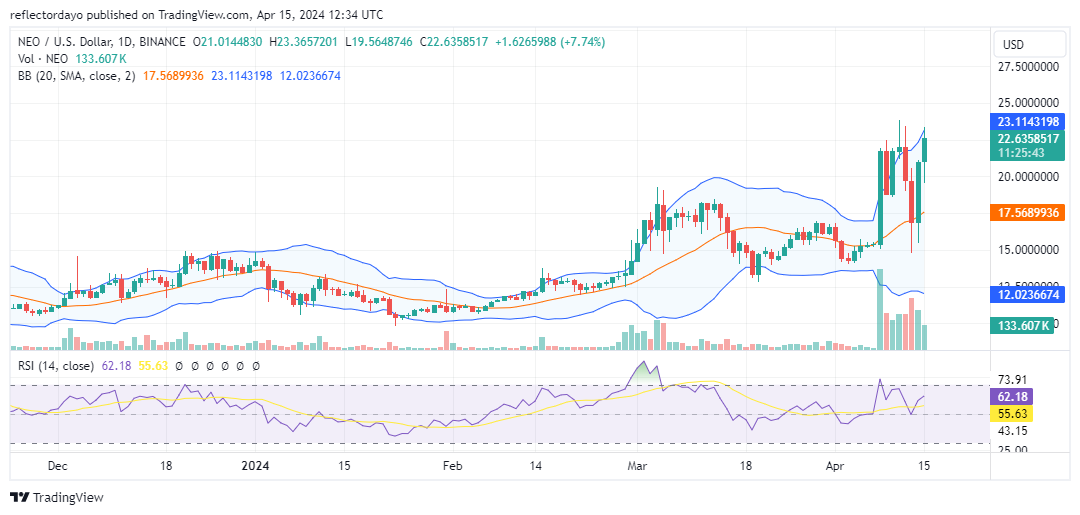
Exactly one week ago, the Neo market underwent a notable and abrupt price surge, elevating the market to approximately $23.00 per unit. This hyper-bullish movement was accompanied by a substantial correction, followed by a rebound. Throughout the week, market conditions were characterized by volatility; however, bullish sentiment predominated, leading to the establishment of a higher support level near $17.00.
The NEO Market Through the Looking Glass: A Technical Analysis
The Bollinger Bands are currently depicting a notable divergence in their bands, indicating an increase in volatility within the Neo market. Over the past week, the market has experienced significant price fluctuations, predominantly skewed towards the upside of the 20-day moving average, underscoring a קריפּטאָ סיגנאַל indicative of bullish momentum. The sustained position of bulls above the 20-day moving average further reinforces their dominance in the market.
Should bulls successfully breach the resistance level at $24.00 and maintain their position above it, they will likely propel the price channel further along its upward trajectory.
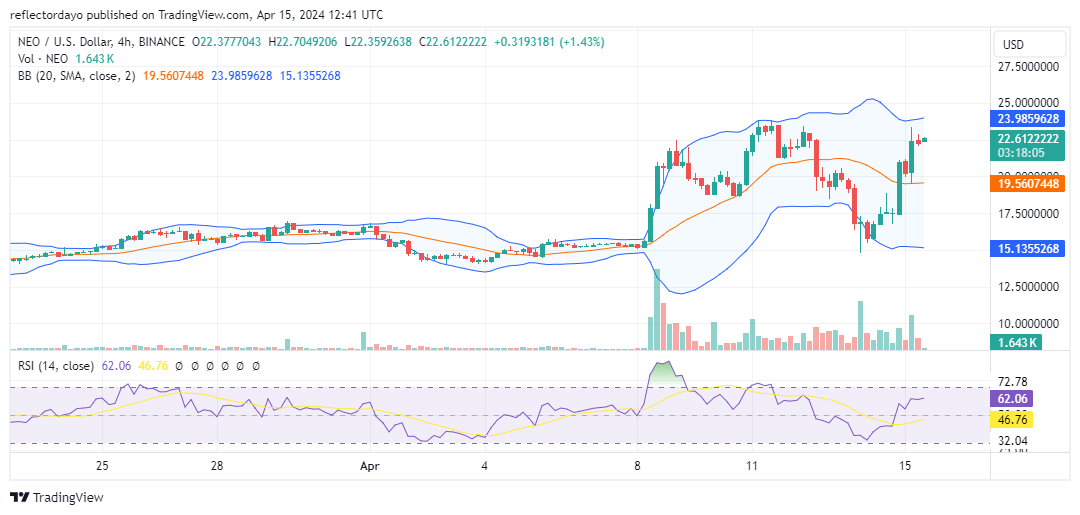
NEO/USD 4-Hour Chart Outlook: A Wild Ride Ahead?
To be precise, the resistance level from the perspective of the 4-hour chart stands at approximately $23.5. This bearish resistance has remained intact since April 11, as bearish traders persist in rejecting bullish advances around this level. Nevertheless, with the return of bullish momentum and the price rallying towards this threshold, the breach of the $23.5 resistance is crucial for sustaining the bullish trend. However, should the attempt to breach this resistance fail, the market may consolidate around the key $23.5 price level for a period before determining its next direction.
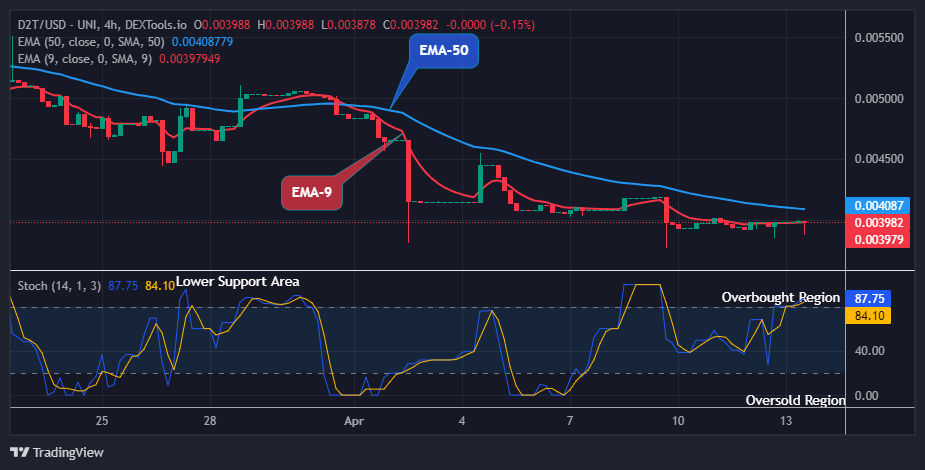
Dash 2 Trade Price Forecast: D2TUSD Price Eyeing another Reversal at $0.00387 Low Level (April 15) D2TUSD price could see another reversal at the current support level of $0.00398 to resume the uphill trend. The coin price may likely reverse in a bullish direction, and it may soon be prepared for another upbeat surge. The price may retrace to retest the previous high of $0.00550 and increase more, if buyers can demonstrate their strength and trade hands with sellers at the current support level of $0.00387. As a result, the coin price may extend further to the $0.01000 upper resistance level.
D2T (USD) לאנג-טערמין טרענד: בעריש (4H) די לאָך 2 האַנדל פּרייַז איז פאָרמינג נידעריקער לאָוז און נידעריקער כייז אויף זייַן לאַנג-טערמין טשאַרט. ווייַטער, די פּרייַז איז טריידינג אונטער די צוויי עמאַ; וואָס מיטל אַז עס איז אין אַ בעריש מאַרק זאָנע אין דעם מאָמענט. This is due to the high inflow from the sell traders. However, there is about to be a turnaround for the coin buyers.
די סוסטאַינעד דרוק פון די טראגט ביי די $ 0.00394 שטיצן מדרגה בעשאַס נעכטן ס סעסיע האט קאַנטריביוטיד צו זיין בערישנאַס אין זיין לעצטע נידעריק.
Today, the bears pulled down the לאָך 2 האַנדל price with a pin bar bearish candle to a $0.00387 support level below the moving averages, an indication of trend reversal soon.
Given the current trend, buyers can purchase the item at a lower price and push the market higher. Thus, the price tendency will move higher above the crucial levels if the bulls raise their level of market tension.
אַדדיטיאָנאַללי, D2TUSD is likely going to reverse and face the upsides as the market is now pointing upwards on the daily stochastic; it means that the selling pressure will end soon.
This will compel the buy traders to resume an uptrend and may likely break up the $0.00550 supply level which could further expose the price to a $0.01000 high mark in its higher time frame.
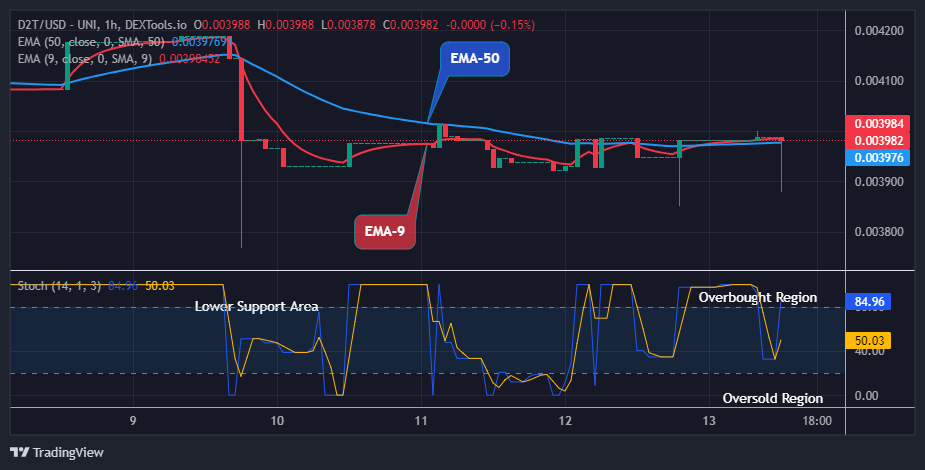
D2T (USD) מיטל-טערמין טרענד: בעריש (1H) לויט די טשאַרט אונטן, די מיטל-טערמין דערוואַרטונג פֿאַר די לאָך 2 האַנדל market is in a bearish trend zone. It also indicates the impending next significant price shift on the daily signal. די פאַרקויפן טריידערז געמאכט אַ דאַונווערד מאַך צו די $ 0.00394 שטיצן מדרגה איידער די סוף פון נעכטן ס סעסיע. דאָס האָט געגעבן סעלערז מער שטאַרקייט צו פאָרזעצן מיט דעם גאַנג אין זיין לעצטע נידעריק.
אַקטיאָנס פון די טראגט ווייַטער דראַפּט די מאַטבייע פּרייַז אַראָפּ צו די $ 0.00387 שטיצן מדרגה אונטער די צוויי EMAs ווי די 1-אַורלי טשאַרט רעזאַמייז הייַנט. דעריבער, אויב די בולז בייַטן הענט מיט די פאַרקויפן טריידערז און נאָענט העכער די $ 0.00418 קעגנשטעל ווערט, נאָך ינטראַדיי גיינז וואָלט זיין רעקאָרדעד פֿאַר די קויפן ינוועסטערז.
Adding to this, the daily stochastic is pointing upward on the daily signal; the D2TUSD price is likely to continue moving north any moment from now. This indicates that there is no longer any selling pressure, and we can anticipate the forthcoming bullish correction phase to quickly achieve a high of $0.01000 in its medium-term time frame.
Have you already noticed it? The newest feature of D2T?
האָט איר עס נאָך געפֿונען? די לעצטע שטריך פון D2T?🚀
Top באַקקטעסטעד באָץ איז אַ קוראַטעד רשימה פון דאַש 2 האַנדל באָץ מיט די בעסטער באַקקטעסטינג רעזולטאַטן.
כל איר דאַרפֿן צו טאָן צו נאָכמאַכן איינער איז גיט "האַנדל"!
Solana emerges as a pioneering blockchain platform meticulously crafted to accommodate decentralized applications (dApps) and cryptocurrencies, prioritizing high transaction throughput while maintaining minimal costs. This feat is accomplished through a distinctive mechanism pioneered by Solana Labs known as Proof of History (PoH), alongside the traditional Delegated Proof of Stake (DPoS).
This fusion not only aims for scalability but also endeavors to safeguard decentralization and security. The Solana team’s mastery of compression algorithms birthed PoH, serving as a chronological testament to event occurrences, significantly streamlining the consensus process, and propelling Solana towards unprecedented efficiencies in decentralized transaction speeds.
טעגלעך SOL transfers on Solana nearly match those of Ethereum in US dollars. An intriguing trend arises due to Solana’s low transaction fees and swift execution, leading to a notably high number of “minnow” transfers—those valued under $1 million—compared to “whale” transfers. Over 80% of the total value transferred on Solana originates from such minnow transfers. Conversely, Ethereum exhibits a minnow ratio of only 40%, as users avoid sending funds due to substantial fee implications.
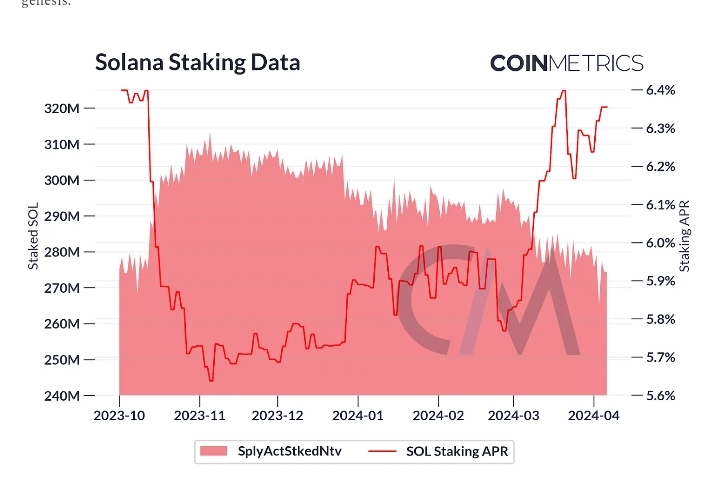
Consensus and Staking
In the delegated proof-of-stake consensus mechanism, SOL can be staked by validators and delegators alike. Validators operate high-performance physical infrastructure, while delegators entrust their stakes to validators. Validator infrastructure typically entails a machine with 512 GB of memory and a 16-core CPU, meeting the requirements for executing a high flow of transactions.
Following a leader schedule, a single validator processes each block, subject to validation by other validators. The leader sequences messages and computes the chain’s new state. Through leadership rotation, the network ensures decentralization and security. Votes carry weight based on validators’ stakes, with a supermajority necessary for block confirmation, ensuring finality, and preventing forks. Validators and their delegators receive a steady flow of block rewards per epoch (approximately every 2 to 3 days). Inflation currently stands at around 5%, set to decrease to 1.5% ten years after chain genesis.
The lead validator of each block receives half of the block’s transaction fees, while the other half is burned, instilling a deflationary effect on SOL. Transaction signing costs a mere 0.000005 SOL, with this base fee applicable to all transactions, including vote transactions by וואַלאַדייטערז. Unlike Ethereum, Solana blocks are far from full, historically maintaining a low SOL burn rate.
However, recent demand for block inclusion and ecosystem upgrades has complexified the transaction fee model. The compute budget program empowers users to manipulate the compute units of their transactions, quantifying the computational complexity akin to gas on EVM blockchains. Users can adjust the price per compute unit and set higher compute unit limits for resource-intensive transactions.
Solana User Landscape
Solana’s user base is divided into two main categories: externally-owned accounts (EOAs) and program-derived accounts (PDAs). Unlike chains compatible with the Ethereum Virtual Machine (EVM), where states reside within individual smart contracts, Solana requires users to store data on-chain independently via PDAs.
By deploying a program, users can add executable code to the chain, creating a blueprint for generating a PDA co-owned by both the user and the program. Fund movement follows the program’s directives, with each PDA possessing a unique address. Notably, even to engage with a new token, a PDA must be established first, rendering the unique address metric misleading to Solana. Instead, identifying EOAs as wallets allows for estimating unique Solana users.
סאָלאַנאַ יקאָוסיסטאַם
Solana’s entrance into the scene has spurred a diverse range of projects spanning decentralized finance (DeFi), non-fungible tokens (NFTs), and beyond, attracted by its scalability and developer-friendly environment. Despite encountering challenges related to network stability and intermittent outages, Solana’s resilience and continual improvements underscore its dedication to fostering a robust ecosystem, bolstered by regular month-long hackathons. Leading in memecoin trading, mobile interoperability, and decentralized physical infrastructure networks (DePIN) like Hivemapper or Helium, Solana showcases its prominence in the blockchain space.
The Solana Program Library offers a standardized program for token minting, including fungible and non-fungible tokens. Recent upgrades, such as confidential transfers, transfer fees, and soulbound tokens, have augmented its functionalities. SPL tokens have always played a vital role in the Solana ecosystem, with recent months witnessing their increased significance in token transfers compared to SOL transfers. This discrepancy may stem from behavioral differences between seasoned Solana users and seasonal memecoin traders, highlighting the diverse dynamics within the Solana community.
סאָף
Solana excels at bridging security with throughput through its streamlined consensus mechanism, championing the monolithic blockchain narrative while facing challenges of greater centralization. Despite higher hardware requirements, Solana’s accessibility, exceptional UI/UX, and dedicated developer support attract both developers and users.
Its Proof of History mechanism ensures efficiency and speed, catering to projects requiring rapid execution. Solana’s expanding ecosystem fosters innovation across various applications, with users drawn to its fast transaction times and low fees, democratizing blockchain technology access. However, the longevity of its memecoin frenzy participants remains uncertain, reflecting the dynamic nature of the Solana community.
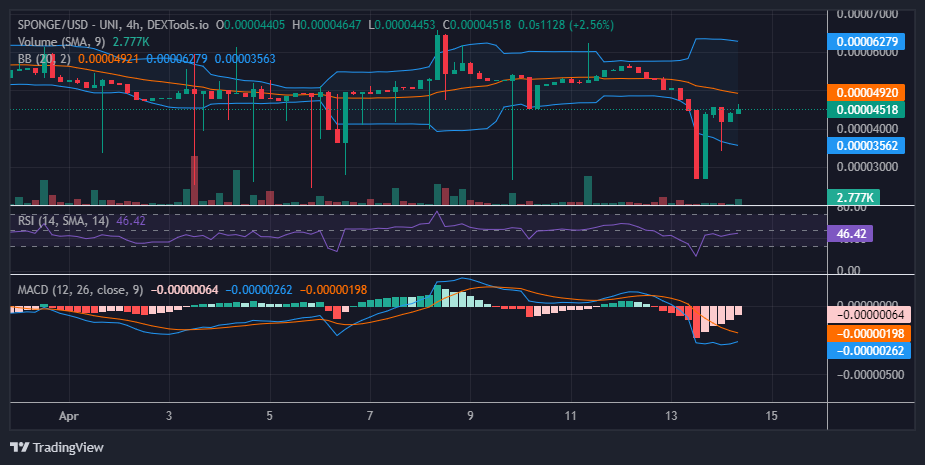
The general cryptocurrency market has been experiencing rough waves lately, and the $ שוואָם market has had its own fair share of the experience. Prices took a dive, breaching the $0.000050 mark (after a while of consolidating or ranging sideways along the level) and even sinking lower than $0.000030. But just like a sponge absorbing water, SPONGE found support, absorbing the sell-off as it bounced back up towards $0.000050. Currently, it’s hovering around $0.000045.
דעלווינג אין טעכניש אַנאַליסיס פֿאַר $ שוואָם (שוואָם / וסד):
SPONGE/USD is in a recovery phase, but it’s facing resistance at $0.000045 because bears have now occupied this level for a resistance. Indicators like the RSI (measuring buying and selling pressure) and MACD (analyzing momentum) suggest a balanced market. The RSI is around 46, indicating neither buyers nor sellers are in full control. The MACD shows some bullish קריפּטאָ סיגנאַלז, hinting at a possible comeback. Fading red bars on the MACD suggest selling pressure is easing, potentially paving the way for a bullish surge. The main hurdle to overcome is the resistance at $0.000045.
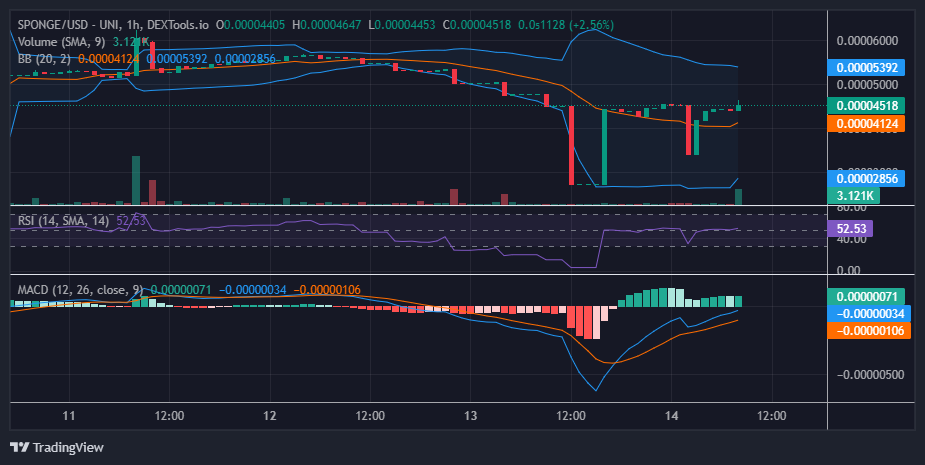
ינסייץ פון די 1-שעה פּערספּעקטיוו:
Looking at the 1-hour chart, the Bollinger Bands paint an interesting picture. The bands have been wide, reflecting significant price swings between $0.000030 and $0.000045. However, as the price steadies around $0.000045, the bands are starting to narrow, suggesting less volatility. Reclaiming this level is crucial for the bulls to turn the tide and push the price back towards $0.000050.
As bearish sentiment pervades the majority of the crypto market, the שוואָם / וסד market has also been impacted. Prices slid below the $0.000050 level, breaching even the $0.000045 threshold and plummeting further to below $0.000030. However, this downward movement prompted a robust bullish reaction, which restored prices back towards $0.000050. Presently, the market has stabilized around the $0.000045 price level.
דעלווינג אין טעכניש אַנאַליסיס פֿאַר $ שוואָם (שוואָם / וסד):
The SPONGE/USD pair is undergoing a recovery phase, according to this קריפּטאָ סיגנאַל, yet it faces significant bearish resistance at the $0.000045 level. Both the Relative Strength Index (RSI) and the Moving Average Convergence Divergence (MACD) indicator indicate a balanced market situation, with demand and supply evenly matched. The RSI line hovers sideways around 46, while the MACD histograms show bullish tendencies, suggesting a move towards recovery. Additionally, the fading red histograms indicate a decrease in selling pressure, signaling potential bullish momentum. The immediate priority is to overcome the resistance barrier at $0.000045.
ינסייץ פון די 1-שעה פּערספּעקטיוו:
From the 1-hour chart perspective, the Bollinger Bands reflect an intriguing market condition, with rapid swings between $0.00003 and $0.000045 indicating significant volatility, resulting in a widened Bollinger bandwidth. However, as the price stabilizes around $0.000045, we observe the bands beginning to converge, indicating a reduction in volatility. It is crucial for bulls to reclaim this level in order to facilitate a market turnaround towards the $0.00005 price level.
A lot of activities have surfaced to demonstrate that bulls have suffered a huge loss of momentum in the UNI/USD market, given that they are searching for a baseline.
Bears are able to apply additional pressure to the south side of the market against the $10 mark in sequence to a sh0rt line of sideways against the lower Bollinger Band trend line. And as a result of this analysis, the price is now searching for any potential moment of recovery close to the $6 support level.
UNI / USD - טעגלעך טשאַרט The UNI/USD daily chart reveals that the crypto economy debases, searching for a baseline around the line of $6.
The lower Bollinger Band trend has now been placed tightly above the bottom of the candlesticks formed between yesterday and today. In the interim, the current formation of the candlestick is a positive promissory crypto signal note to denote that sellers may be facing a tough time subsequently. The stochastic oscillators have been seen moving around lower spots in a bid to suggest an end to smooth declines.
Given that the UNI/USD market has dropped to below $6, should buyers refrain from securing dip buys?
We do not hold the opinion of putting it off while there has been a positive promissory signal against seeing more stable reductions as the UNI / USD מאַרק debases, searching for a baseline.
Given that a significant upswing is widely anticipated, the cryptocurrency market must undergo a period of correction in order to gain momentum before that happens. If that’s the case, this would be a good time for long-position pushers to start turning a profit.
Given the current state of the trade perspective, bears have squandered a great deal of opportunity because the current pattern does not indicate favorable technicalities for entry. Any attempt by the price to break below the lower Bollinger Band could result in a trap for sellers. UNI / BTC פּרייס אַנאַליסיס אין קאַנטראַסט, די יוניסוואַפּ מאַרק debases against the valuation of Bitcoin, searching for a baseline.
A steady fall has caused the Bollinger Band trend lines to significantly extend southward at the lower section. A smaller bullish candlestick is forming in the interim, which may put a halt to the dropping forces. Since the stochastic oscillators were oversold, \ נאטיץ:Cryptosignals.org איז נישט אַ פינאַנציעל אַדווייזער. טאָן דיין פאָרשונג איידער ינוועסטינג דיין געלט אין קיין פינאַנציעל אַסעט אָדער דערלאנגט פּראָדוקט אָדער געשעעניש. מיר זענען נישט פאַראַנטוואָרטלעך פֿאַר דיין ינוועסטינג רעזולטאַטן.
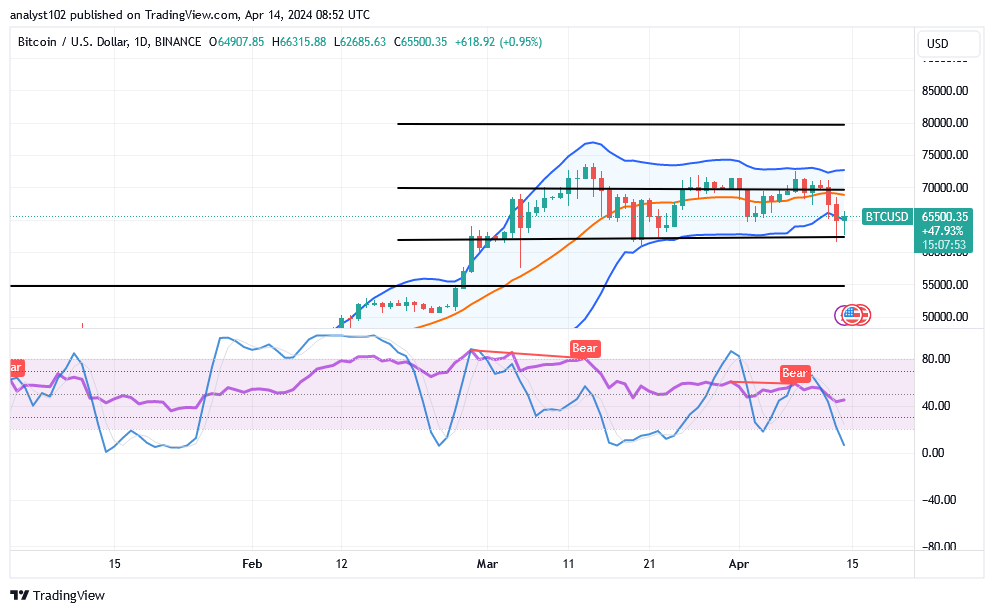
It has been closely observed that the point of $60,000 will serve as the key line against seeing more falls, given that the בטק / וסד מאַרק is currently decreasing and tending to find support around the value line mentioned.
As things may turn out in the near future, today’s candlestick formation has shown that bulls are well-positioned to reclaim their gains, so long as the $60,000 support level doesn’t collapse in a way that prevents long-term declines. On the basis of such a supposition, purchasing orders might be implemented gradually and in a long-term way.
בטק / וסד - טעגלעך טשאַרט The BTC/USD daily chart showcases the crypto market decreasing, tending to find support around the value line of $60,000.
The stochastic oscillators have had the blue line touch through some points in the oversold region, denoting that a considerable maximal southward movement has been reached. The lower Bollinger Band trend line, together with a horizontal line below it, are going to provide spots where buyers are likely to get a decent rebounding entry signal.
Where is the present position of the positive crypto signal in the BTXC/USD market operations?
A horizontal line has been made around the value line of $60,000 to denote probable formidable zones toward getting decent longing entries as the בטק / וסד האַנדל decreases, tending to find support around the point.
Fearful downward pressure throughout yesterday’s sessions resulted in panic sells for a while below the $65,000 mark. To dowse the moves, a bullish candlestick has been developing in the interim. And on that basis, bulls are probably gradually regaining dominance at this point.
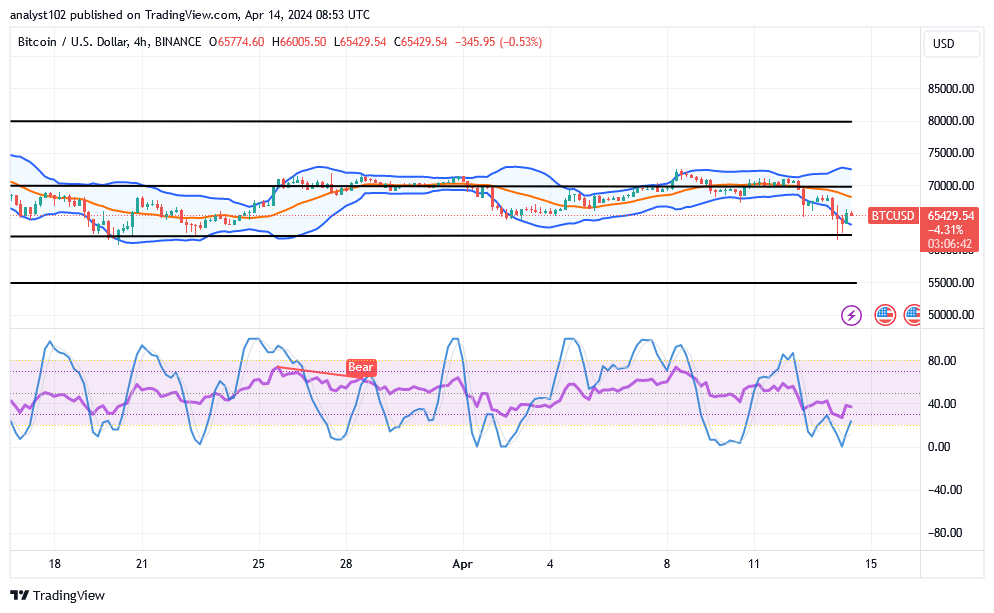
It has been observed that selling activity in the Bitcoin vs. US dollar market has reached risky levels and may not decline much more, particularly below the key level of $65,000. Should that assumption need to be disproved, price movement must resurface below the lower Bollinger Band in order to exert pressure on bulls. בטק / וסד 4-שעה טשאַרט The BTC/USD 4-hour chart reveals the cryptocurrency market is decreasing, tending to find support close to the level of $60,000.
The stochastic oscillators have succeeded in diverging into the oversold area to the south on their paths. If the price tends to make consistent positive moves against the $70,000 line in the near future, the Bollinger Band trend lines are positioned advantageously to suggest that this line will be the critical barrier location to obtain optimal moves.
נאטיץ:Cryptosignals.org איז נישט אַ פינאַנציעל אַדווייזער. טאָן דיין פאָרשונג איידער ינוועסטינג דיין געלט אין קיין פינאַנציעל אַסעט אָדער דערלאנגט פּראָדוקט אָדער געשעעניש. מיר זענען נישט פאַראַנטוואָרטלעך פֿאַר דיין ינוועסטינג רעזולטאַטן.