Market Analysis – Compound Remain in Consolidation Fold
COMPOUND sellers hint at a sell breakout. Compound has been experiencing a 巩固阶段 in the crypto market, with the price struggling to gain momentum between the key levels of $76.820 and $68.250. This consolidation phase indicates a period of indecision and a battle between buyers and sellers for control of the market.
Compound key level
阻力位:$ 98.300,$ 81.600 支撑位:$ 56.900,$ 68.250 Despite starting with a weak foot, the buyers in the Compound market gained power and rose after consolidating above the $56.000 significant level. This consolidation phase indicates a temporary pause in the market and a potential accumulation of prices. Over time, the buyers in the compound market continued to make extra efforts, pushing the price up to the $100.000 level. This indicates strong bullish sentiment and a potential target for the buyers.
The bulls in the market recently exited their pursuit, leading to a drop in price to the $68.250 key level. This indicates a potential resistance level and a temporary setback for the buyers. Despite the accumulating phase for Compound, the sellers in the market are showing interest in pushing the price lower. This indicates a potential shift in control from the buyers to the sellers.
市场预期
The Bollinger Band indicator is piling in before a potential breakout in the compound market. This indicates a potential increase in volatility and a possible shift in market direction. The momentum indicator in the compound market is already on the rise, suggesting a possible time for a breakout. This indicates a potential increase in buying or selling pressure and a shift in market sentiment. Traders should closely monitor the momentum indicator for any signs of a breakout or a continuation of the current market trend.
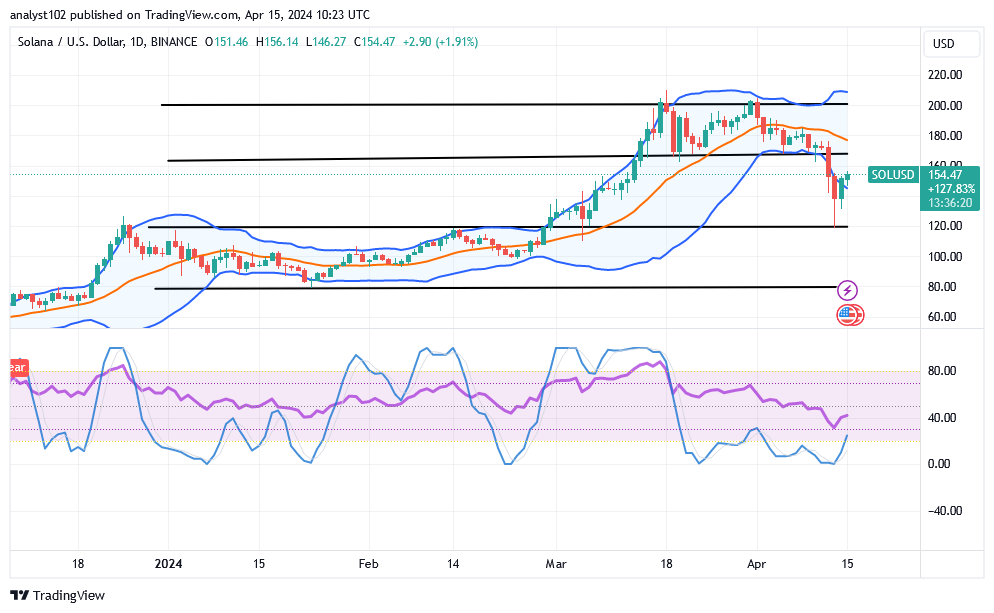
Recently, price reactions that featured is in the control of bears to make corrections, given that the SOL/美元交易 downsizes from around the resistance of $200 to find support at $120.
The last three days of bearish market movements tested the $120 value line before making a sudden shift that produced promising positive swings that are currently visible in the market. It is evident that purchasers are now motivated to revive their ways by making decisions that will keep the price above the support zone.
SOL/USD – 日线图 The SOL/USD daily chart reveals that the crypto-economic market downsizes, finding support at $120.
The trend lines of both the lower and the middle Bollinger Bands are going to be instrumental in deciding the real direction that the price will follow in the near time. The stochastic oscillators have been in the oversold region, signifying that the price is tentatively in a consolidation mode.
Should buyers take advantage of the two bullish candlesticks that are currently forming in the SOL/USD trade?
As there has been about two bullish candlesticks formation, it appears that correction has been gradually ended, given that the SOL/美元行情 downsizes, finding support at $120.
With the emergence of a bullish candlestick during yesterday’s operations, it is highly expected of long-position pushers to star coming back provided that the support of $120 remains firmly established against any aggressive reversal to the south side. The middle Bollinger Band around $180 needs to be breached upside to propel the moves back to the point of $200.
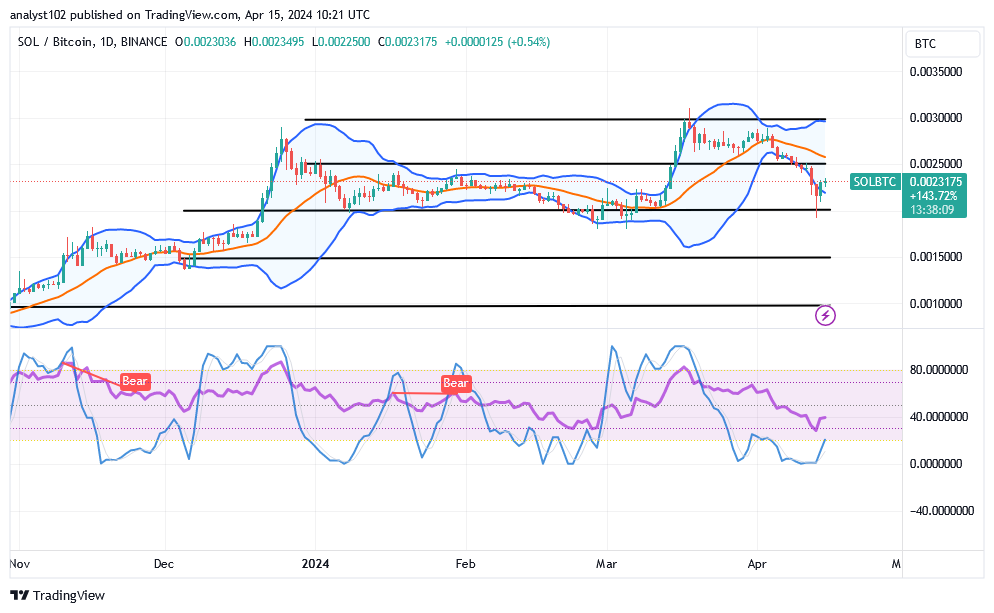
An increase movement has been portraying in the market presently, therefore, sellers would have to be cautious of making a launch. Short-position placers may be tending to have a good entry while a bullish candlestick tends to actively reverse against more than the half size of its length at a given point in time. SOL/BTC 价格分析 与此相反, 索拉纳市场 downsizes against the point of Bitcoin, finding support at the lower end of he lower Bollinger Band.
In accordance with the weight of the counter crypto, the lower Bollinger Band trend lines have been severely declining in a southerly manner. The Stochastic oscillators are in the oversold region moving relatively in a consolidation manner to denote that buying force is striving to make a recoup.
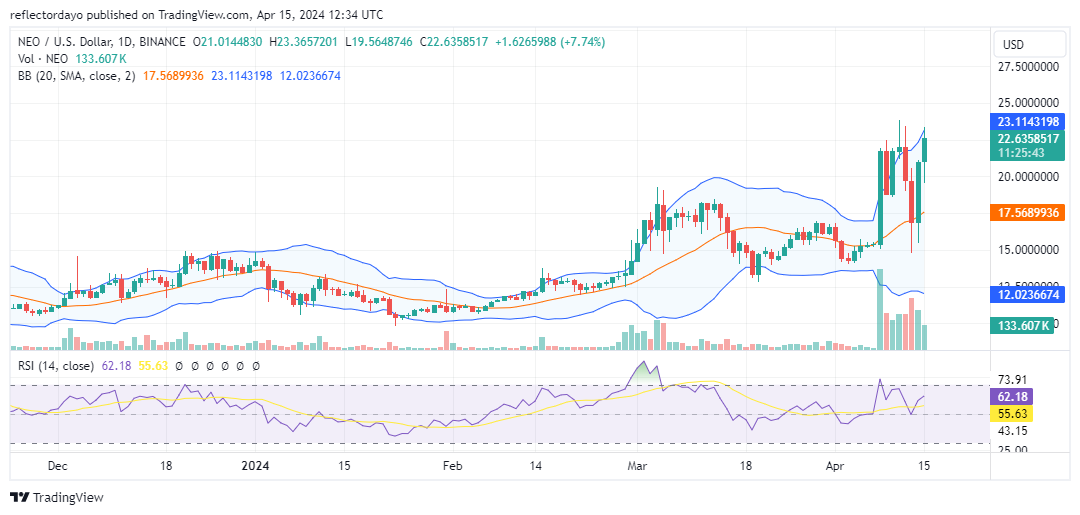
就在一周前, Neo market underwent a notable and abrupt price surge, elevating the market to approximately $23.00 per unit. This hyper-bullish movement was accompanied by a substantial correction, followed by a rebound. Throughout the week, market conditions were characterized by volatility; however, bullish sentiment predominated, leading to the establishment of a higher support level near $17.00.
新市场数据
NEO/美元现价:22.55 美元
NEO/USD Market Cap: $ 1.6 billion
NEO/USD Circulating Supply: 70 million
NEO/USD Total Supply: 100 million
NEO/USD CoinMarketCap 排名:#60
关键水平
阻力位: $ 24.00,$ 24.50和$ 25.00。
客户支持: $ 19.00,$ 18.50和$ 18.00。
The NEO Market Through the Looking Glass: A Technical Analysis
The Bollinger Bands are currently depicting a notable divergence in their bands, indicating an increase in volatility within the Neo market. Over the past week, the market has experienced significant price fluctuations, predominantly skewed towards the upside of the 20-day moving average, underscoring a 密码信号 indicative of bullish momentum. The sustained position of bulls above the 20-day moving average further reinforces their dominance in the market.
Should bulls successfully breach the resistance level at $24.00 and maintain their position above it, they will likely propel the price channel further along its upward trajectory.
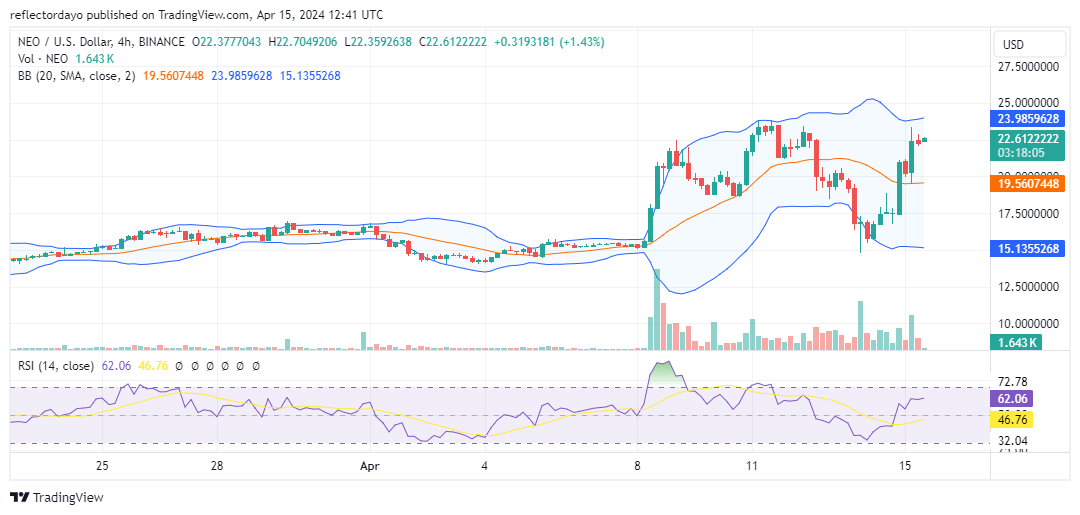
NEO/USD 4-Hour Chart Outlook: A Wild Ride Ahead?
To be precise, the resistance level from the perspective of the 4-hour chart stands at approximately $23.5. This bearish resistance has remained intact since April 11, as bearish traders persist in rejecting bullish advances around this level. Nevertheless, with the return of bullish momentum and the price rallying towards this threshold, the breach of the $23.5 resistance is crucial for sustaining the bullish trend. However, should the attempt to breach this resistance fail, the market may consolidate around the key $23.5 price level for a period before determining its next direction.
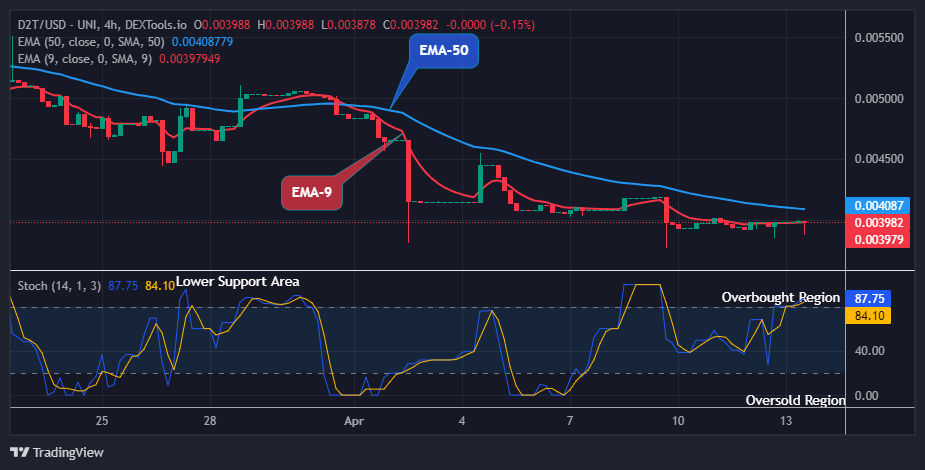
Dash 2 Trade Price Forecast: D2TUSD Price Eyeing another Reversal at $0.00387 Low Level (April 15) D2TUSD price could see another reversal at the current support level of $0.00398 to resume the uphill trend. The coin price may likely reverse in a bullish direction, and it may soon be prepared for another upbeat surge. The price may retrace to retest the previous high of $0.00550 and increase more, if buyers can demonstrate their strength and trade hands with sellers at the current support level of $0.00387. As a result, the coin price may extend further to the $0.01000 upper resistance level.
D2T (USD) 长期趋势:看跌 (4H) Dash 2 交易 价格在其长期图表上正在形成更低的低点和更低的高点。 此外,价格低于两个 EMA; 这意味着它目前处于看跌市场区域。 This is due to the high inflow from the sell traders. However, there is about to be a turnaround for the coin buyers.
昨天交易时段,空头在 0.00394 美元的支撑位上持续施压,导致其跌至近期低点。
Today, the bears pulled down the Dash 2 交易 price with a pin bar bearish candle to a $0.00387 support level below the moving averages, an indication of trend reversal soon.
Given the current trend, buyers can purchase the item at a lower price and push the market higher. Thus, the price tendency will move higher above the crucial levels if the bulls raise their level of market tension.
此外, D2TUSD is likely going to reverse and face the upsides as the market is now pointing upwards on the daily stochastic; it means that the selling pressure will end soon.
This will compel the buy traders to resume an uptrend and may likely break up the $0.00550 supply level which could further expose the price to a $0.01000 high mark in its higher time frame.
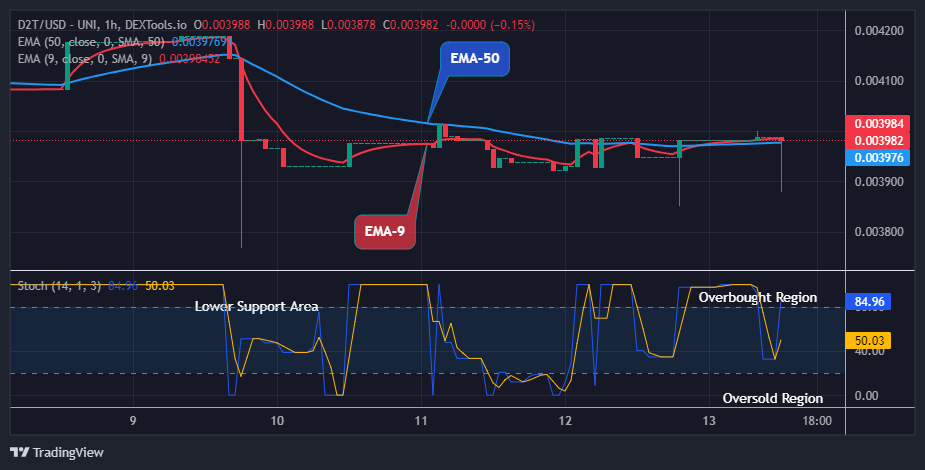
D2T (USD) 中期趋势:看跌 (1H) 根据下图,中期前景 Dash 2 交易 market is in a bearish trend zone. It also indicates the impending next significant price shift on the daily signal. 卖出交易者在昨日交易结束前下行至 0.00394 美元的支撑位。 这使卖家更有力量继续近期低点的趋势。
随着 0.00387 小时图今天恢复,空头的行动进一步将代币价格跌至两个 EMA 下方的 1 美元支撑位。 因此,如果多头与空头交易者易手并收于 0.00418 美元阻力位上方,则多头投资者将获得额外的盘中收益。
Adding to this, the daily stochastic is pointing upward on the daily signal; the D2TUSD price is likely to continue moving north any moment from now. This indicates that there is no longer any selling pressure, and we can anticipate the forthcoming bullish correction phase to quickly achieve a high of $0.01000 in its medium-term time frame.
Have you already noticed it? The newest feature of D2T?
Solana emerges as a pioneering blockchain platform meticulously crafted to accommodate decentralized applications (dApps) and cryptocurrencies, prioritizing high transaction throughput while maintaining minimal costs. This feat is accomplished through a distinctive mechanism pioneered by Solana Labs known as Proof of History (PoH), alongside the traditional Delegated Proof of Stake (DPoS).
This fusion not only aims for scalability but also endeavors to safeguard decentralization and security. The Solana team’s mastery of compression algorithms birthed PoH, serving as a chronological testament to event occurrences, significantly streamlining the consensus process, and propelling Solana towards unprecedented efficiencies in decentralized transaction speeds.
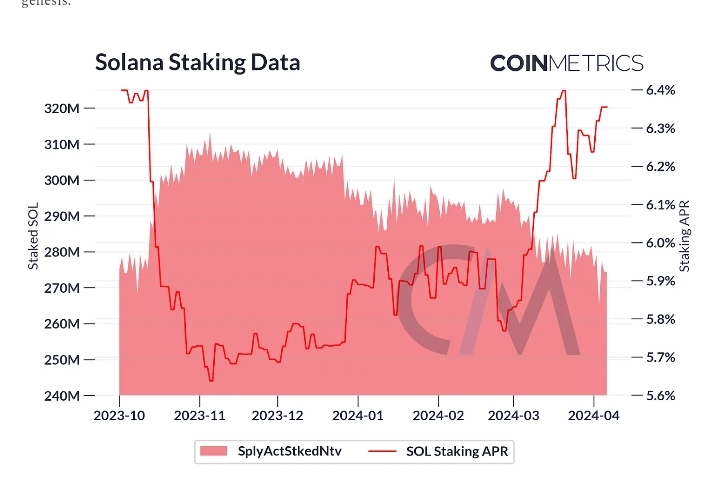
日间 SOL transfers on Solana nearly match those of Ethereum in US dollars. An intriguing trend arises due to Solana’s low transaction fees and swift execution, leading to a notably high number of “minnow” transfers—those valued under $1 million—compared to “whale” transfers. Over 80% of the total value transferred on Solana originates from such minnow transfers. Conversely, Ethereum exhibits a minnow ratio of only 40%, as users avoid sending funds due to substantial fee implications.
Consensus and Staking
In the delegated proof-of-stake consensus mechanism, SOL can be staked by validators and delegators alike. Validators operate high-performance physical infrastructure, while delegators entrust their stakes to validators. Validator infrastructure typically entails a machine with 512 GB of memory and a 16-core CPU, meeting the requirements for executing a high flow of transactions.
Following a leader schedule, a single validator processes each block, subject to validation by other validators. The leader sequences messages and computes the chain’s new state. Through leadership rotation, the network ensures decentralization and security. Votes carry weight based on validators’ stakes, with a supermajority necessary for block confirmation, ensuring finality, and preventing forks. Validators and their delegators receive a steady flow of block rewards per epoch (approximately every 2 to 3 days). Inflation currently stands at around 5%, set to decrease to 1.5% ten years after chain genesis.
The lead validator of each block receives half of the block’s transaction fees, while the other half is burned, instilling a deflationary effect on SOL. Transaction signing costs a mere 0.000005 SOL, with this base fee applicable to all transactions, including vote transactions by 验证者. Unlike Ethereum, Solana blocks are far from full, historically maintaining a low SOL burn rate.
However, recent demand for block inclusion and ecosystem upgrades has complexified the transaction fee model. The compute budget program empowers users to manipulate the compute units of their transactions, quantifying the computational complexity akin to gas on EVM blockchains. Users can adjust the price per compute unit and set higher compute unit limits for resource-intensive transactions.
Solana User Landscape
Solana’s user base is divided into two main categories: externally-owned accounts (EOAs) and program-derived accounts (PDAs). Unlike chains compatible with the Ethereum Virtual Machine (EVM), where states reside within individual smart contracts, Solana requires users to store data on-chain independently via PDAs.
By deploying a program, users can add executable code to the chain, creating a blueprint for generating a PDA co-owned by both the user and the program. Fund movement follows the program’s directives, with each PDA possessing a unique address. Notably, even to engage with a new token, a PDA must be established first, rendering the unique address metric misleading to Solana. Instead, identifying EOAs as wallets allows for estimating unique Solana users.
索拉纳生态系统
Solana’s entrance into the scene has spurred a diverse range of projects spanning decentralized finance (DeFi), non-fungible tokens (NFTs), and beyond, attracted by its scalability and developer-friendly environment. Despite encountering challenges related to network stability and intermittent outages, Solana’s resilience and continual improvements underscore its dedication to fostering a robust ecosystem, bolstered by regular month-long hackathons. Leading in memecoin trading, mobile interoperability, and decentralized physical infrastructure networks (DePIN) like Hivemapper or Helium, Solana showcases its prominence in the blockchain space.
The Solana Program Library offers a standardized program for token minting, including fungible and non-fungible tokens. Recent upgrades, such as confidential transfers, transfer fees, and soulbound tokens, have augmented its functionalities. SPL tokens have always played a vital role in the Solana ecosystem, with recent months witnessing their increased significance in token transfers compared to SOL transfers. This discrepancy may stem from behavioral differences between seasoned Solana users and seasonal memecoin traders, highlighting the diverse dynamics within the Solana community.
结论
Solana excels at bridging security with throughput through its streamlined consensus mechanism, championing the monolithic blockchain narrative while facing challenges of greater centralization. Despite higher hardware requirements, Solana’s accessibility, exceptional UI/UX, and dedicated developer support attract both developers and users.
Its Proof of History mechanism ensures efficiency and speed, catering to projects requiring rapid execution. Solana’s expanding ecosystem fosters innovation across various applications, with users drawn to its fast transaction times and low fees, democratizing blockchain technology access. However, the longevity of its memecoin frenzy participants remains uncertain, reflecting the dynamic nature of the Solana community.