Tamadoge (TAMAUSD) Bulls Gather Around $0.0204; The Market Turns to the Upside
Estimated Reading Time: 2 minutes
Don’t invest unless you’re prepared to lose all the money you invest. This is a high-risk investment and you are unlikely to be protected if something goes wrong. Take 2 minutes to learn more

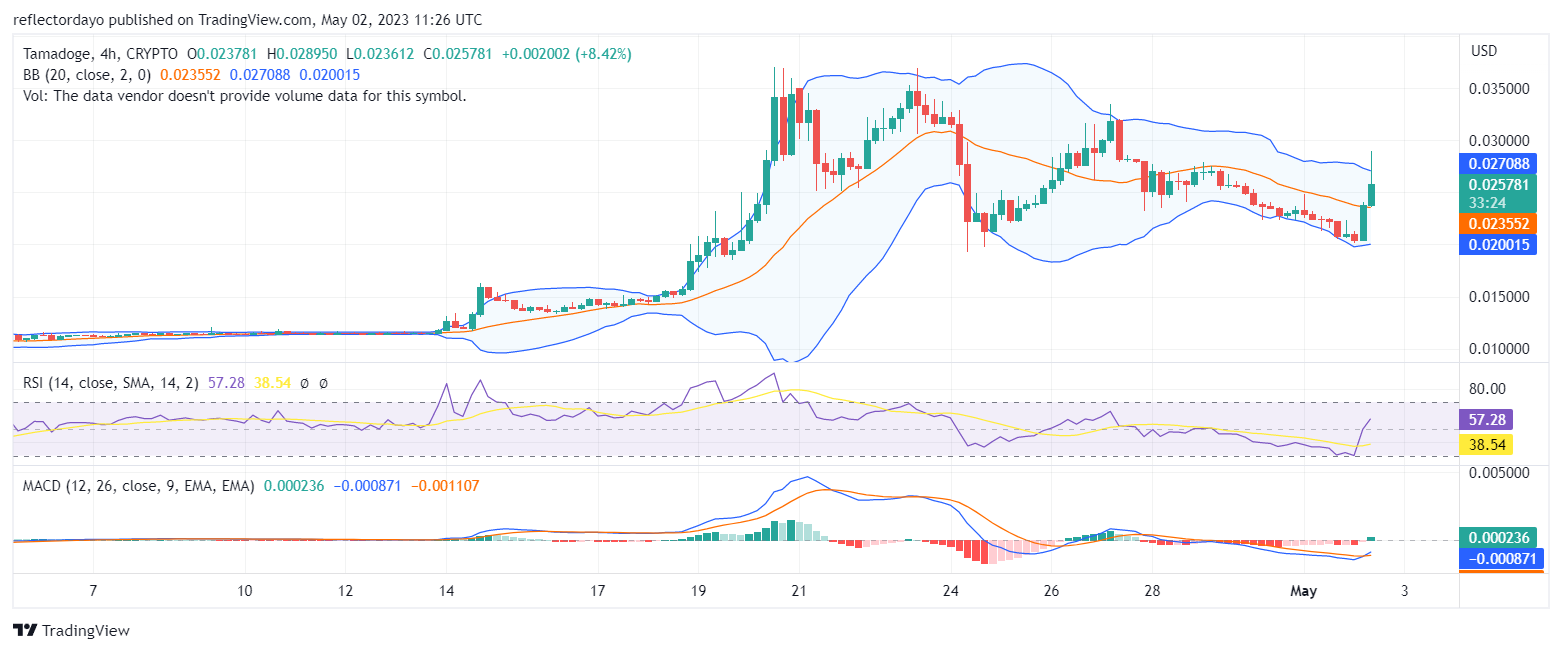
As the TAMA bear gradually loses grip on the market, we see the bulls taking over after securing $0.0204 as a strong demand level. Today’s trading session so far has been dominated by the bulls, and the market has tested price levels near the $0.0300 price. The previous daily session saw a significant reduction in selling pressure as the bear market neared the key support level. This was due to the willingness of traders to buy again around the price level.
Key Levels
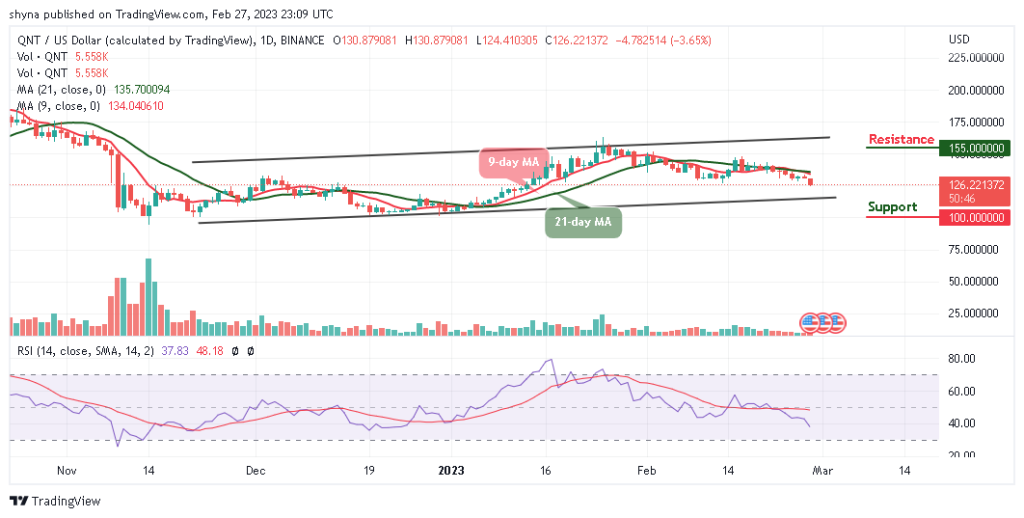
- Resistance: $0.035, $0.040, and $0.045
- Support: $0.020, $0.018, and $0.015
Tamadoge (TAMAUSD) Price Analysis: The Indicators’ Point of View
Initially, the Bollinger Bands indicator has been illustrating a downward-trending price channel, but since the price action has now crossed above the 20-day moving average, the indicator will change the direction of the price channel. In response to this development, we noticed the convergence of the bands of the indicator. This is due to the growing activities of the bulls in the market. The Relative Strength Index (RSI) indicator, which has an almost vertical rise, is a testament to the aggression in the bull market.
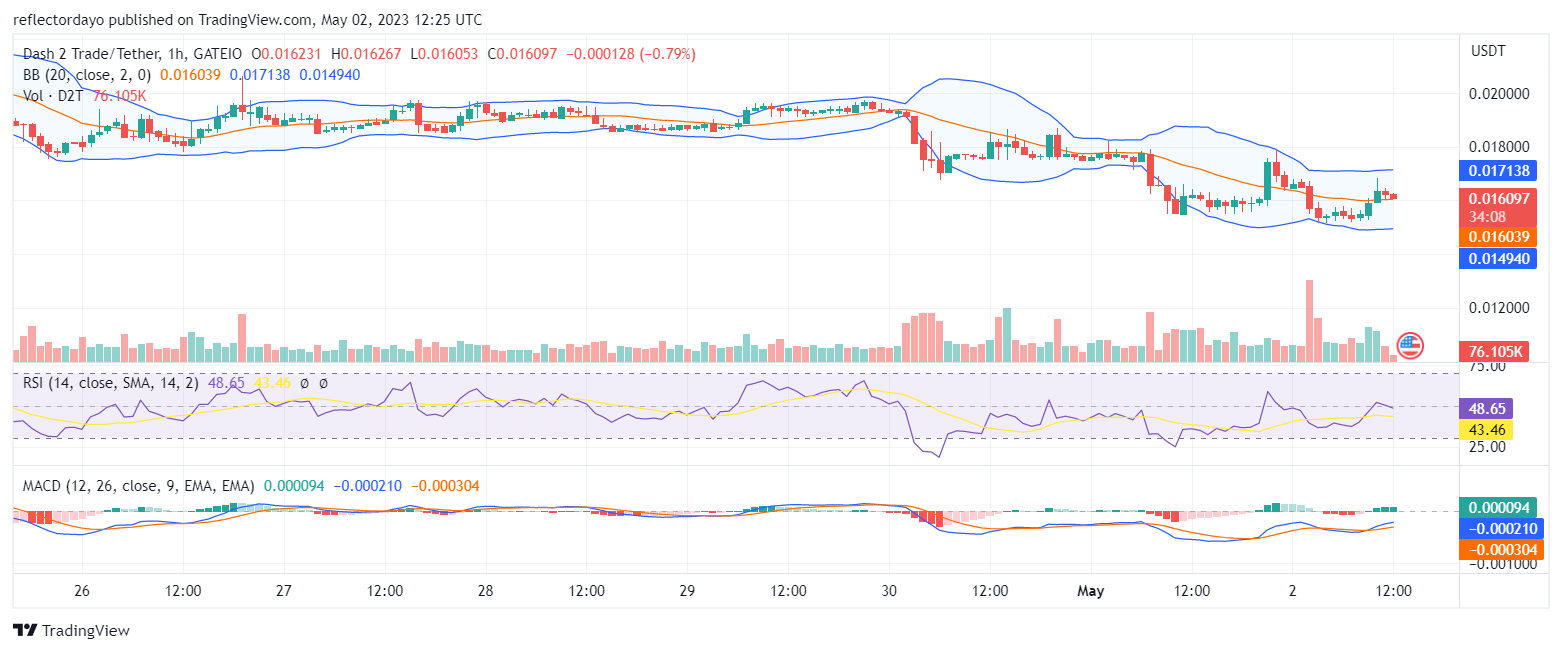
TAMA/USD Short-Term Outlook: 1-Hour Chart
From the standpoint of the 1-hour chart, the indicators are bullish on the market. In the Bollinger Bands indicator, the upper standard deviation curve and the moving average are responding to the bullish move in the market. However, the lower standard deviation curve, which is moving in divergence from the rest of the pointers, indicates an increasing volatility in the market. It is also an indication of an increase in the liquidity level of the market. The current pullback in the price action is just a retracement from overbought territory. The force behind the bullish move is still active. The pullback is just an opportunity for more traders to go long.
Tamadoge is now live on BCGames.
https://twitter.com/Tamadogecoin/status/1653429396609327108
Do you want a coin that will be 100 times more valuable in the next few months? That is Tamadoge. Buy TAMA today!