Cardano (ADA) Consolidates above $1.20 Support, Poises for Upward Move Soon
Estimated Reading Time: 2 minutes
Don’t invest unless you’re prepared to lose all the money you invest. This is a high-risk investment and you are unlikely to be protected if something goes wrong. Take 2 minutes to learn more
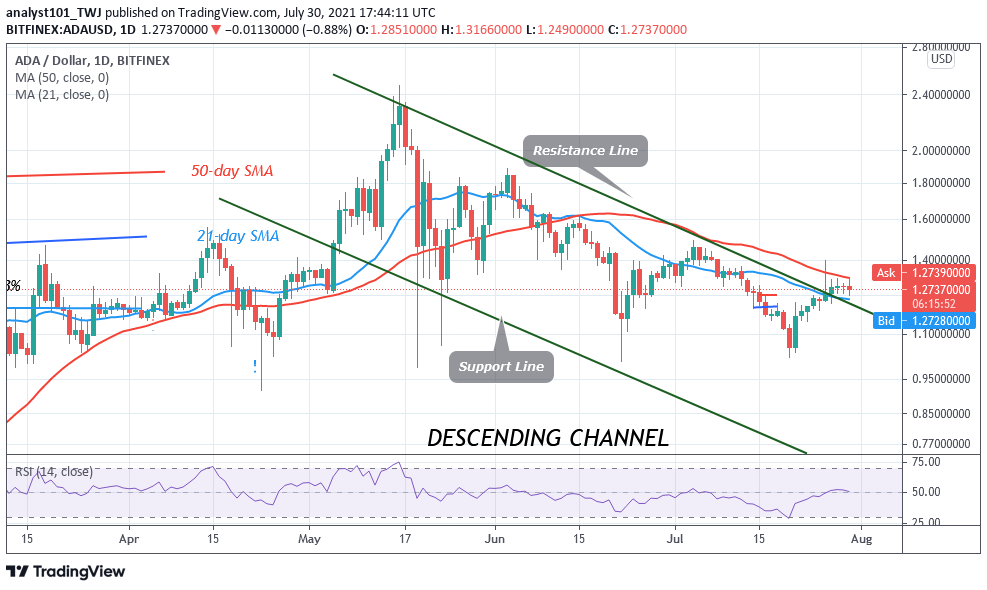
Cardano (ADA) Long-Term Analysis: Bearish
Following the July 26 uptrend, Cardano fell to $1.20 low and resumed consolidation below $1.30 High. For the past five days, ADA’s price has been stuck below the $1.30 high. The crypto is now fluctuating between $1.20 and $1.30 price levels. On the upside, if the price rebounds above the $1.20 support, the bullish momentum will clear the $1.30 and $1.40 resistance levels. Nonetheless, if buyers are successful, the ADA price will rally to either $1.60 or $1.85 high. Presently, ADA is falling as it faces rejection from the recent high. If the selling pressure persists ADA will slump to either $1.15 or $1.0. Today, the price has retraced to the support above the 50-day SMA.
Cardano (ADA) Indicator Analysis
The crypto is at level 50 of the Relative Strength Index period 14. It indicates that there is a balance between supply and demand. The uptrend is likely to continue as price breaks and closes above the resistance line of the descending channel. The 21-day SMA and the 50-day SMA are sloping downward indicating the downtrend.
Technical indicators:
Major supply zones: $2.0, $2.20, $2.40
Major demand zones: $1.40, $1.20, $1.00
What Is the Next Direction for Cardano (ADA)?
Cardano’s price has resumed its upward move. The uptrend is facing rejection at the $1.40 high. Meanwhile, on July 26 uptrend; a retraced candle body tested the 61.8% Fibonacci retracement level. The retracement indicates that ADA is likely to rise to level 1.618 Fibonacci extension or level $1.6351.

You can purchase crypto coins here. Buy Token
Note: Cryptosignals.org is not a financial advisor. Do your research before investing your funds in any financial asset or presented product or event. We are not responsible for your investing results