Cardano (ADA) Faces Strong Resistance at $0.3836
Estimated Reading Time: 3 minutes
Don’t invest unless you’re prepared to lose all the money you invest. This is a high-risk investment and you are unlikely to be protected if something goes wrong. Take 2 minutes to learn more
Cardano Long-term Analysis: Bearish
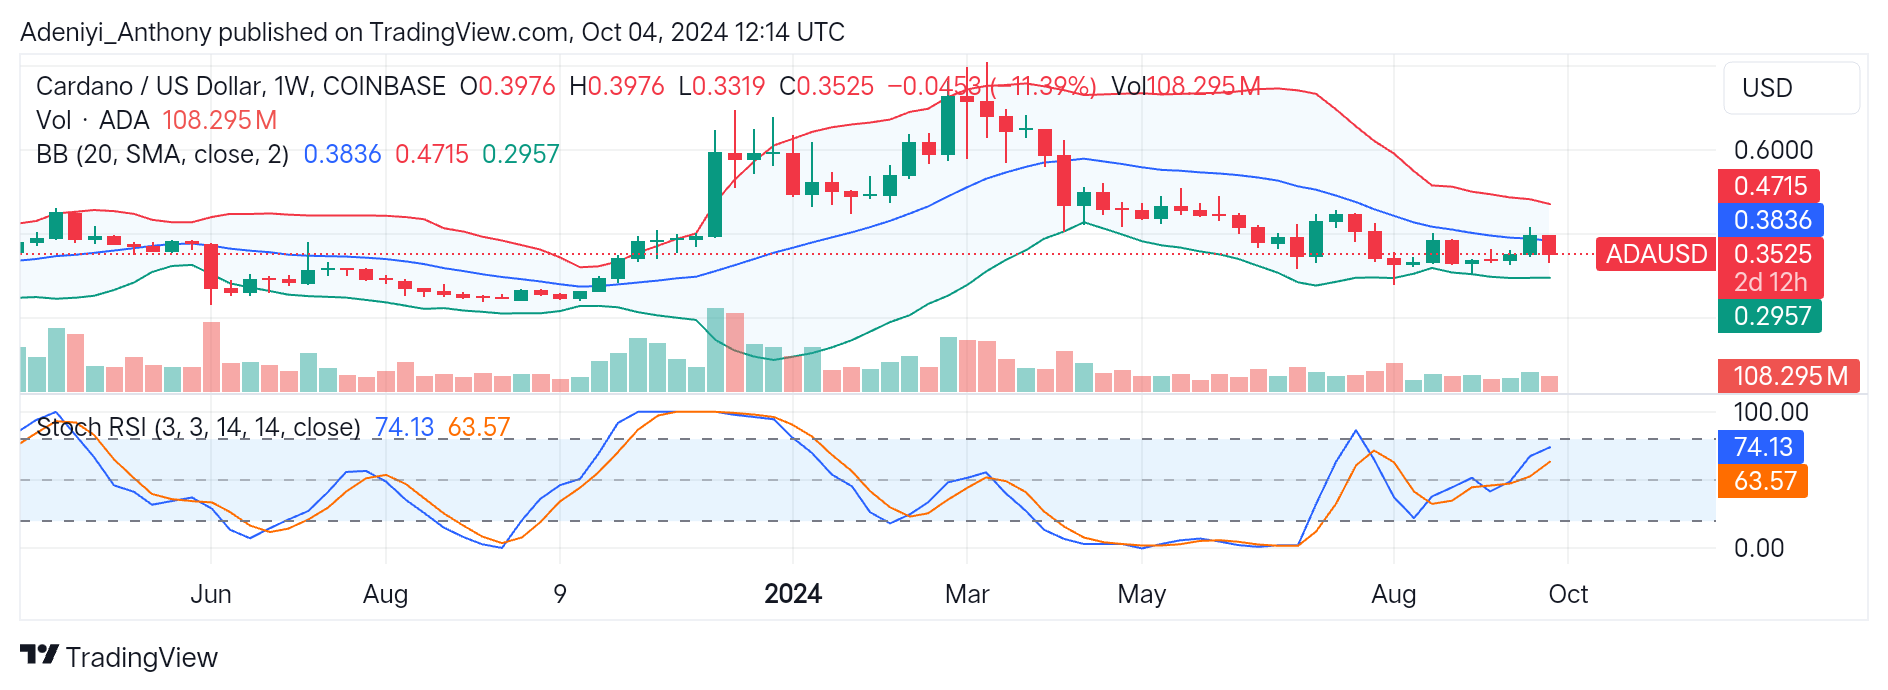
In a recent price movement, Cardano sought to break above $0.3836 but found strong resistance. ADA/USD current price movement shows the pair recently tested the lower band of the Bollinger bands at $0.2957. This level acted as a strong support, and enough buying pressure pushed the price to the middle band. However, the pair did not test the $0.3836 level for long as it is now heading south due to the selling activities taking place.
The Stochastic Relative Strength Index (RSI) portrays ADA/USD with the potential to move up beyond the middle band, but the overbought condition on the horizon may change the situation of things. However, the Bollinger bands’ widening gap indicates the presence of high market volatility. A price rebound at or above $0.3836 needs more bullish strength to test other levels.
On the other hand, the continuation of bearish momentum is possible if the pair lacks bullish strength; this will cause the price to break the immediate dynamic support and $0.25 level.
Presently, the Cardano against the United States Dollar trades at $0.3525.
Technical Indicators
Major Resistance Levels: $0.3836, $0.4715, and $0.600
Major Support Levels: $0.3319, $0.2957, and $0.2500
Cardano Technical Indicator Analysis
The recent Cardano price actions between the lower half of the Bollinger Bands present the overall bearish sentiment for ADA/USD. However, $0.4715 becomes a new target for the pair if the bullish traders take the market above the $0.3836 line such that it becomes a new support level. Otherwise, the downtrend continues.
On the other hand, the Stochastic RSI suggests the pair is in the overbought territory, yet traders await a signal for correction to the downside.
Cardano’s Direction: Where From Here?
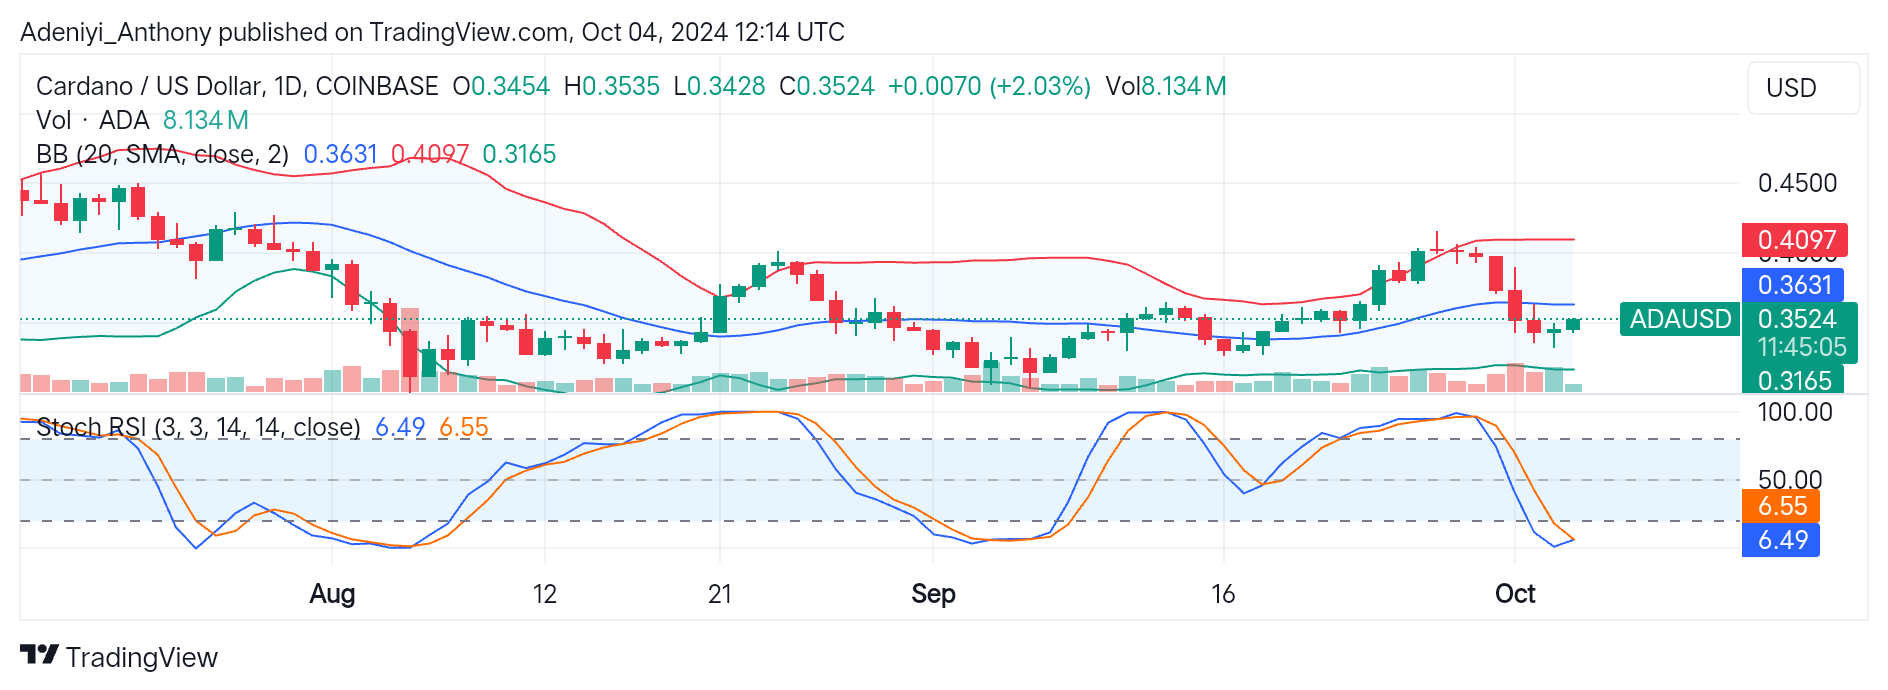
Cardano (ADA) against the United States dollar (USD) on the daily chart is trading at $0.3524 above the lower Bollinger band. This is an indication that the pair is still in the bearish zone. However, a break above the $0.3631 and a recovery towards the upper band are possible.
On the downside of the chart, the Stochastic RSI signals an oversold condition. This often leads to a short-term price correction. However, the crossover of the oscillator’s lines could signal the beginning of an upward trajectory.
You can purchase crypto coins here. Buy LBlock