Cardano Drops as It Faces a Price Cap of $0.25
Estimated Reading Time: 2 minutes
Don’t invest unless you’re prepared to lose all the money you invest. This is a high-risk investment and you are unlikely to be protected if something goes wrong. Take 2 minutes to learn more

Cardano (ADA) Price Long-Term Forecast: Bearish
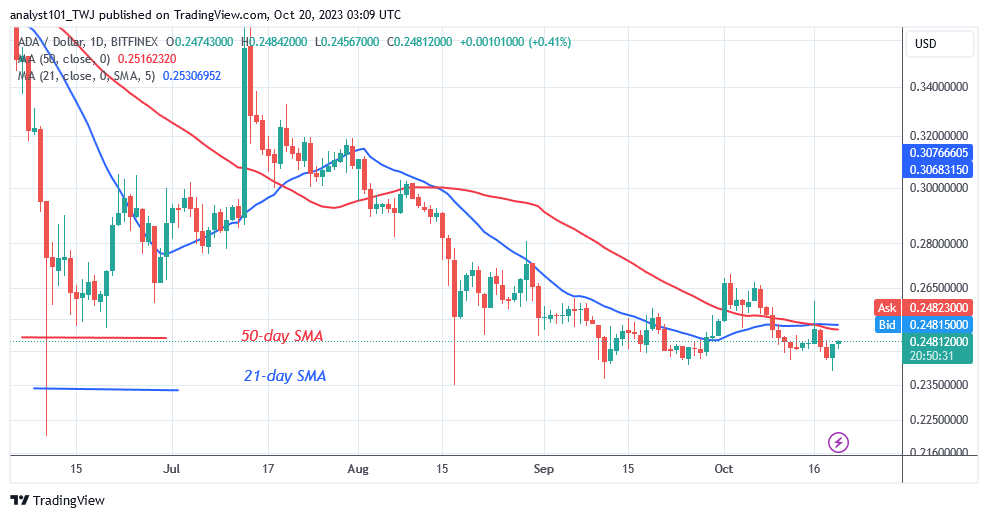
The cost of Cardano (ADA), which dropped on October 12, is already rising again as it faces a price cap of $0.25. Cardano has been restricted to a new price range for the past week. Following a price rebound on October 16, the coin dropped even further. The altcoin initially bounced back and broke above the moving average lines, but it was rejected.
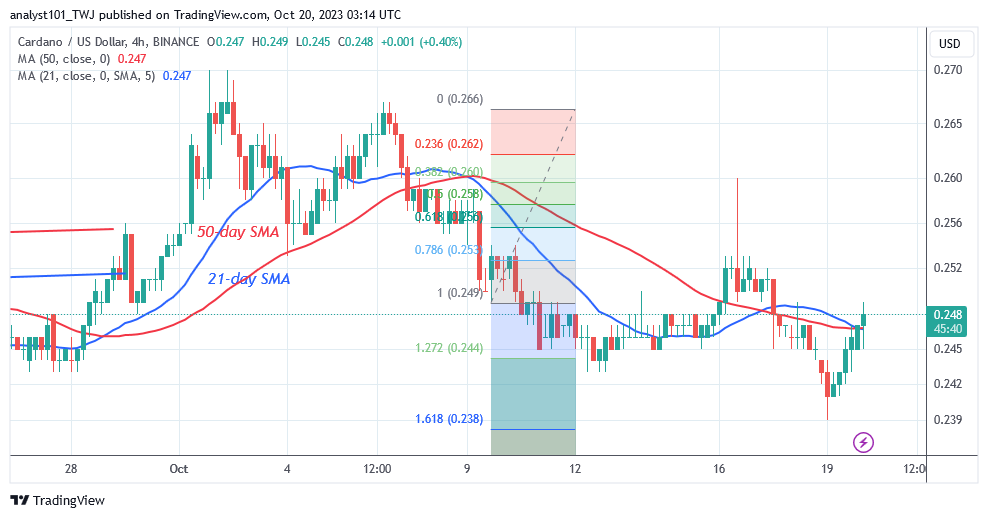
ADA’s price dropped to a low of $0.2390 as bulls purchased the dips. The coin is rising, but its gains are limited by the moving average lines or the $0.26 barrier. Cardano is now trading between $0.23 and $0.25 per token.
Technical Indicators:
Major supply zones: $1.0, $1.05, $1.10
Major demand zones: $0.25, $0.20, $0.15
Cardano (ADA) Indicator Analysis
The crypto price twice crossed above the lines of the moving average, but it was rejected both times. The price bars subsequently dipped below the moving average lines. The implication is that Cardano will fall in value. The ADA price has dropped to the August 17 price level, but bulls have bought the dip.
What Is the Next Move for Cardano (ADA)?
Cardano’s value dropped to its prior low on August 17 as it faced a price cap of $0.25. The pricing range has been restricted to $0.23 and $0.25. The uptrend is approaching the moving average lines, or resistance at $0.26. The moving average lines are currently impeding the upward movement. This could result in a price rebound or breakdown.
You can purchase crypto coins here. Buy LBLOCK
Note: Cryptosignals.org is not a financial advisor. Do your research before investing your funds in any financial asset or presented product or event. We are not responsible for your investing results