Cardano Holds Above $0.43 as It Nears a Breakout or Breakdown
Estimated Reading Time: 2 minutes
Don’t invest unless you’re prepared to lose all the money you invest. This is a high-risk investment and you are unlikely to be protected if something goes wrong. Take 2 minutes to learn more

Cardano (ADA) Price Long-Term Forecast: Bearish
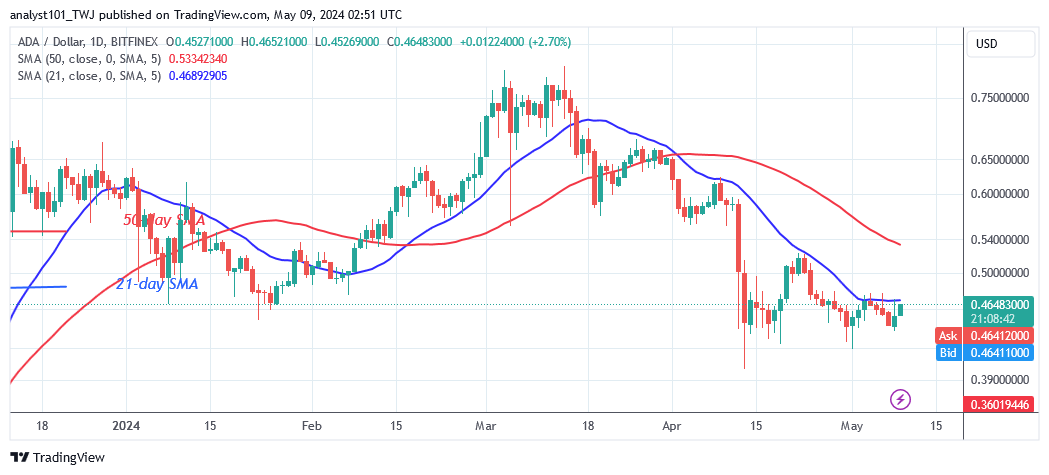
Cardano (ADA) price remains in a range above $0.43 support as it nears a breakout or breakdown. The 21-day SMA, or resistance at $0.47, has slowed the upward trend. Doji candlesticks have limited the amount of price movement. On May 1, the ADA price fell to a low of $0.41, yet bulls bought the dips but were unable to keep it above the 21-day SMA.
Cardano’s price hovers between $0.43 and $0.47. There will be a price breakout or breakdown for the coin soon. The exchange rate between ADA and USD at the time of writing is $0.464.
Technical Indicators:
Major supply zones: $1.0, $1.05, $1.10
Major demand zones: $0.25, $0.20, $0.15
Cardano (ADA) Indicator Analysis
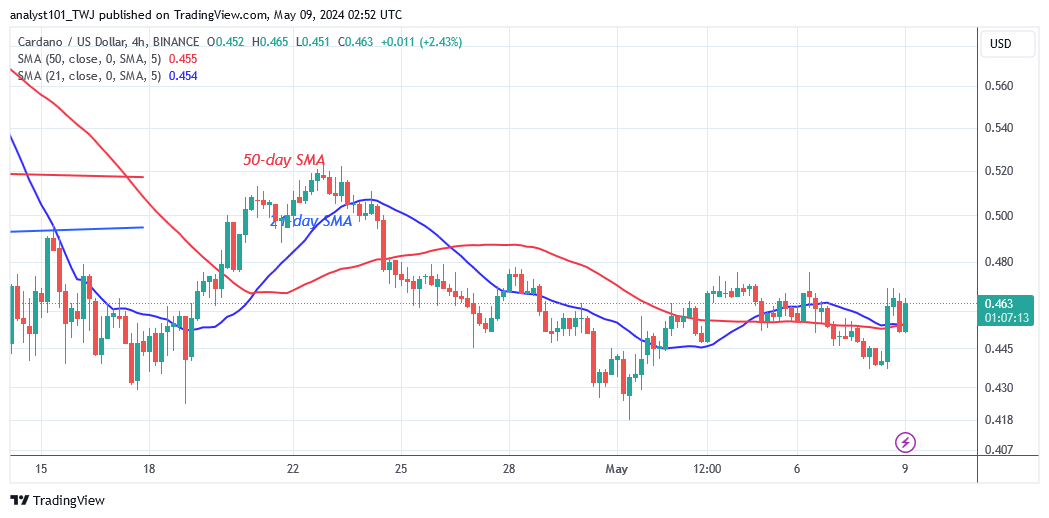
The moving average lines slope southward, as does the 21-day SMA, which serves as a resistance line. The bulls retested the 21-day SMA resistance level four times but were unable to gain bullish momentum. However, the moving average lines are sloping horizontally, indicating a sideways trend following the April 13 price drop on the 4-hour chart.
What Is the Next Move for Cardano (ADA)?
Cardano is now trading in a tight range of $0.43 to $0.48 as it nears a breakout or breakdown. Doji candlesticks, with their small bodies and indecisive nature, dominate price activity. The price fluctuation is gradual and influenced by the Doji candlesticks. The cryptocurrency signal has fluctuated since April 13, 2024.
You can purchase Lucky Block here. Buy LBLOCK
Note: Cryptosignals.org is not a financial advisor. Do your research before investing your funds in any financial asset or presented product or event. We are not responsible for your investing results