Cardano Retraces above $0.31 as It Hovers and Resumes Its Sideways Move
Estimated Reading Time: 2 minutes
Don’t invest unless you’re prepared to lose all the money you invest. This is a high-risk investment and you are unlikely to be protected if something goes wrong. Take 2 minutes to learn more
Cardano (ADA) Price Long-Term Forecast: Bearish
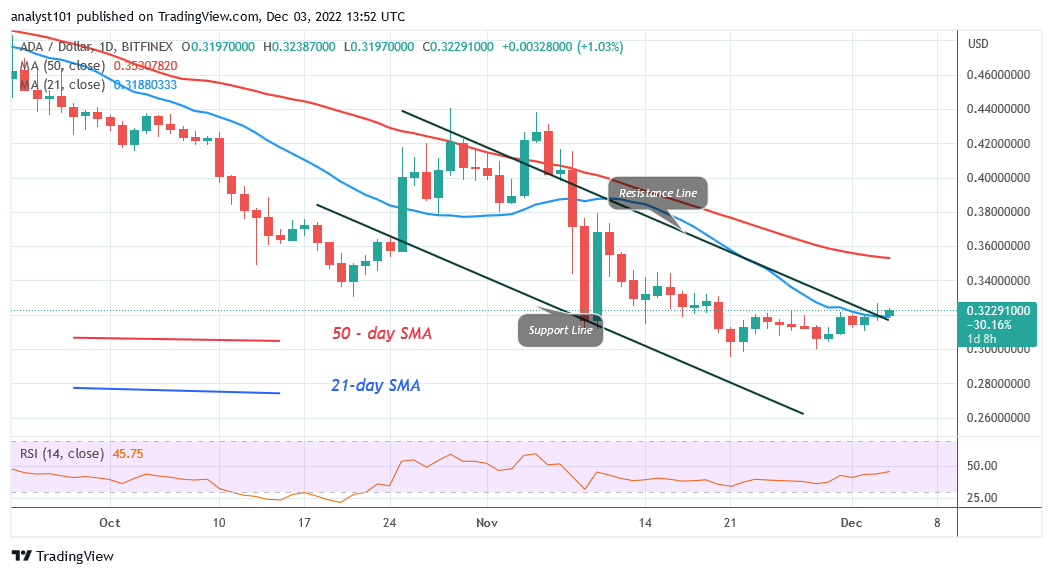
Cardano’s (ADA) price has remained above the 21-day line as it hovers and resumes its sideways move. The crypto’s price is presently trading in the overbought region of the market. The breaking of the 21-day line SMA will signal the resumption of the downtrend. Presently, ADA has retraced above the current support at $0.31 or the 21-day line SMA. Holding above these resistance levels will quicken the coin’s sideways movement. If the resistance at $0.32 is broken, Cardano will surge above the 50-day SMA. If the bullish scenario fails, ADA will retrace and range-bound between the moving average lines.
Cardano (ADA) Indicator Analysis
For Period 14, Cardano is at a Relative Strength Index level of 45. It is continuing to decline and is in a zone of a downward trend. Given that the price bars are positioned in between the moving average lines, ADA is range-bound. ADA is experiencing a bullish momentum above the daily Stochastic level of 70.
Technical indicators:
Major supply zones: $1.0, $1..05, $1.10
Major demand zones: $0.45, $0.40, $0.35
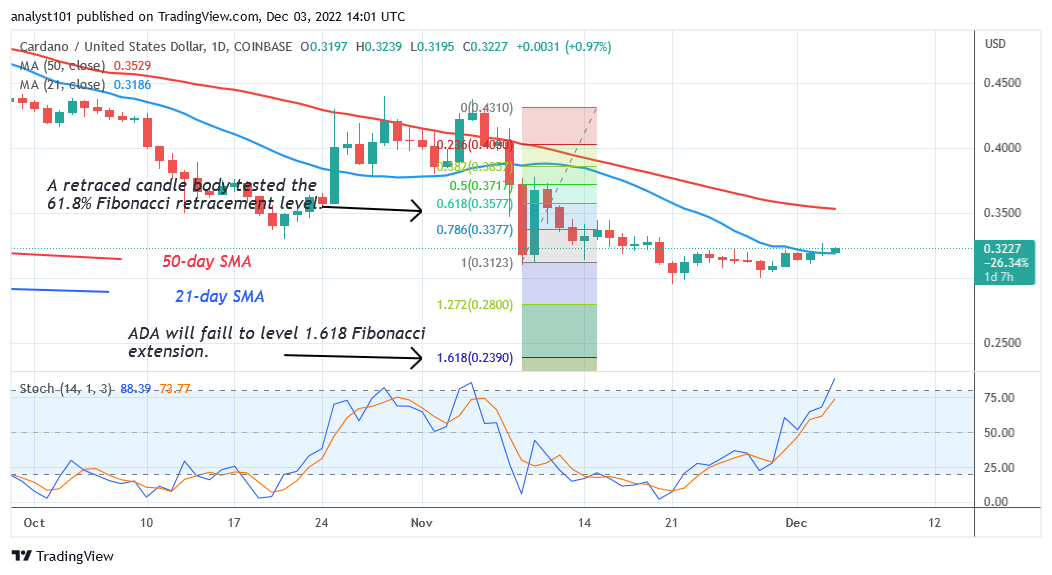
What Is the Next Move for Cardano (ADA)?
Cardano is circling above the 21-day SMA as it hovers and resumes its sideways move. The pressure to sell has decreased. The price of the cryptocurrency is trying to increase to the overbought area of the market. If the current support is maintained, the range-bound move will continue. If the current support is broken, the price of ADA will fall to $0.23 or $0.19.
You can purchase crypto coins here. Buy LBLOCK
Note: Cryptosignals.org is not a financial advisor. Do your research before investing your funds in any financial asset or presented product or event. We are not responsible for your investing results