ApeCoin (APEUSD) Shows Bullish Divergence According to RSI
Estimated Reading Time: 2 minutes
Don’t invest unless you’re prepared to lose all the money you invest. This is a high-risk investment and you are unlikely to be protected if something goes wrong. Take 2 minutes to learn more
APEUSD Analysis: RSI Indicates Bullish Divergence in ApeCoin (APEUSD)
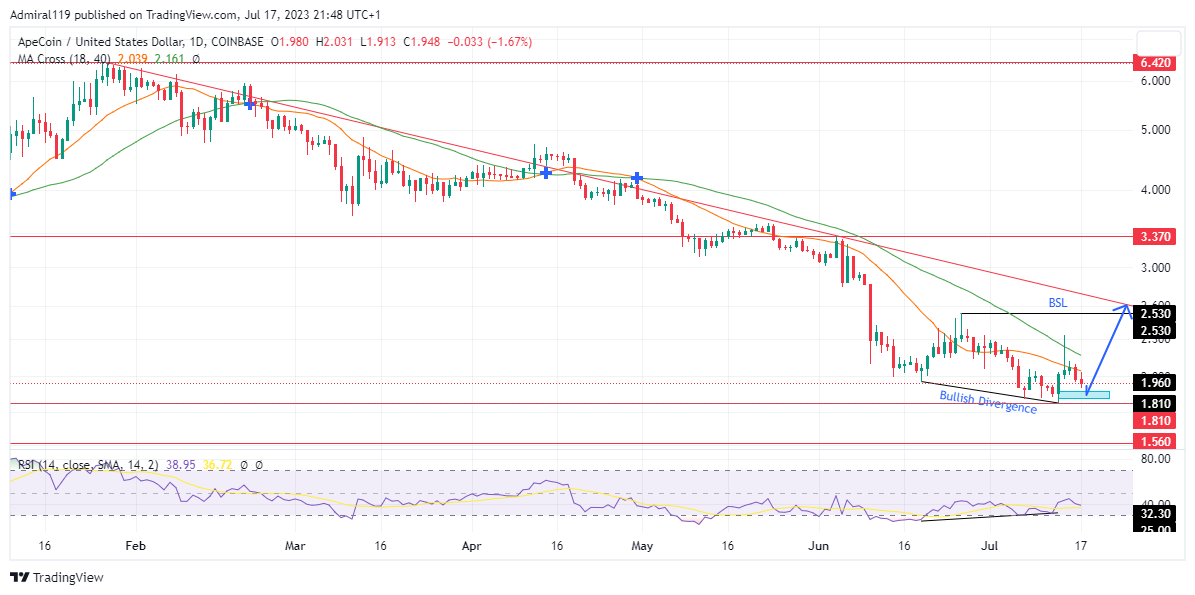
APEUSD shows signs of bullish divergence according to the RSI. The RSI (Relative Strength Index) is set to face upward as the price recovers from an oversold state. The market’s order flow has been bearish as the APEUSD buyers lose complete interest in causing a significant rally. However, the RSI has indicated a divergence as it creates higher lows against the price.
APEUSD Significant Zones
Demand Zones: $1.810, $1.560
Supply Zones: $3.370, $6.420

The downtrend began in January 2023 in response to the triggered sell orders at the $6.420 supply zone. Since the downtrend began, APEUSD has remained under the control of the bears, as indicated by the MA Cross. While the downtrend continued, the APEUSD buyers completely exited the market. This caused a massive decline, as the price barely created a significant bullish expansion. Since the second week of May 2023, the RSI indicator has been below the 50.0 level.
This indicates the overwhelming dominance of the bears, as they refuse to halt the selling process. While the market’s structure is still bearish, a bullish divergence was signalled by the RSI. This resulted from the divergence between the price’s movement and the RSI’s movement. Recently, the RSI formed a higher low, while a lower low formed in the price’s move. As it appears, APEUSD is likely to experience a significant rally for the first time in about six months.

Market Expectation
On the four-hour chart, APEUSD is heading into the premium zone. The four-hour bullish order block will likely cause the expected expansion, thereby invalidating the previous high of $2.530.
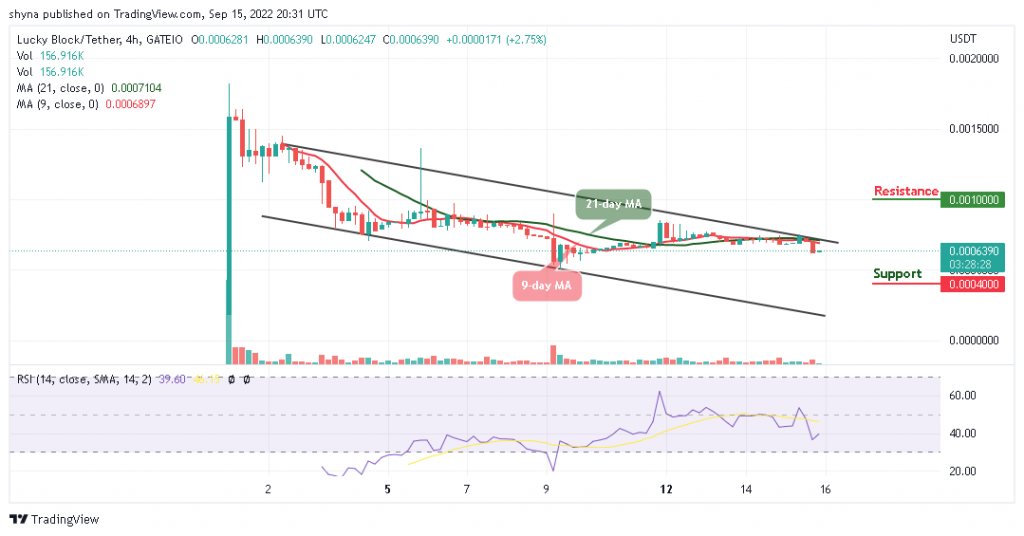
How To Buy Lucky Block
Note: Cryptosignals.org is not a financial advisor. Do your research before investing your funds in any financial asset or presented product or event. We are not responsible for your investing results.