Bitcoin Cash (BCH/USD) Gains Momentum as It Challenges Key $450 Resistance
Estimated Reading Time: 3 minutes
Don’t invest unless you’re prepared to lose all the money you invest. This is a high-risk investment and you are unlikely to be protected if something goes wrong. Take 2 minutes to learn more
The Bitcoin Cash market has sustained a bullish posture despite facing persistent resistance near the $450 level since early May. During this period, a stable trading range has formed between $400 (support) and $450 (resistance), creating a well-defined horizontal price channel.
Recent price action reveals strengthening bullish momentum, with BCH forming a higher low near $430—a clear indication of buyer conviction as the asset approaches its key resistance. This pattern suggests increasing pressure on bears defending the $450 level, potentially setting the stage for a breakout if buying pressure persists.
A decisive close above $450 could confirm bullish dominance and open the path toward higher price targets, while rejection at this level may extend the current consolidation phase. Traders should monitor volume trends and broader market sentiment for confirmation of the next directional move.
Bitcoin Cash Market Data
- BCH/USD Price Now: $428
- BCH/USD Market Cap: $8.5 billion
- BCH/USD Circulating Supply: 19.9 million BCH
- BCH/USD Total Supply: 19.9 million BCH
- BCH/USD CoinMarketCap Ranking: #16
Key Levels
- Resistance: $450, $500, and $550
- Support: $420, $400 and $350
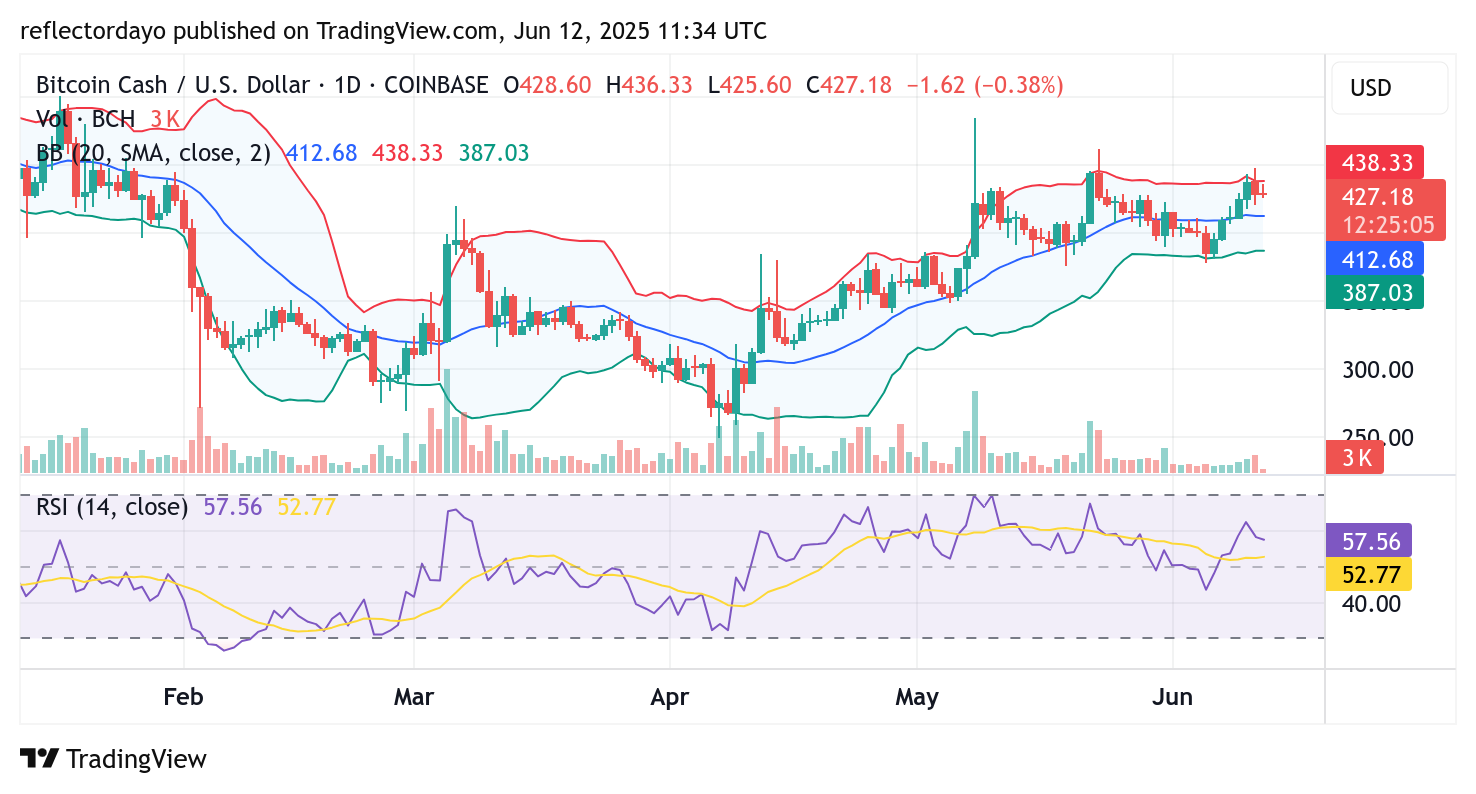
Bitcoin Cash Technical Analysis: Bullish Momentum Builds as Key Resistance is Tested
Recent price action shows Bitcoin Cash (BCH/USD) rallying toward the $450 resistance level, where it faced another rejection—consistent with previous attempts. However, bearish momentum appears to be weakening, as evidenced by the formation of a higher support level near $430. Over the past few trading sessions, sellers have been unable to push the price significantly below this level, reinforcing bullish defense.
If buyers maintain control around $430, technical conditions may favor an upward resolution. The Bollinger Bands are showing signs of convergence, with the lower band rising to meet price action—a development that could lead to the formation of an ascending wedge pattern. Such a structure often precedes a breakout, suggesting that a decisive move above $450 could trigger further upside momentum.
Traders should monitor whether the crypto signal holds above $430 while watching for a confirmed breakout above $450, which would signal a potential continuation of the bullish trend.
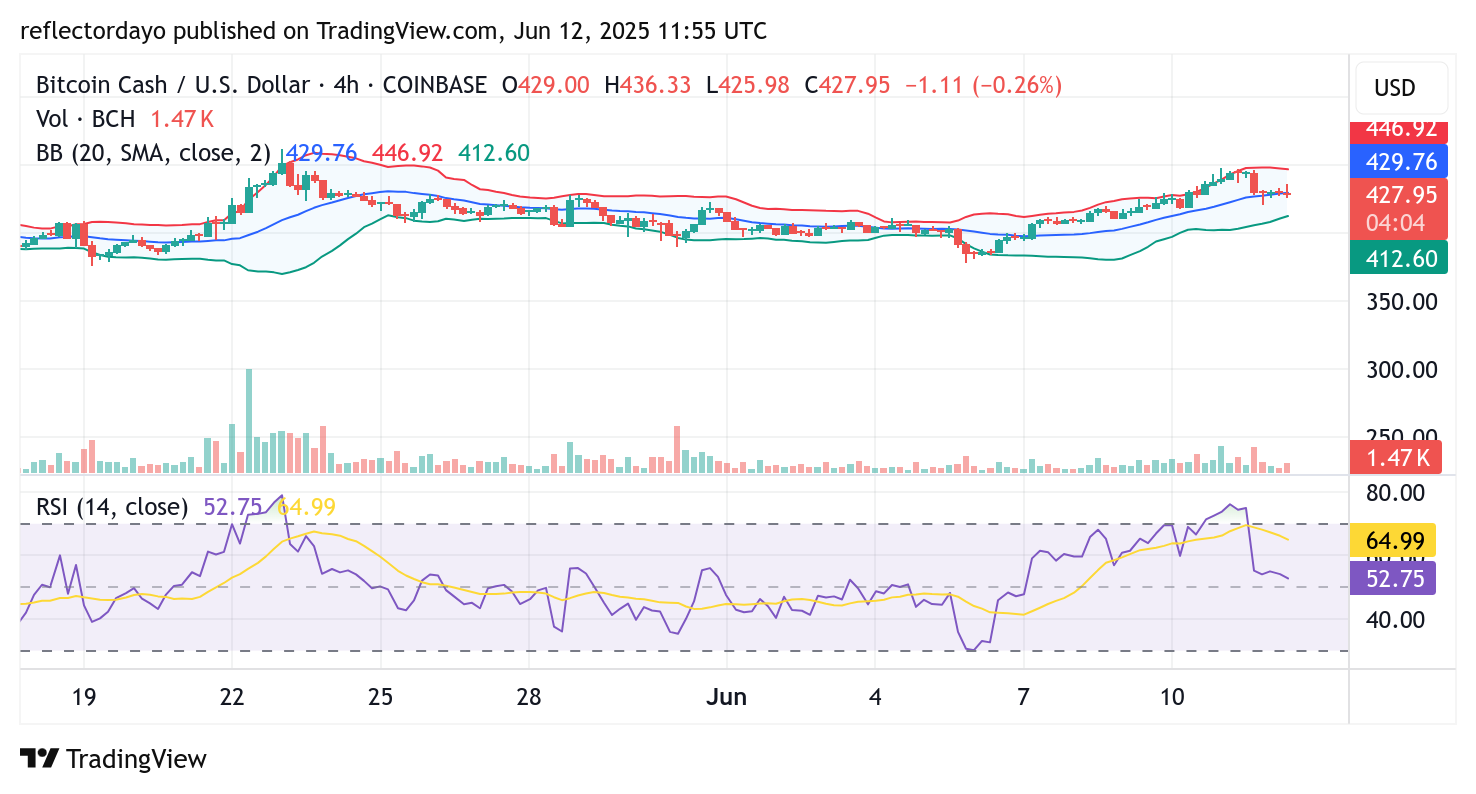
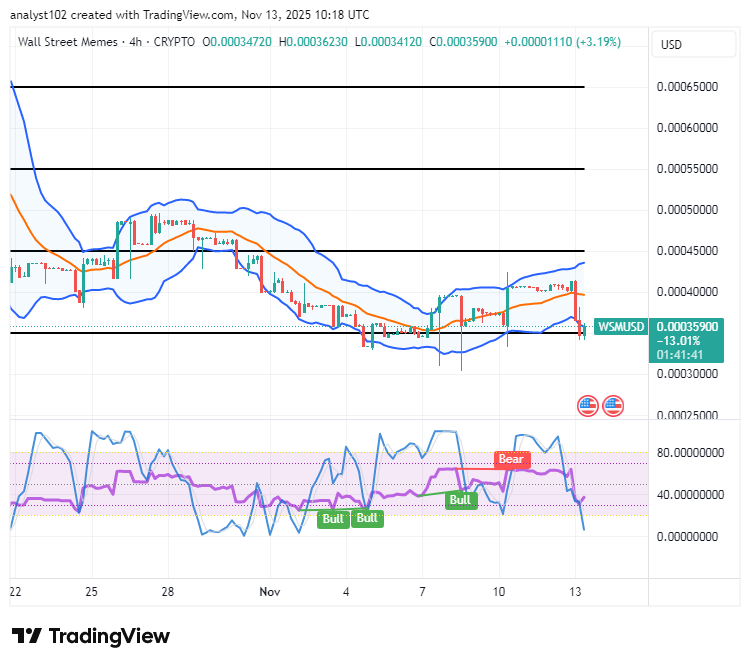
BCH/USD 4-Hour Chart: Overbought Conditions Subside as Market Consolidates
The 4-hour chart shows BCH/USD stabilizing near equilibrium, with Bollinger Bands indicating subdued volatility. Price action remains contested around the $428–$430 zone, where bulls and bears continue to battle for control. A decisive breakdown below this level could shift momentum bearishly, potentially testing the next key support at $400.
While the near-term outlook appears balanced, traders are maintaining cautious optimism. A sustained move above the mid-$400s could renew bullish momentum, whereas failure to hold current levels may invite deeper downside pressure. For now, market participants remain focused on the $428–$430 pivot as a critical determinant of BCH’s next directional move.