Fantom (FTM/USD) Surges Past $1.00 Price Threshold
Estimated Reading Time: 3 minutes
Don’t invest unless you’re prepared to lose all the money you invest. This is a high-risk investment and you are unlikely to be protected if something goes wrong. Take 2 minutes to learn more
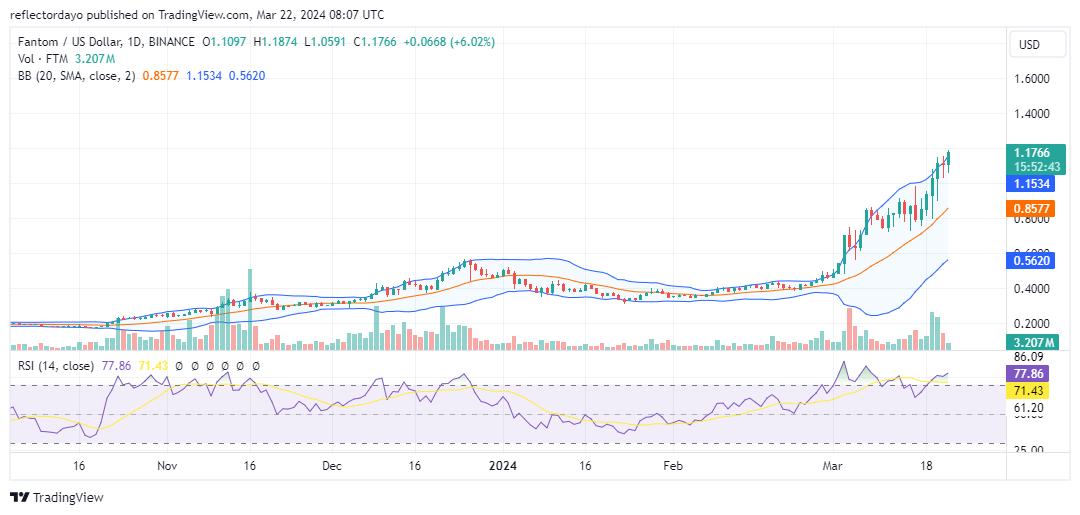
Following the divergence of the Fantom Market from the $0.30 consolidation, it encountered a significant resistance point at approximately $0.80. Over the course of approximately ten days, market sentiment oscillated as both bullish and bearish forces grappled for dominance around this threshold. However, on March 17, momentum decisively shifted in favor of the bulls, marking the onset of a bullish breakout. This surge exhibited notable upward momentum, propelling the market confidently past the $1.00 price level.
Fantom Market Data
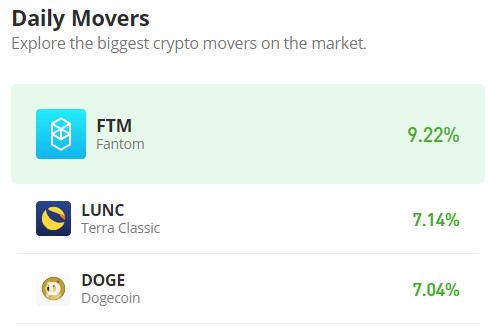
- FTM/USD Price Now: $1.177
- FTM/USD Market Cap: $2.6 billion
- FTM/USD Circulating Supply: 2.8 billion
- FTM/USD Total Supply: 3.2 billion
- FTM/USD CoinMarketCap Ranking: #46
Key Levels
- Resistance: $1.00, $1.50, and $2.00.
- Support: $0.85, $0.80, and $0.75.
Fantom Market Analysis: The Indicators’ Point of View
During a ten-day period of consolidation around the $0.80 price level, the market retained its volatility, while the dominance of bulls persisted. This likely facilitated their ability to breach the $1.00 price threshold with relative ease. Furthermore, the market’s upward momentum remains evident, with indications pointing towards a progression towards the $1.20 price threshold.
However, amidst these market dynamics, a decline in trading volume is observed, despite today’s trading activity displaying a strong bullish crypto signal. Traders and analysts may be considering the current overbought condition of the market, as reflected by the Relative Strength Index (RSI), prompting cautiousness as the price nears $1.20.
Nevertheless, should the Fantom market fail to surpass the $1.20 price threshold, it has established $1.150 as a crucial support level, which could serve as a pivotal point for the continuation of the bullish trend.
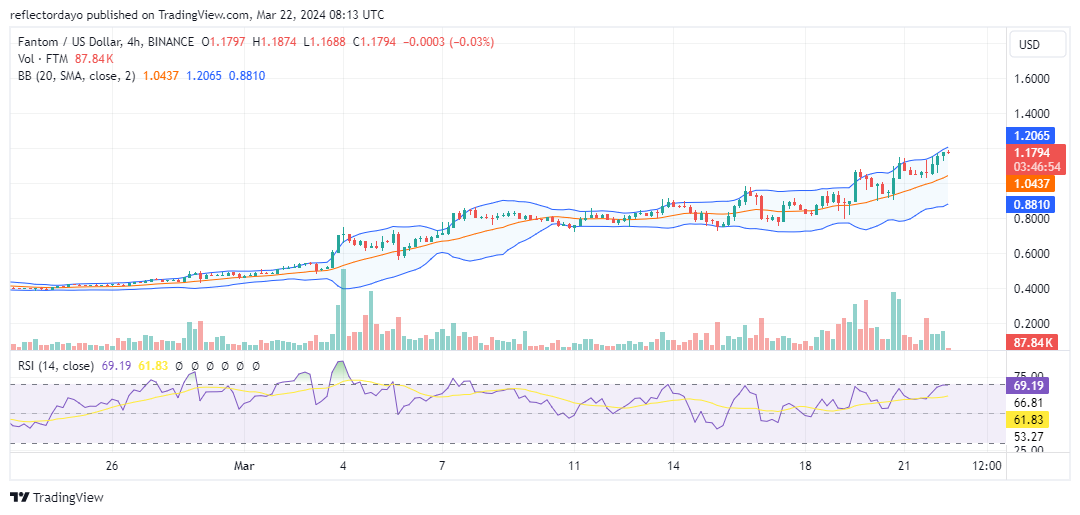
FTM/USD 4-Hour Chart Outlook
Analyzing the market through the 4-hour chart, despite a slight pullback as it approaches the $1.20 price level, bullish sentiment appears to persist. While the current 4-hour session indicates a minor retracement as the market nears the resistance level, similar occurrences in recent sessions suggest that this bearish activity may be short-lived, potentially paving the way for the continuation of the bullish trend.