How to Read Crypto Market Structure: Higher Highs, Lower Lows and Trend Shifts
Estimated Reading Time: 3 minutes
Don’t invest unless you’re prepared to lose all the money you invest. This is a high-risk investment and you are unlikely to be protected if something goes wrong. Take 2 minutes to learn more

Market structure is the basic language of price action. Before adding indicators, traders should understand whether a coin is trending up, trending down, or moving sideways. The easiest way to do that is by reading highs and lows.
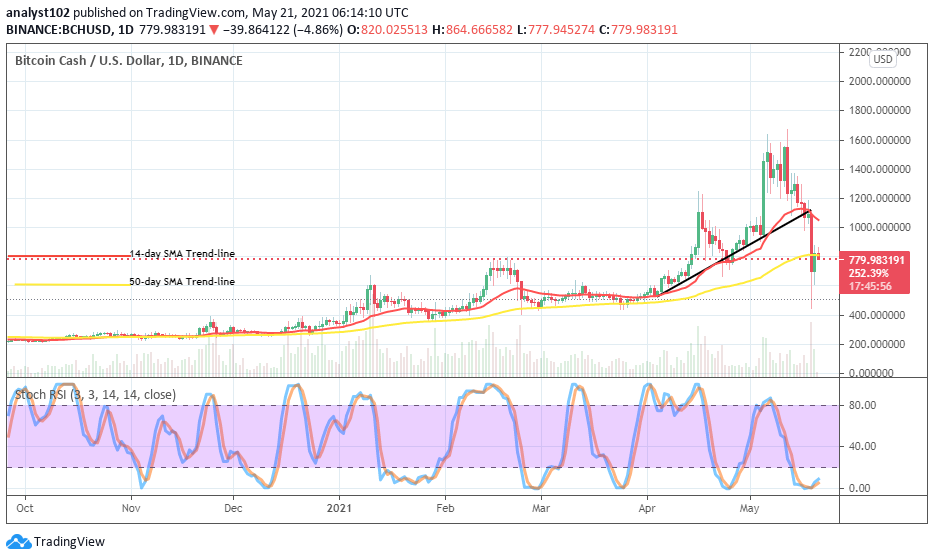
An uptrend usually forms higher highs and higher lows. Price pushes to a new high, pulls back, but holds above the previous low before continuing. That pattern shows buyers are stepping in earlier and accepting higher prices. In crypto, strong uptrends often move quickly, so waiting for pullbacks can help avoid buying into emotional spikes.
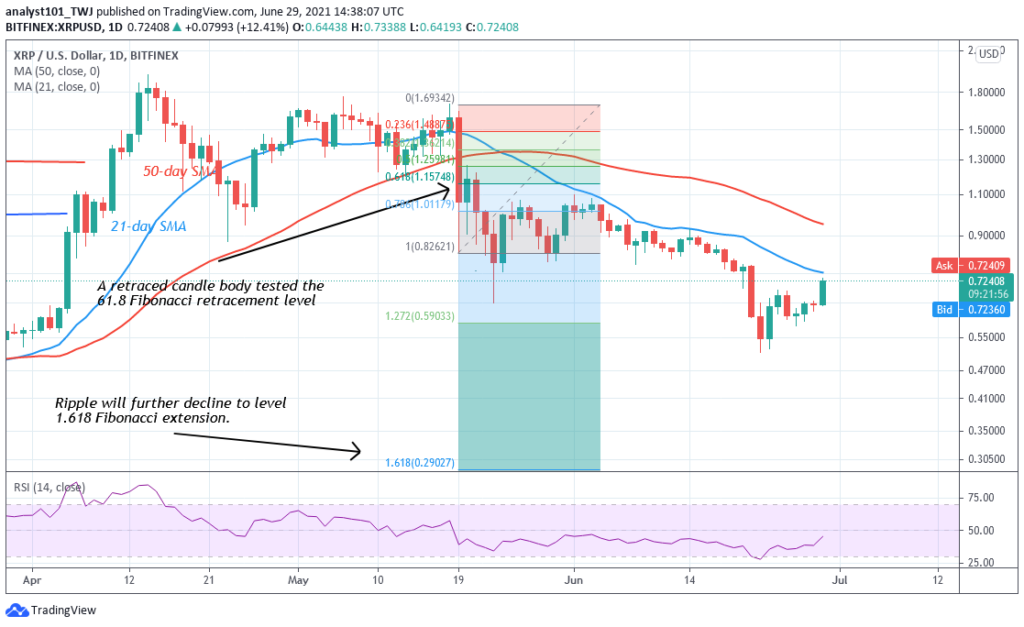
A downtrend usually forms lower highs and lower lows. Each bounce fails below the previous high, and sellers push price to new lows. In that environment, long trades become harder because rallies are often sold. Beginners frequently lose money by treating every drop as a bargain without checking whether the structure has actually changed.
 Most Popular
- 2-5 Signals Daily
- 82% Success Rate
- Entry, Take Profit & Stop Loss
- Amount To Risk Per Trade
- Risk Reward Ratio


A sideways market forms overlapping highs and lows. Price may bounce between support and resistance without a clear direction. These conditions can frustrate trend-following traders because breakouts often fail. In a range, patience matters. The best trades usually come near the edges of the range, not in the middle.
A market structure shift happens when the previous pattern breaks. For example, in a downtrend, price may stop making lower lows, reclaim a previous lower high, and then hold a higher low. That does not guarantee a new bull trend, but it shows sellers may be losing control.
Traders can improve structure reading by using multiple timeframes. A coin may look bullish on a 15-minute chart but bearish on the daily chart. Short-term traders can still trade smaller moves, but they should know whether they are trading with or against the bigger trend.

Free Crypto Signals Channel
 Free Telegram Channel
Volume can also confirm structure. A breakout with strong volume is more convincing than a breakout on weak activity. A breakdown with rising volume shows sellers are active, while a low-volume dip may simply be a pullback.
Key takeaway:
Market structure helps traders avoid guessing. Higher highs and higher lows favour buyers. Lower highs and lower lows favour sellers. Sideways structure calls for patience.
Educational content only. Not financial advice. DYOR.