$SPONGE (SPONGE/USD) Bulls Dig In Their Heels As Volatility Rises
Estimated Reading Time: 3 minutes
Don’t invest unless you’re prepared to lose all the money you invest. This is a high-risk investment and you are unlikely to be protected if something goes wrong. Take 2 minutes to learn more

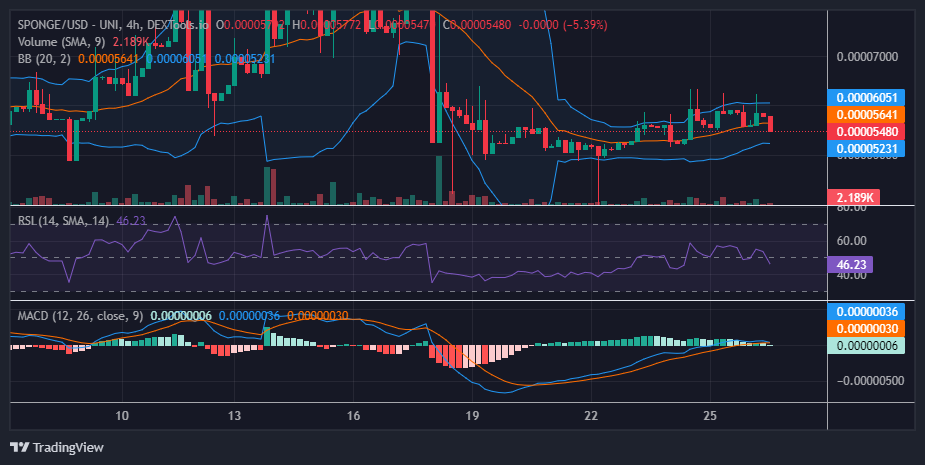
Following the $SPONGE market’s breakthrough above the $0.00005 price threshold and its 20-day moving average, it has consistently established incrementally higher lows, reinforcing the current bullish trend. However, as the market approaches the $0.00006 price level, volatility has surged as both bullish and bearish participants closely monitor this critical level. Despite this heightened volatility, bearish price movements have predominated around the equilibrium level.
Key Market Dynamics:
- Resistance Levels: $0.0010, $0.0011, and $0.0012.
- Support Levels: $0.000035, $0.000030, and $0.000025.
Delving into Technical Analysis for $SPONGE (SPONGE/USD):
As bearish activities precipitated by the $0.00006 price threshold exert downward pressure on the market, it appears that the price has stabilized around $0.0000548, potentially indicative of bullish intervention at this level. Analysis of both the Relative Strength Index and the Moving Average Convergence and Divergence indicators suggests that the market is currently at an equilibrium point. According to this crypto signal, it is plausible that the price may encounter support at the confluence of the 20-day moving average and the RSI midpoint, potentially prompting a reversal in direction to retest key resistance levels. Such a scenario could signal a continuation of the prevailing uptrend.
Insights from the 1-Hour Perspective:
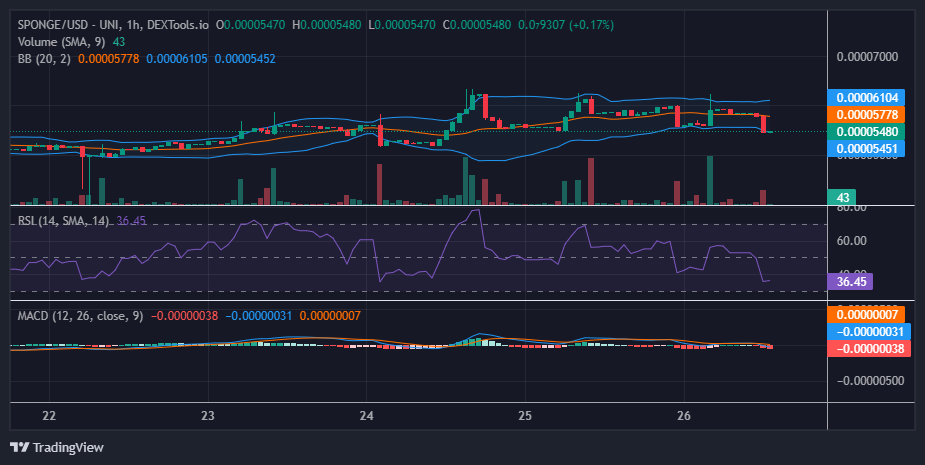
In the 1-hour chart analysis of the $SPONGE market, bearish price action has encountered significant support near $0.0000548, indicating a potential halt to further bearish momentum. This observation is bolstered by the formation of a four-price doji candlestick pattern following a robust Marubozu candlestick in the preceding 1-hour trading session. Such patterns suggest a period of indecision and hint at a potential trend reversal, with bulls poised to seize control, particularly given the significance of this support level.
As soon as you play the game and place on the leaderboard, you will receive $SPONGE tokens.
Don’t forget, #SPONGERS! 🧽💦#SpongeV2 is bringing exciting utility through our upcoming #P2E game! 🔥
Get ready to earn $SPONGE tokens by playing the game and ranking on the leaderboard.
Stay tuned for more info! 🚀#MemeCoin #Crypto #Alts #100x pic.twitter.com/5aaLxGz8N1
— $SPONGE (@spongeoneth) March 22, 2024
Invest in the hottest and best meme coin. Buy Sponge ($SPONGE) today!