Bancor (BNTUSD) Buyers Enter the Market as Price Leaves Discount Array
Estimated Reading Time: 2 minutes
Don’t invest unless you’re prepared to lose all the money you invest. This is a high-risk investment and you are unlikely to be protected if something goes wrong. Take 2 minutes to learn more
BNTUSD Analysis: Buyers Enter The Market As The Price Leaves The Discount Array
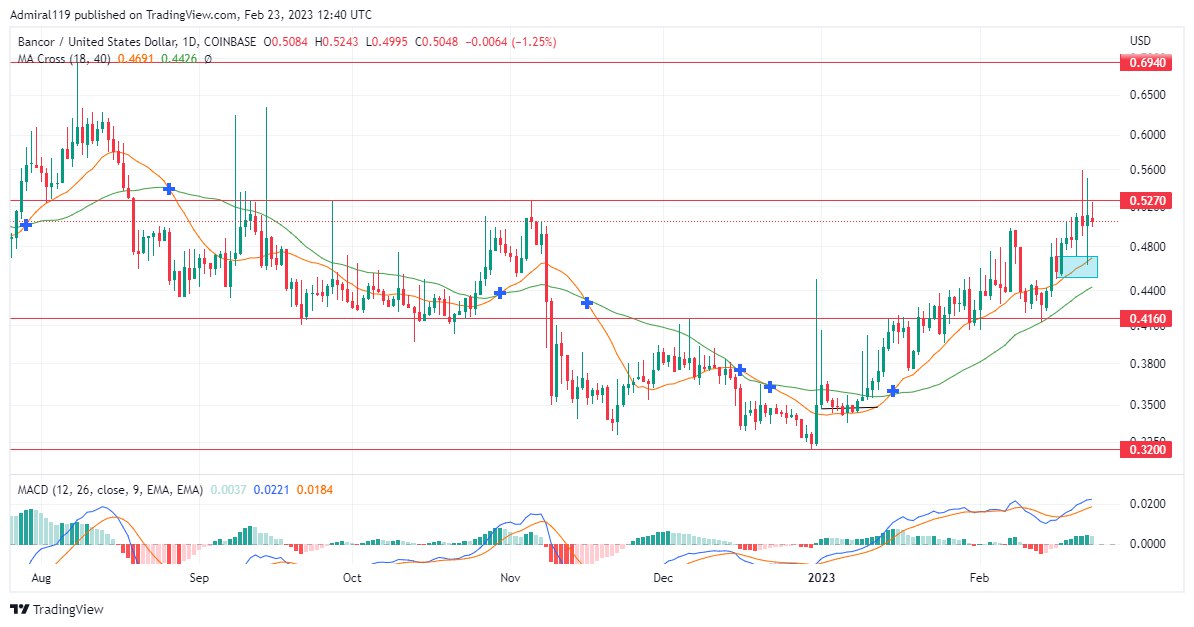
BNTUSD buyers enter the market as the price leaves the discount array. The market was bullish before the bounce off the discount array. The bullish trend started to develop at the beginning of the year, with the first day of the year ending with a bullish marubozu candlestick.
BNTUSD Significant Zones
Demand Zones: $0.4160, $0.3200
Supply Zones: $0.6940, $0.5270
BNTUSD has been rising after the price was rejected at the major support level of $0.3200. Before the price’s huge decline in value in November 2022, the price was initially consolidated between the $0.5270 and $0.4160 price levels. The market’s order flow was bearish, as indicated by the Moving Averages Cross, which indicates that the buyers were absent from the market until the $0.3200 significant support level was reached. BNTUSD touched the $0.3200 level on December 30, 2022, and turned bullish immediately.
The price reversed back towards the support after the significant rally to counteract the inefficiency. The buyers entered the market with their buy orders as a result of the price reaction in this area. The market was in the hands of the buyers, and a buy signal was made when the Moving Average Period 18 crossed the Moving Average Period 40. The MACD also indicates that the market is already bullish as it moves further away from the zero line.
Market Expectation
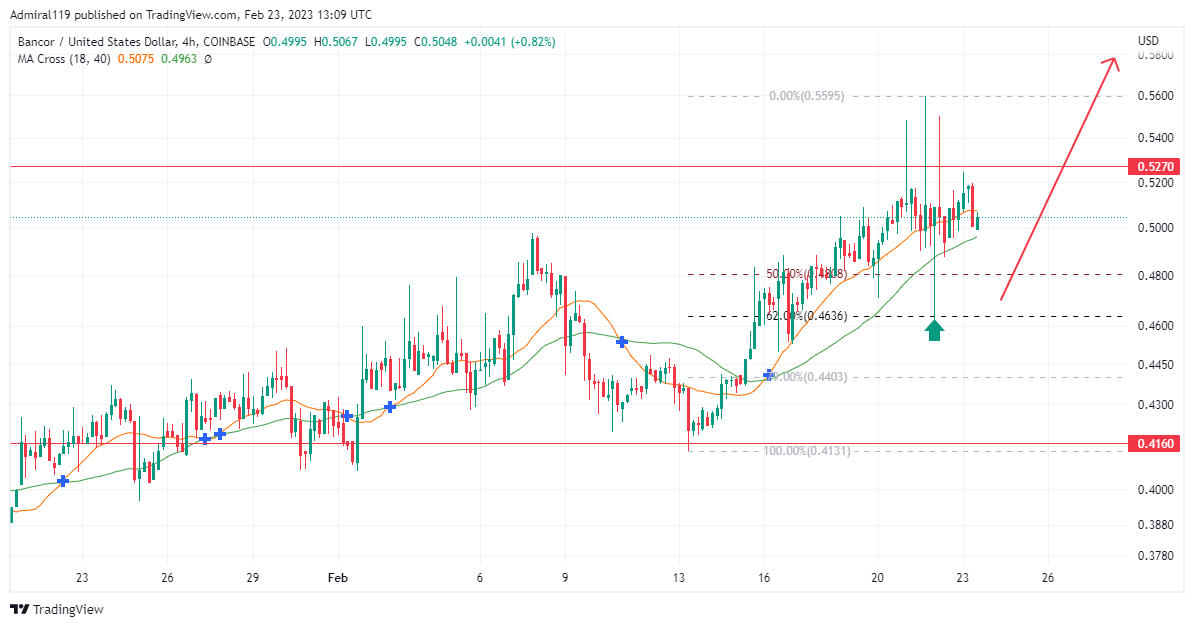
On the four-hour time frame chart, the market is fluctuating within the $0.55600 and the $0.44000 price levels. As the price approaches the 62.0% Fibonacci retracement level, BNTUSD is expected to continue rising to the upside as buyers resume entering the market with buy orders.
Note: Cryptosignals.org is not a financial advisor. Do your research before investing your funds in any financial asset or presented product or event. We are not responsible for your investing results.