Bancor (BNTUSD) Continues to Crash in a Falling Wedge
Estimated Reading Time: 2 minutes
Don’t invest unless you’re prepared to lose all the money you invest. This is a high-risk investment and you are unlikely to be protected if something goes wrong. Take 2 minutes to learn more
BNTUSD Analysis: The market continues to crash in a bearish channel
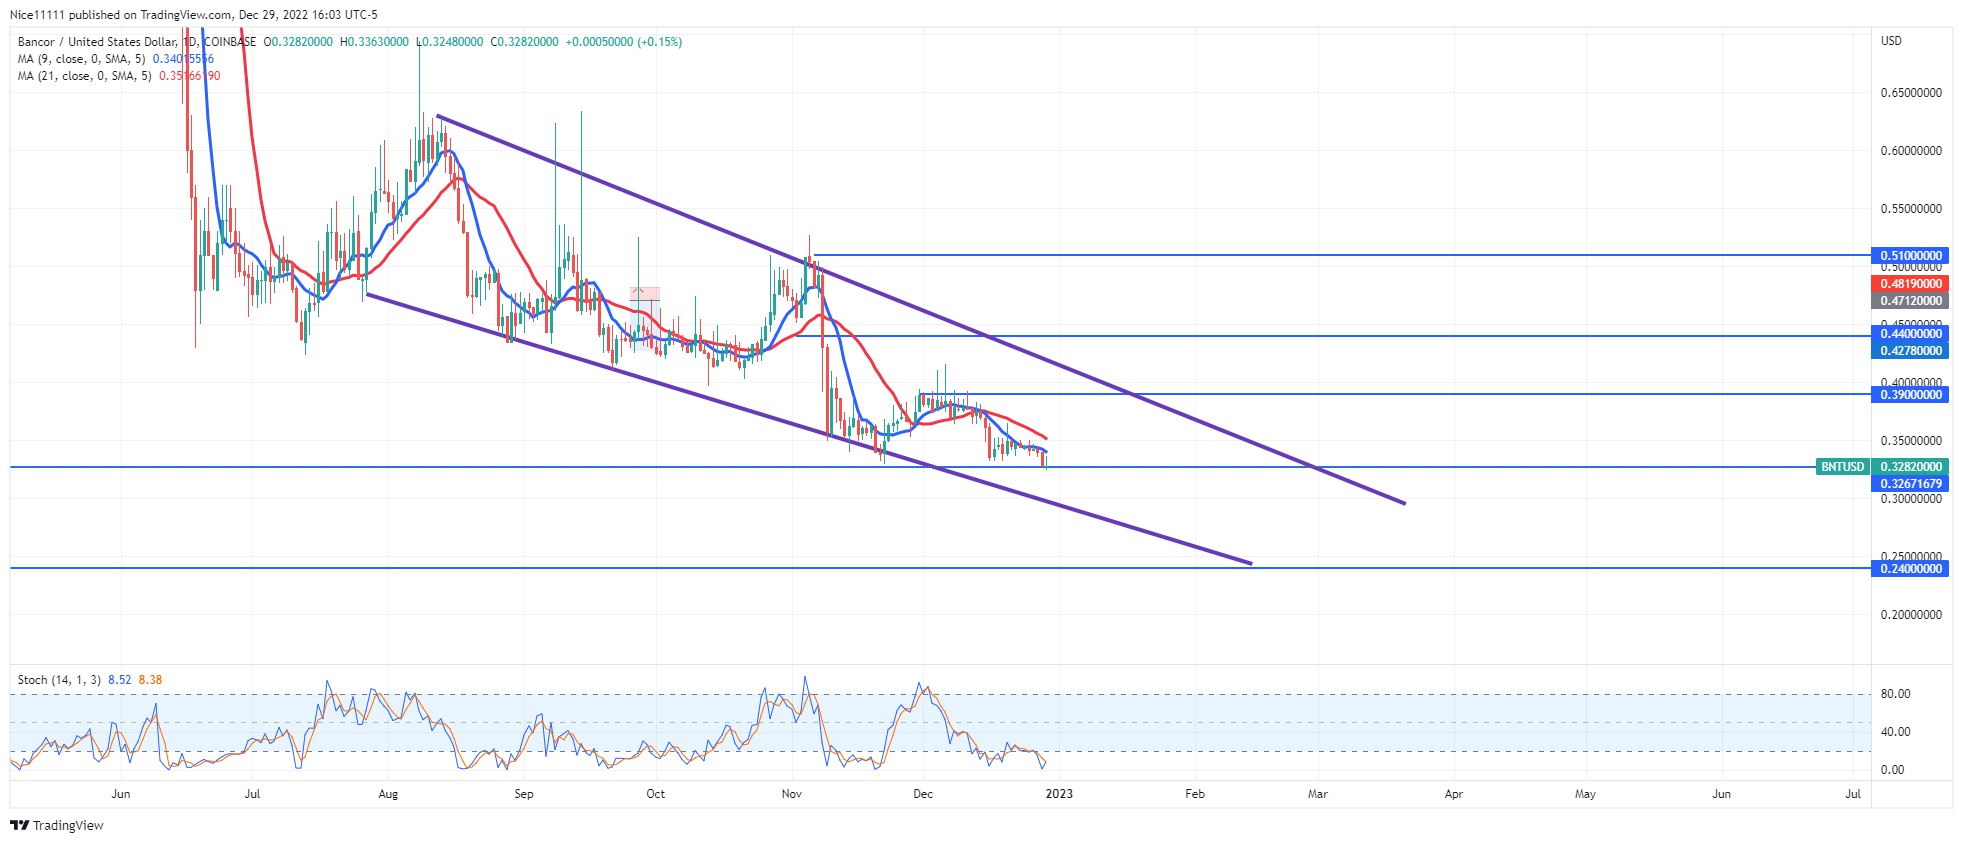
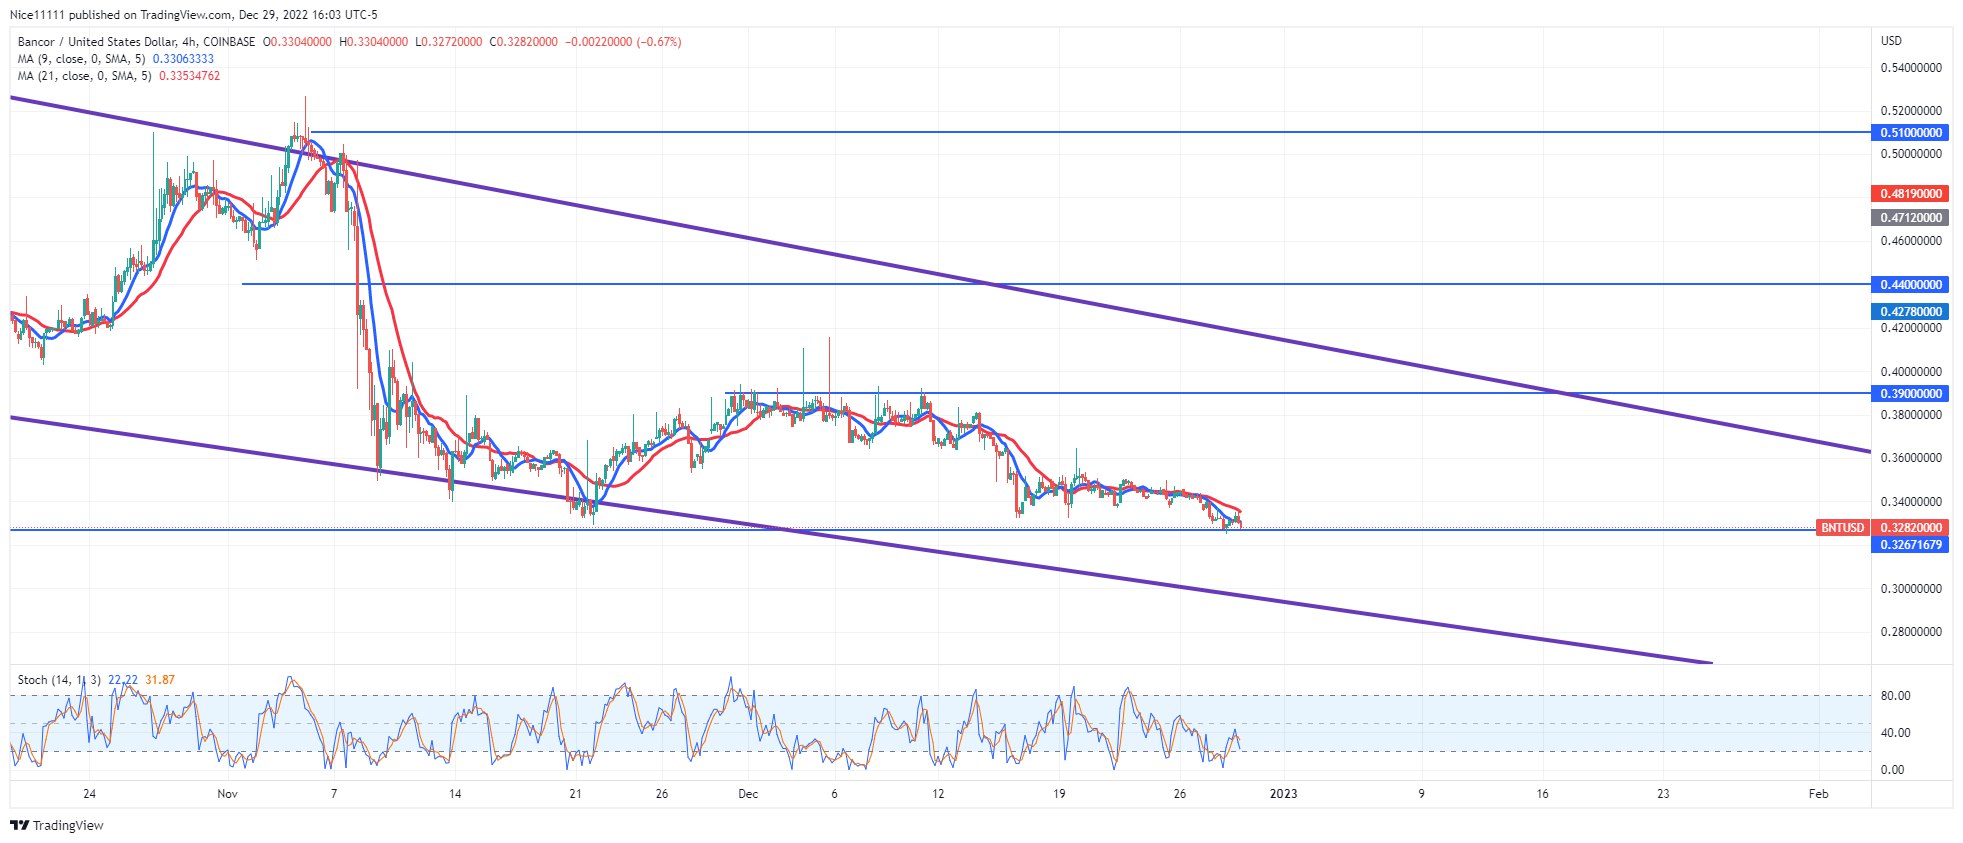
Bancor (BNTUSD) continues to crash in a falling wedge. The buyers are completely overwhelmed by the selling force in the market. Significant lows are consistently failing to keep prices stable.
BNTUSD Significant Zones
Demand Zones: $0.330, $0.240
Supply Zones: 0.390, 0.440
The direction of the market is bearish. All the significant lows this year have failed to keep prices from dipping. The market is reaching demand levels from previous years. The buyers are completely displaced, as their footprints are hardly noticeable during this time. The market is crashing steadily without much opposition from buyers. The market was overbought during August, as indicated by the Stochastic. The Moving Averages (Periods nine and twenty-one) crossed on the daily chart. The shorter MA (Moving Average) slid beneath the longer MA to confirm the initiation of a bearish market.
The market moved sideways in October. The range was formed between $0.510 and $0.440. The consolidation was broken after a double top formed at $0.510 in November. The MA period nine ducked below the MA period 21. The Stochastic also indicated the market was overbought. As a result, the price fell to the $0.330 support level.
Market Expectation
Once again, the demand level at $0.330 is currently under a bearish attack. The support level is likely to fail as there are no signs yet of buyer recovery. The market is expected to pierce through the $0.320 support level to reach the lower border of the falling wedge around $0.240.
You can purchase Lucky Block here. Buy LBLOCK
Note: Cryptosignals.org is not a financial advisor. Do your research before investing your funds in any financial asset or presented product or event. We are not responsible for your investing results.