Binance Coin Consolidates As It Turns Down From The $280 High
Estimated Reading Time: 2 minutes
Don’t invest unless you’re prepared to lose all the money you invest. This is a high-risk investment and you are unlikely to be protected if something goes wrong. Take 2 minutes to learn more
Binance Coin (BNB) Long-Term Analysis: Bearish
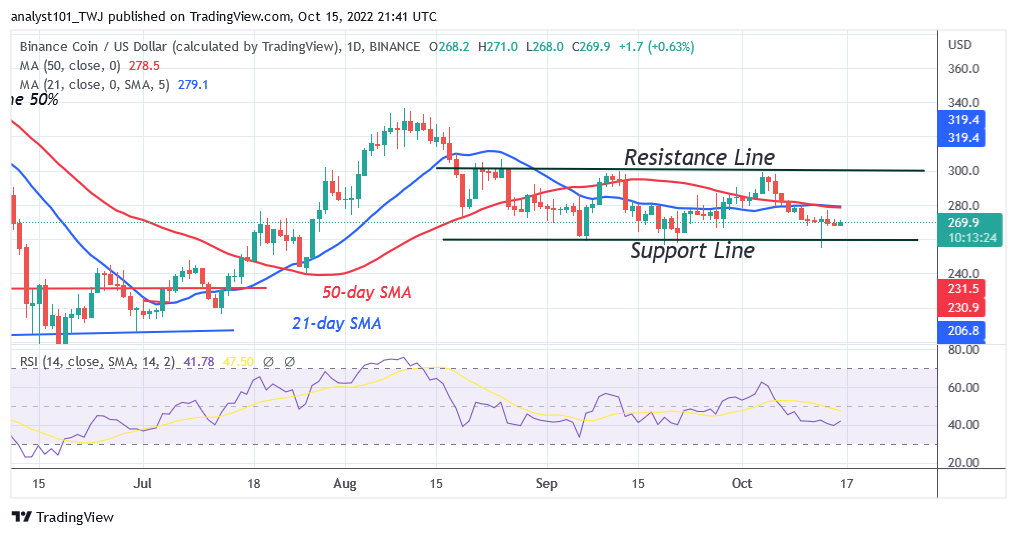
Binance Coin’s (BNB) price is in a downtrend as it turns down from the $280 high. For the past five days, the price action has been dominated by small body indecisive candlesticks called Doji. On October 13, sellers breached the current support at $260 as bulls bought the dips. The Doji candlesticks indicate that buyers and sellers are undecided about the direction of the market. Presently, BNB is trading in a tight range between $260 and $300 price levels. The altcoin will continue its range bound move as long as the Doji candlesticks dominate price action.
Binance Coin (BNB) Indicator Analysis
BNB has continued its sideways move as it is at level 45 of the Relative Strength Index for period 14. The market will further decline as the price bars are below the moving average lines. The cryptocurrency is trading in the oversold region of the market. It is below 20% range of the daily stochastic.
Technical indicators:
Major Resistance Levels – $440, $460, $480
Major Support Levels – $240, $220, $200
What Is the Next Direction for Binance Coin (BNB)?
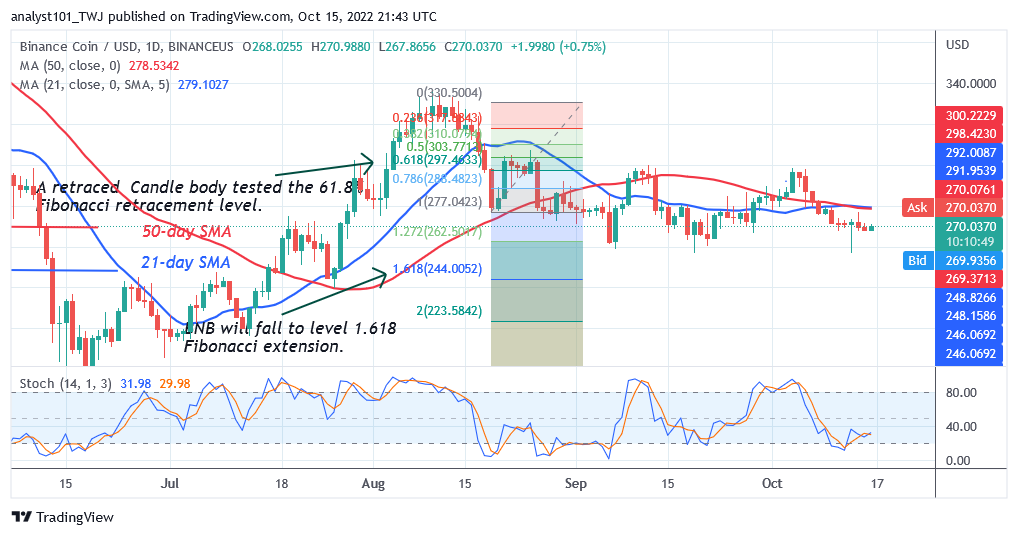
Binance Coin has been in a downward move as it turns down from the $280 high. According to the Fibonacci tool analysis, the market will decline to the level 1.618 Fibonacci extension or level $244 price level. In the meantime, BNB is consolidating above the $270 support for a possible upward move.
You can purchase crypto coins here. Buy LBLOCK
Note: Cryptosignals.org is not a financial advisor. Do your research before investing your funds in any financial asset or presented product or event. We are not responsible for your investing results.