Binance Coin Faces Rejection at $500 but Finds Support above $400
Estimated Reading Time: 2 minutes
Don’t invest unless you’re prepared to lose all the money you invest. This is a high-risk investment and you are unlikely to be protected if something goes wrong. Take 2 minutes to learn more

Binance Coin (BNB) Long-Term Analysis: Bearish
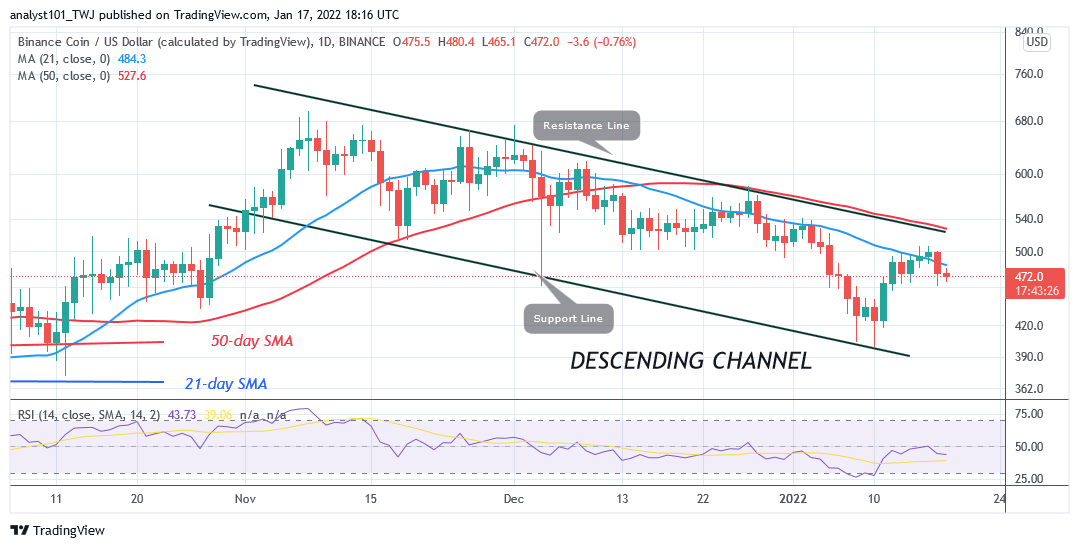
Today, Binance Coin’s (BNB) price is falling as the altcoin finds support above $400. On January 10, the bears pushed the altcoin to the low of $407 as bulls bought the dips. The cryptos price corrected upward but was resisted at the recent high. BNB’s price has fallen and it is consolidating above the $400.support. Also, the altcoin has reached the oversold region of the market. A further downward move is unlikely.
Binance Coin (BNB) Indicator Analysis
Because of the upward correction, the altcoin has risen to level 44 of the Relative Strength Index period 14. The altcoin is still in the downtrend zone and below the centerline 50. The crypto’s price bars are below the moving averages which makes the altcoin fall. The 21-day line moving average is acting as a resistance to price. BNB is below the 20% range of the daily stochastic. The altcoin is trading in the oversold region of the market. Buyers are likely to emerge to push prices upward.
Technical indicators:
Major Resistance Levels – $640, $660, $680
Major Support Levels – $540, $520, $500
What Is the Next Direction for Binance Coin (BNB)?
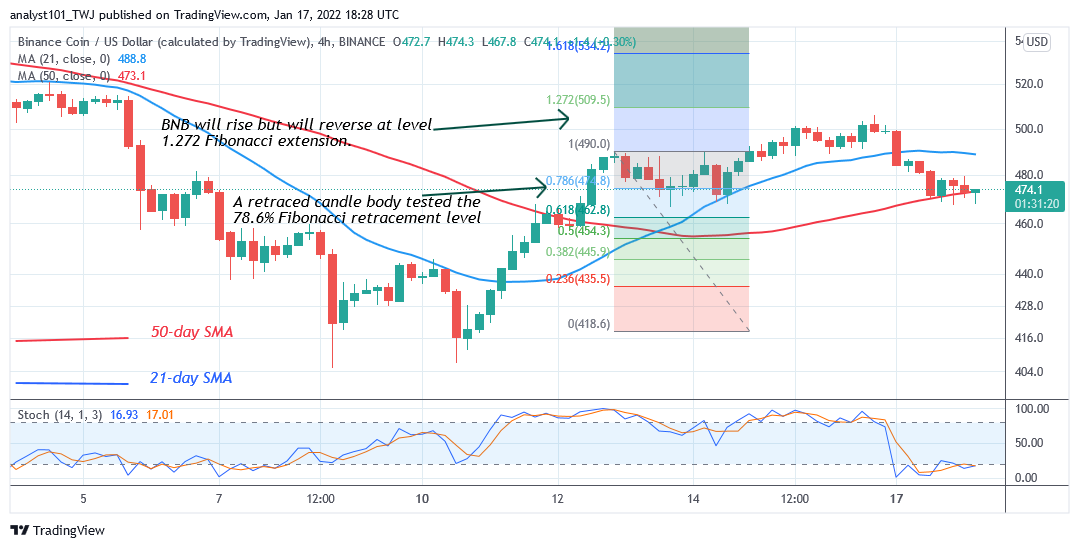
Binance Coin is in a downward correction as it finds support above $400. The crypto’s price is fluctuating between $416 and $500 price levels. Meanwhile, on November 12 uptrend; a retraced candle body tested the 78.6% Fibonacci retracement level. The retracement indicates that Binance Coin will rise to level 1.272 Fibonacci extension or $509.50. From the price action, BNB is reversing after retesting the high of $500.
You can purchase crypto coins here. Buy Tokens
Note: Cryptosignals.org is not a financial advisor. Do your research before investing your funds in any financial asset or presented product or event. We are not responsible for your investing results