Binance Coin Fluctuates in a Range but Challenges the $300 High
Estimated Reading Time: 2 minutes
Don’t invest unless you’re prepared to lose all the money you invest. This is a high-risk investment and you are unlikely to be protected if something goes wrong. Take 2 minutes to learn more

Free Crypto Signals Channel
Binance Coin (BNB) Long-Term Analysis: Bullish
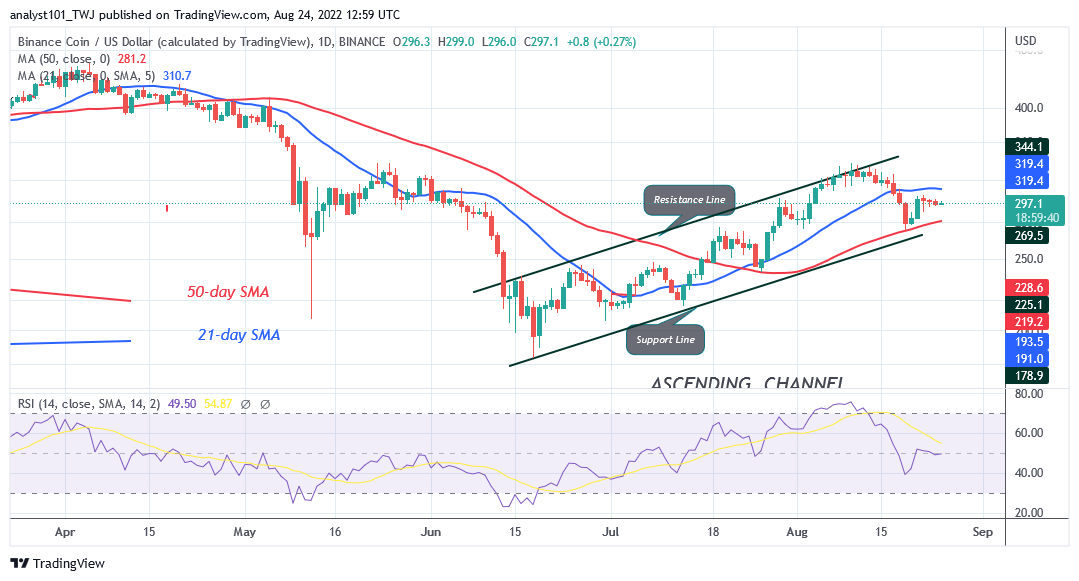
Binance Coin’s (BNB) price is in an upward correction as it challenges the $300 high. BNB price is fluctuating above the 50-day line SMA but below the 21-day line SMA. Buyers are attempting to push the altcoin above the 21-day line but were repelled. On the upside, if the bulls breach the 21-day line SMA, BNB will rally to the $338 overhead resistance. Conversely, if the bears break below the 50-day line SMA support, the market will decline to the low of $244. In the meantime, BNB/USD is trading at $297 at the time of writing.
Binance Coin (BNB) Indicator Analysis
BNB is at level 49 of the Relative Strength Index for period 14. It indicates that there is a balance between supply and demand. The crypto’s price bars are between the moving average lines which indicate a possible range-bound move of the cryptocurrency. The altcoin is below the 80% range of the daily stochastic. It indicates that the market is in a bearish momentum.
Technical indicators:
Major Resistance Levels – $640, $660, $680
Major Support Levels – $540, $520, $500
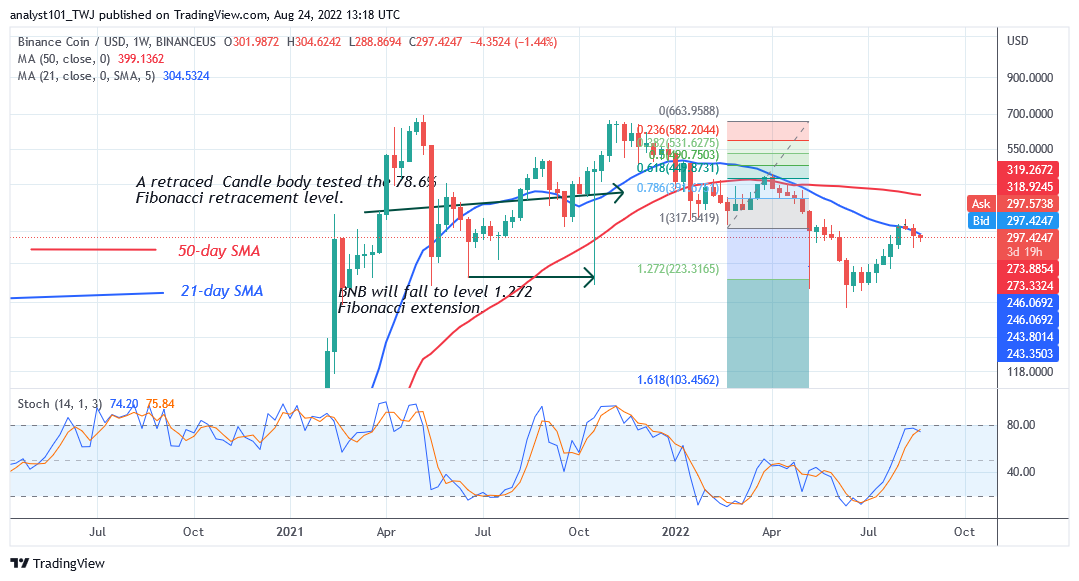
What Is the Next Direction for Binance Coin (BNB)?
Binance Coin may resume downward as it faces rejection at the recent high. Meanwhile, on a weekly chart, a retraced candle body tested the 78.6% Fibonacci retracement level on March 28. The retracement suggests that BNB will fall to level 1.272 Fibonacci extension or $223.31.
You can purchase crypto coins here. Buy LBLOCK
Note: Cryptosignals.org is not a financial advisor. Do your research before investing your funds in any financial asset or presented product or event. We are not responsible for your investing results