Binance Coin Makes a Positive Move as It Revisits the $361 High
Estimated Reading Time: 2 minutes
Don’t invest unless you’re prepared to lose all the money you invest. This is a high-risk investment and you are unlikely to be protected if something goes wrong. Take 2 minutes to learn more
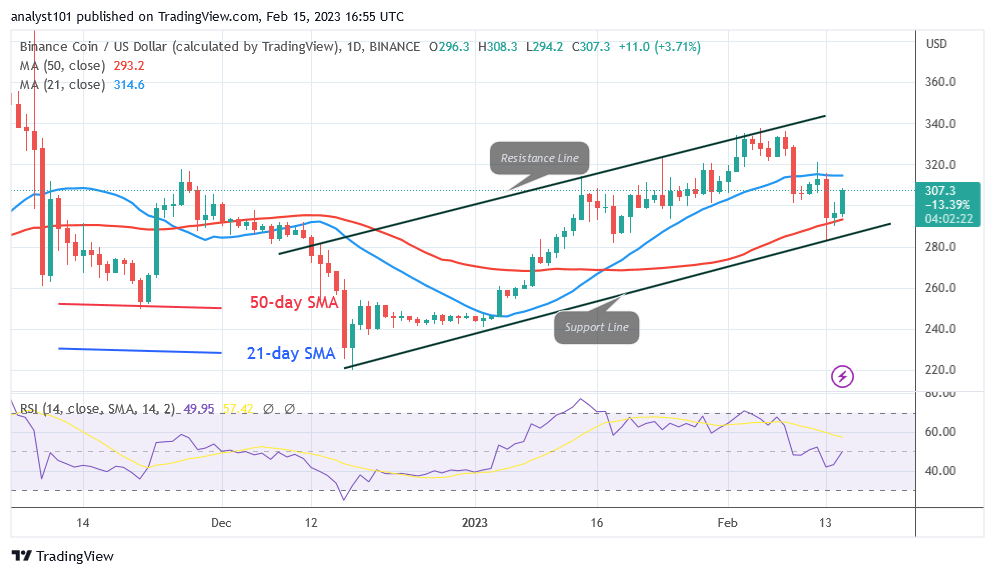
Binance Coin (BNB) Long-Term Analysis: Bullish
Binance Coin (BNB) price has been dropping as it revisits the $361 high. Above the 50-day SMA, the cryptocurrency has regained bullish momentum. Currently, the price of BNB is situated between the moving average lines. As it approaches the 21-day line SMA, it is climbing. If the price moves over the 21-day line SMA, the crypto asset will resume moving in the bullish direction. The cryptocurrency will reach its highs of $335 and $361 if it breaks over the 21-day line SMA. However, if the bullish scenario is rejected, the range-bound move will start.
Binance Coin (BNB) Indicator Analysis
The equilibrium price level for the BNB price for period 14 is level 66 on the Relative Strength Index. The crypto range-bound trend will persist as long as the price bars are restricted by the moving average lines.BNB has surged to the market’s overbought area. It is at level 80 of the daily stochastic. As a result, the coin can drop.
Technical indicators:
Major Resistance Levels – $440, $460, $480
Major Support Levels – $240, $220, $200
What Is the Next Direction for Binance Coin (BNB)?
Binance Coin is trading between the moving average lines as it revisits the $361 high. The price of the cryptocurrency has risen above the moving average lines on the 4-hour chart, but it has remained above the 50-day line SMA. Prices are unlikely to continue to rise.
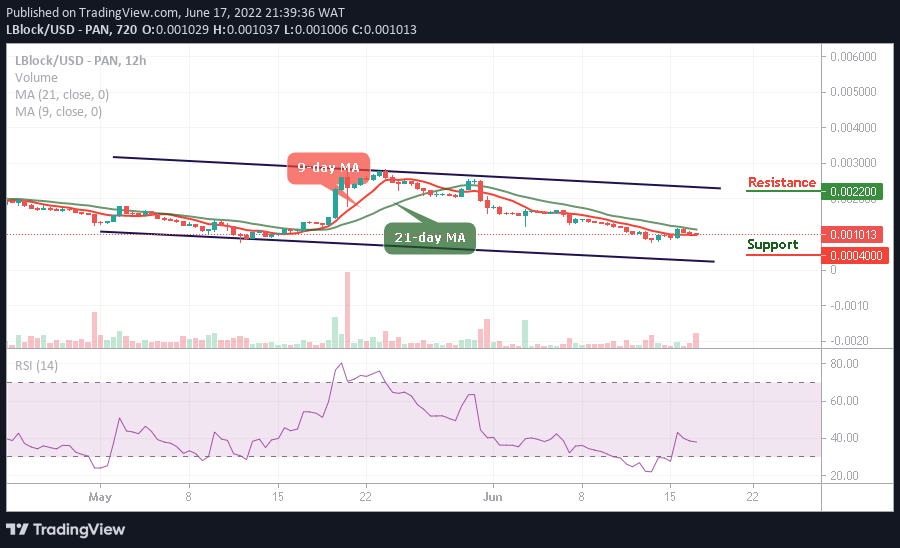
You can purchase crypto coins here. Buy LBLOCK
Note: Cryptosignals.org is not a financial advisor. Do your research before investing your funds in any financial asset or presented product or event. We are not responsible for your investing results