BNB Remains Flat As It Holds Above The $210 Support
Estimated Reading Time: 2 minutes
Don’t invest unless you’re prepared to lose all the money you invest. This is a high-risk investment and you are unlikely to be protected if something goes wrong. Take 2 minutes to learn more

BNB (BNB) Long-Term Analysis: Bearish
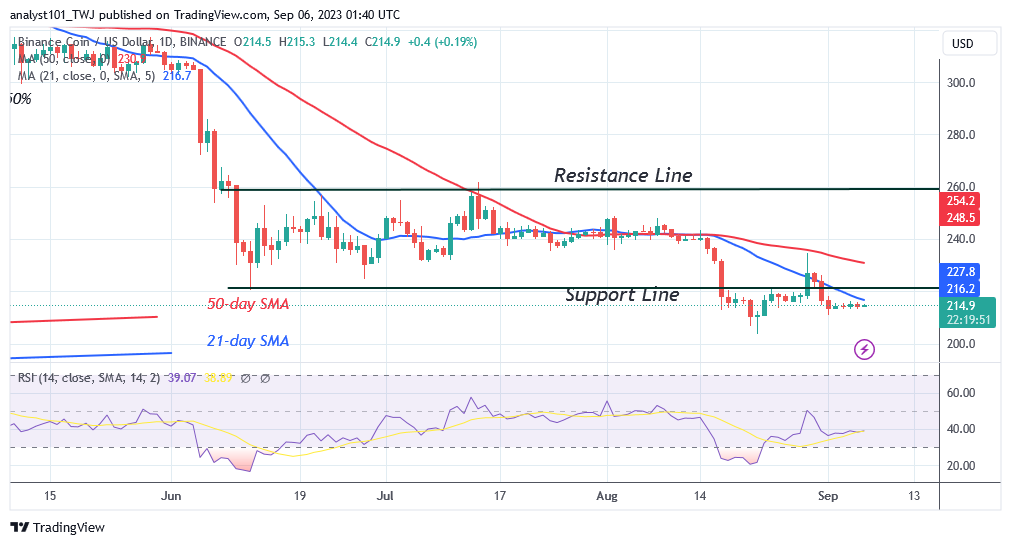
BNB’s (BNB) price has been holding above the $210 support level since September 1. Doji candlesticks have been present, which has kept the price movement steady. At the time of writing, the altcoin has only grown to a high of $214 since September 1. It seems unlikely that the altcoin will continue to rise. BNB was rejected on August 29 at the high of $234 or by the 21-day moving average line.
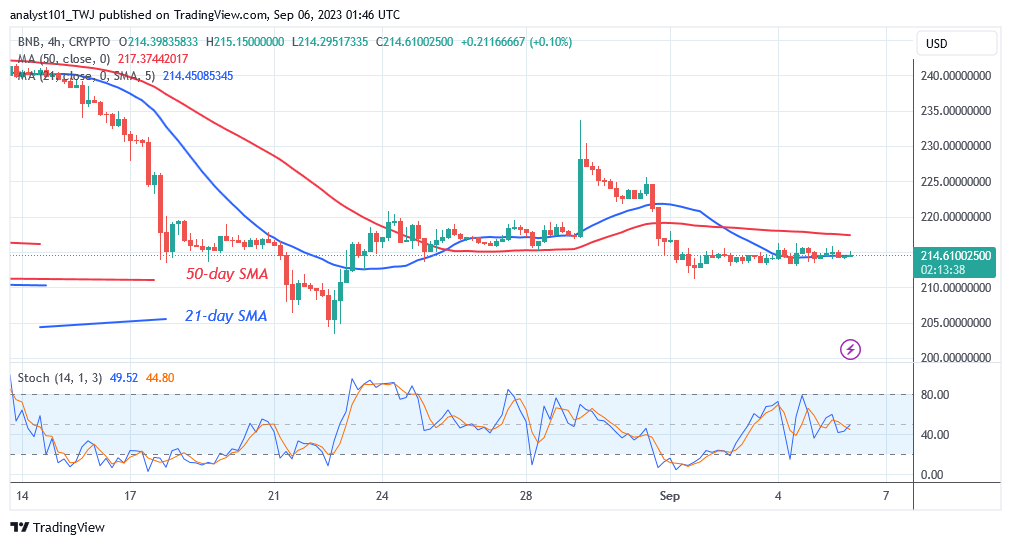
The price bar is currently retesting the 21-day SMA as the altcoin begins its upward trend.
BNB will fall and revert to its previous low of $203 if it is rejected. The market will rise above the moving average lines if the price moves over the current support level. The bullish momentum will peak at $240. Meanwhile, the altcoin is holding above the $210 support level.
Technical indicators:
Major Resistance Levels – $440, $460, $480
Major Support Levels – $240, $220, $200
Binance Coin (BNB) Indicator Analysis
The BNB price remains at level 39 on the Relative Strength Index for period 14. The coin is staying in the bearish trend zone as it consolidates. The price bars are retesting the 21-day simple moving average, which could lead to a collapse or breakout. The altcoin is gaining momentum over the daily Stochastic threshold of 60.
What Is the Next Direction for Binance Coin (BNB)?
BNB is currently trading below its prior range-bound zone as it holds above the $210 support. The 21-day SMA is restraining the rising movement. If BNB/USD fails to break beyond the 21-day SMA, it will be forced to trade in a range between $203 and $215. Meanwhile, the price movement has been flat due to the existence of Doji candlesticks.
You can purchase crypto coins here. Buy LBLOCK
Note: Cryptosignals.org is not a financial advisor. Do your research before investing your funds in any financial asset or presented product or event. We are not responsible for your investing results