BNB Revisits the $600 Barrier and Restarts the Range
Estimated Reading Time: 2 minutes
Don’t invest unless you’re prepared to lose all the money you invest. This is a high-risk investment and you are unlikely to be protected if something goes wrong. Take 2 minutes to learn more

BNB (BNB) Long-Term Analysis: Bullish
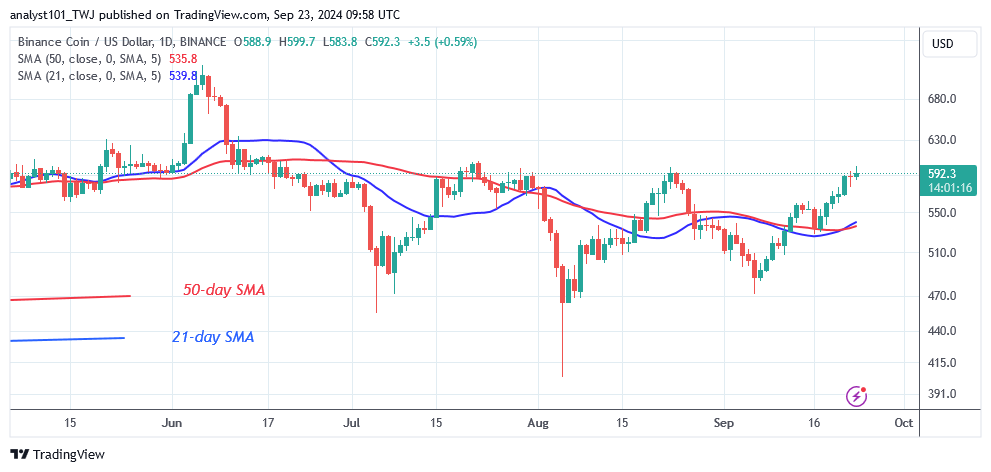
BNB’s price rises as it breaks above the moving average lines and restarts the range. The cryptocurrency remains a sideways trend, but it has to $590 today. The BNB price has risen to its prior high of $600. This is the third time the altcoin would rise to its peak price of $600. The price signal points to further upward movement of the cryptocurrency. BNB will rise to a high of $620 if the current resistance level is broken.
The altcoin will trade in a sideways pattern, above the moving average lines but below the previous high, where it faces selling pressure. The altcoin is now valued at $605.20.
Technical indicators:
Major Resistance Levels – $600, $660, $720
Major Support Levels – $400, $340, $280
BNB (BNB) Indicator Analysis
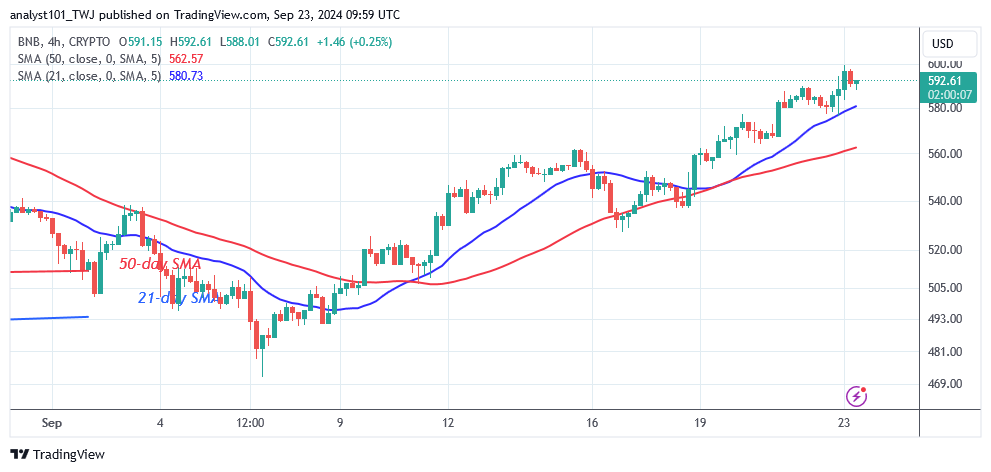
Both charts show BNB’s price bars above the moving average lines. Crypto assets will rise as the price bars remain above the moving average lines. The price action contains Doji candlesticks which slow price movement. The moving average lines have bullish crossovers indicating the rise of the cryptocurrency.
What Is the Next Direction for BNB (BNB)?
On the 4-hour chart, BNB rises to a high of $602 and restarts the range.The crypto asset has been rising steadily due to the presence of Doji candlesticks. Since July 21, buyers have struggled to sustain their bullish momentum above the $600 overhead resistance. If BNB falls below the $600 overhead barrier, it will begin a sideways trend. Meanwhile, the cryptocurrency signal is positive due to the upward trend.
You can purchase Lucky Block here. Buy LBLOCK
Note: Cryptosignals.org is not a financial advisor. Research before investing your funds in any financial asset,r presented product,t or event. We are not responsible for your investing results.