BNB’s Downward Momentum Slows as It Approaches the $208 Low
Estimated Reading Time: 2 minutes
Don’t invest unless you’re prepared to lose all the money you invest. This is a high-risk investment and you are unlikely to be protected if something goes wrong. Take 2 minutes to learn more

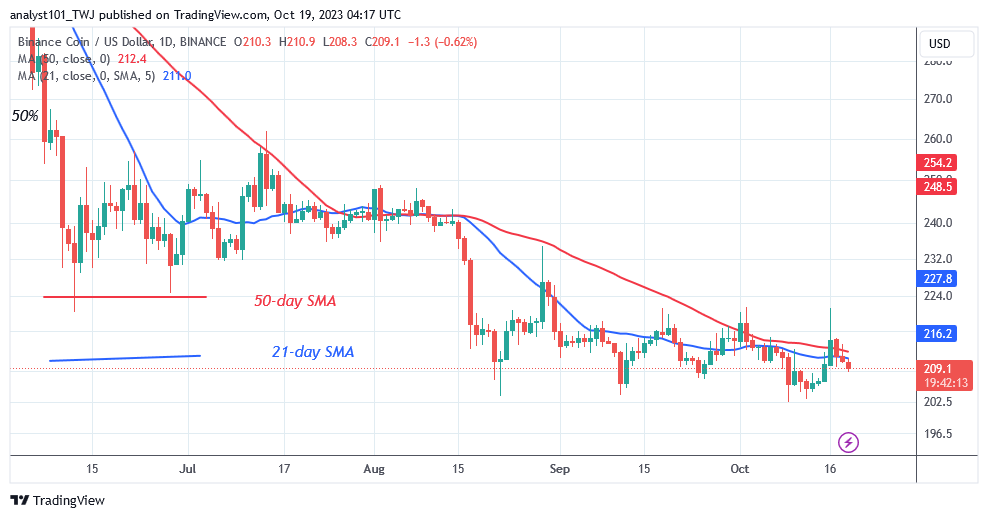
BNB (BNB) Long-Term Analysis: Ranging
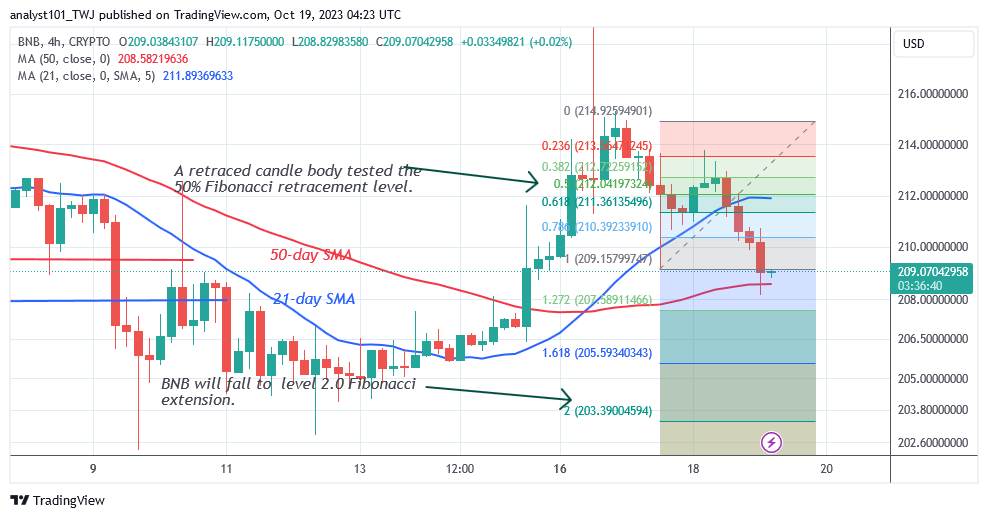
BNB (BNB)’s price has constantly remained within its range as it approaches the $208 low. Doji candlesticks have allowed for the maintenance of the price range of $200 to $213. The bearish momentum is currently fading over the $208 support level. Buyers kept the price above the moving average lines on October 16 as it reached a high of $221.
Buyers were unable to maintain the positive trend as the altcoin was repulsed. Since the August 17 price slump, BNB/USD has been under selling pressure at a higher price level. At the time of writing, the altcoin is worth $209.50. On the downside, BNB is projected to reach a low of $203.
Technical indicators:
Major Resistance Levels – $440, $460, $480
Major Support Levels – $240, $220, $200
BNB (BNB) Indicator Analysis
BNB’s price is falling as it approaches the $208 low. The Doji candlesticks, on the other hand, limit price drops to the bottom above the lower price range. When price bars are above the moving average lines, the altcoin will rise. On the plus side, the gains are limited by the $220 resistance.
What Is the Next Direction for BNB (BNB)?
Binance Coin’s price has dropped below the moving average lines as it approaches the $208 low. When the cryptocurrency’s price goes below the moving average lines, the bearish momentum weakens around the lower price range. This is due to the current support’s high purchasing pressure. Buyers are always drawn when an altcoin approaches oversold territory.
You can purchase crypto coins here. Buy LBLOCK
Note: Cryptosignals.org is not a financial advisor. Do your research before investing your funds in any financial asset or presented product or event. We are not responsible for your investing results


