Bitcoin Cash (BCH/USD) Market Deepens Motions Downward
Estimated Reading Time: 3 minutes
Don’t invest unless you’re prepared to lose all the money you invest. This is a high-risk investment and you are unlikely to be protected if something goes wrong. Take 2 minutes to learn more

Free Crypto Signals Channel
Bitcoin Cash Price Prediction – June 17
The market operation between Bitcoin Cash and the US Dollar deepens motions downward to establish that the crypto economy is still in a bearish market. The trading cycle has witnessed a high of $117 and a low of $107 in the last several hours. 4.01 percent is seen as the rate of the market presently.
BCH/USD Market
Key Levels:
Resistance levels: $150, $200, $250
Support levels: $100, $80, $60
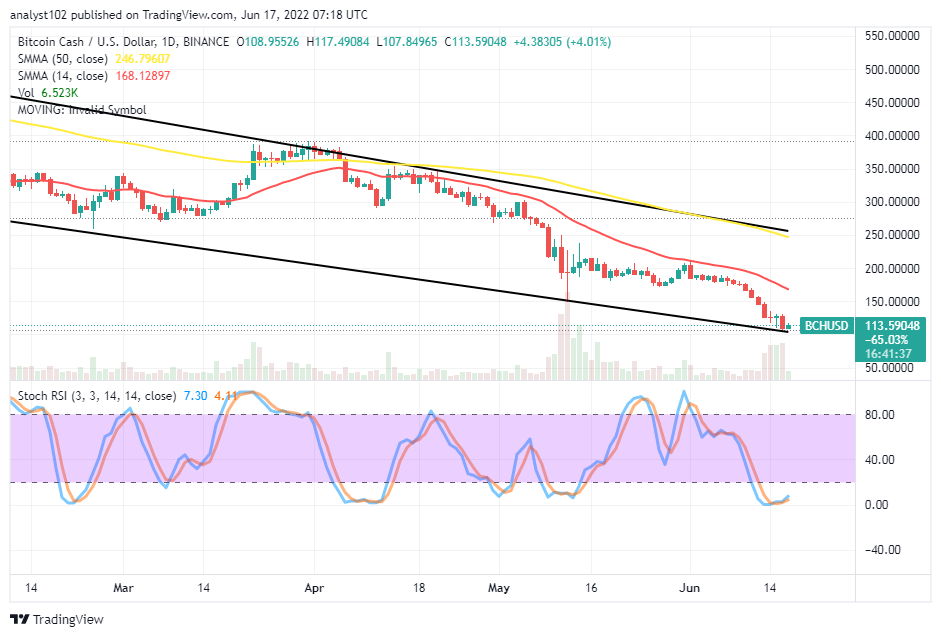
BCH/USD – Daily Chart
The BCH/USD daily chart reveals the crypto market deepens motions downward to trade around the lower bearish channel trend line. The 14-day SMA indicator is underneath the 50-day SMA indicator. The upper bearish channel trend line drew alongside the bigger-SMA trend line. The Stochastic Oscillators are in the deep-shallow trading zone with their lines conjoined within to signify a declining pressure is ongoing.
Will the BCH/USD market precipitate more downward?
There can still be a little more precipitation in the BCH/USD market operations to the downside as the crypto market deepens motions downward to find support at a lower-trading spot. From the mere technical point, long-position takers needed to await a bullish candlestick with full-body at a low-trading spot for confirmation of getting a decent buying wall afterward. In the meantime, a buy order can be while price pulls down and couple it a bounce-off trait.
On the downside of the BCH/USD market technical analysis, bears needed to be firm in their positions around the $100 support level. In absentia of bulls’ expectation to start building up catalysts around the value line, bears will continue to push the trade-in sequential order into a lower zone in the days that will be following for some time afterward. Some selling signals are in smaller time frames.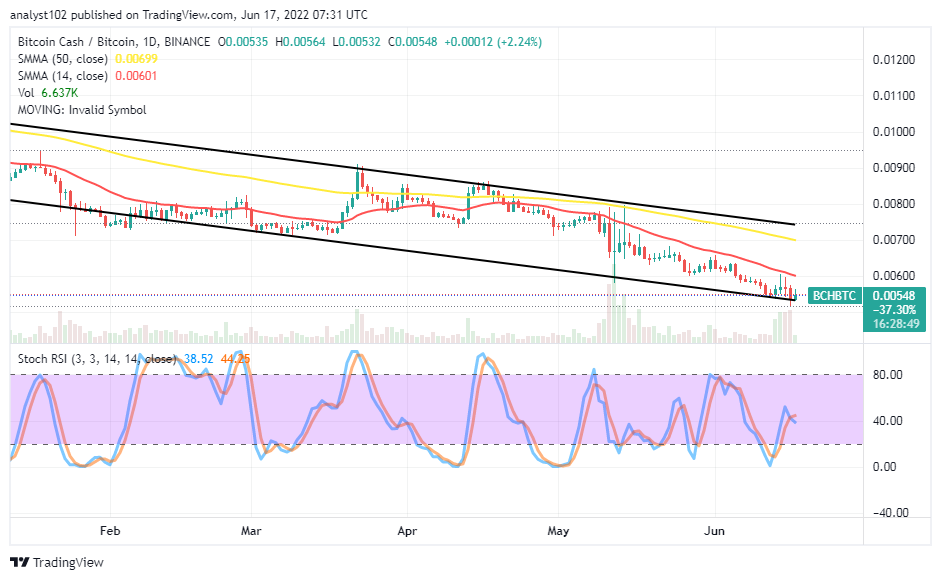
BCH/BTC Price Analysis
Bitcoin Cash market has been under a perfect downward-trending motion against Bitcoin’s pushing power. The cryptocurrency pair market deepens motions downward in its trending outlook. The 14-day SMA indicator is underneath the 50-day SMA indicator. The bearish channel trend lines drew southward to embody the SMAs. The Stochastic Oscillators have initially swerved northbound from the oversold region to the 40 range point. And they are attempting to cross the lines southbound around the range value to suggest the base trading crypto may begin to lose momentum again to the counter-trading crypto.
Note: Cryptosignals.org is not a financial advisor. Do your research before investing your funds in any financial asset or presented product or event. We are not responsible for your investing results.
“Lucky is up more than 50% today but still more than 430% from All Time Highs!
The opportunity to bank BIG is now!
You can purchase Lucky Block here. Buy LBlock