Bitcoin Cash (BCH/USD) Market Holds in Lower Levels
Estimated Reading Time: 3 minutes
Don’t invest unless you’re prepared to lose all the money you invest. This is a high-risk investment and you are unlikely to be protected if something goes wrong. Take 2 minutes to learn more
Bitcoin Cash Price Prediction – October 1
The BCH/USD financial book of records that the crypto market holds in lower levels at $600 and $400 is a continuation of what looks like a range trading pattern. There has been a relative increase in the crypto-fiat currency pair’s percentage rate as the figure is at 1.10, trading around the line of $508 as of writing.
BCH/USD Market
Key Levels:
Resistance levels: $600, $800, $1,000
Support levels: $400, $300, $200
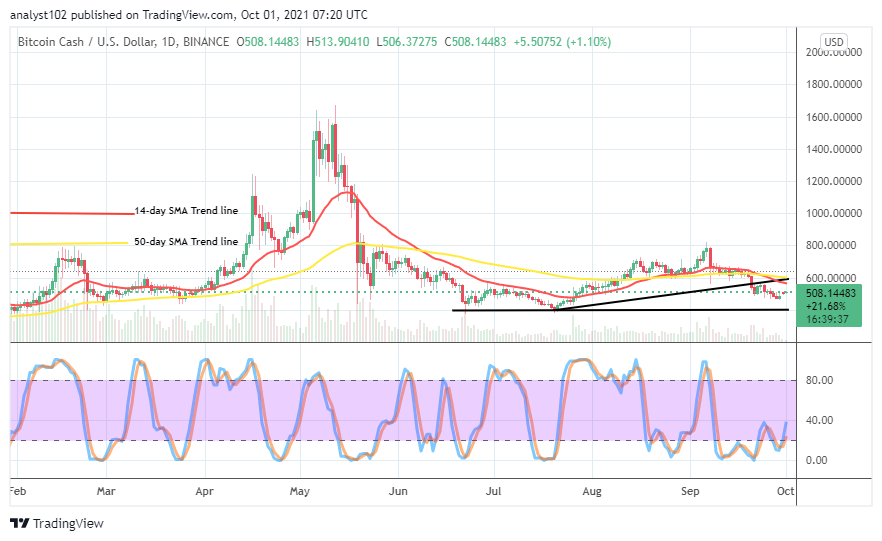
BCH/USD – Daily Chart
The BCH/USD daily chart reveals that the crypto-fiat economic market holds lower levels of $600 and $400 as the price tries to move northward. The trading indicators are over the current featuring of smaller-candlesticks representing the market’s operations. The 14-day SMA indicator has briefly crossed southward from the 50-day SMA indicator as the bullish trend line supporting the bigger SMA trend line has also breached to the downside. The Stochastic Oscillators have swerved northbound to touch the range 40. That is an indication that the market is attempting to swing up.
Has there been a sign that the BCH/USD price increase valuation as the market holds in lower levels?
The present trading signal denotes a flimsy technical notion to the upside as the crypto-fiat economic market holds lower levels of $600 and $400. The lower value line will, for a long time, acts as the support baseline. Therefore, as price pushes toward it will be to let bulls and investors rebuild their positions.
On the contrary to the upside analysis of this market, bears would have to maintain a firm presence against efforts aimed at breaching the $600. A sudden spike at that level will dowse the tension of getting to a smaller-wider space between the two SMAs to the south. All in all, short-position takers, at this level of trading, should be cautious of re-entry.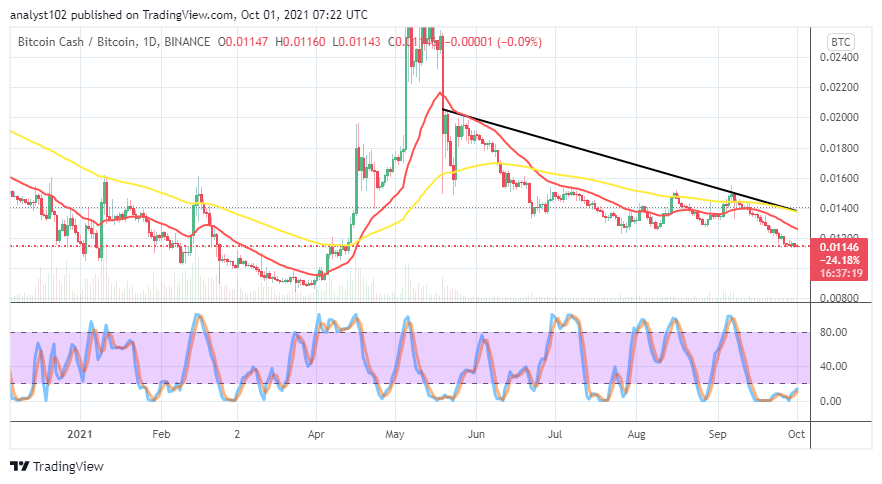
BCH/BTC Price Analysis
In comparison, the price analysis chart showcases the duo-crypto-economic market holds down at a lower trading line. That means that the base crypto still loses the trending capacity to the most expensive counter crypto. The 14-day SMA indicator briefly stretches southward further beneath the 50-day SMA indicator to denote the pace at which BCH decreases, paired with BTC. It is distinct now that the Stochastic Oscillators move in a consolidation manner in the oversold region, suggesting that the base crypto is yet to stage a come-back in trending energy against its counter trading instrument.
Note: Cryptosignals.org is not a financial advisor. Do your research before investing your funds in any financial asset or presented product or event. We are not responsible for your investing results.
You can purchase crypto coins here. Buy Tokens