Bitcoin Cash (BCH/USD) Market Is Trading Sideways
Estimated Reading Time: 3 minutes
Don’t invest unless you’re prepared to lose all the money you invest. This is a high-risk investment and you are unlikely to be protected if something goes wrong. Take 2 minutes to learn more

Free Crypto Signals Channel
Bitcoin Cash Price Prediction – July 15
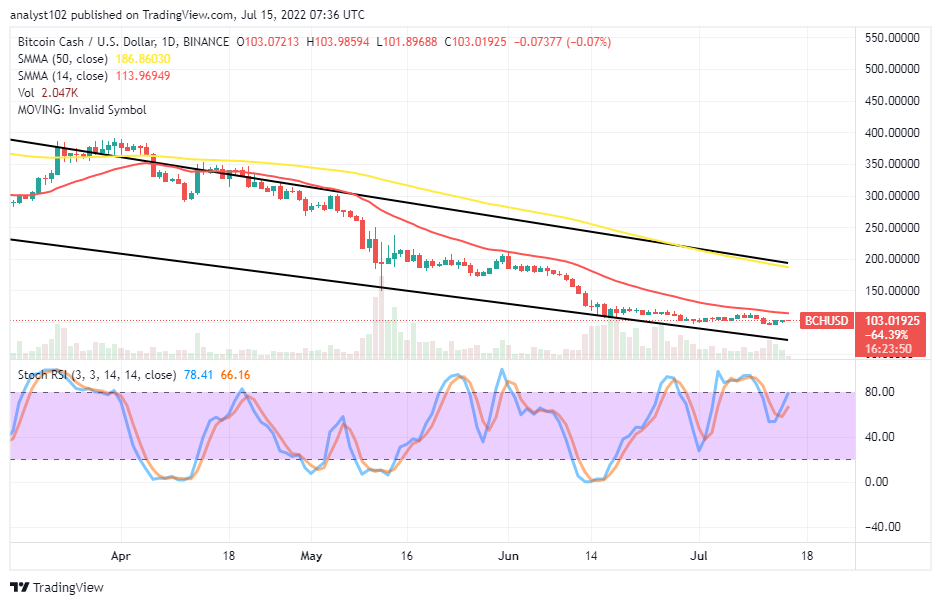
The trading situation in the BCH/USD transactions shows the crypto market is trading sideways closely over the $100 support point. In the last few hours of today’s session, the price has feebly featured between the high and low-value lines of $103 and $101 at a minimal minute percentage rate of 0.07 negative.
BCH/USD Market
Key Levels:
Resistance levels: $125, $150, $175
Support levels: $100, $80, $60
BCH/USD – Daily Chart
The BCH/USD daily chart reveals the crypto market is trading sideways within the resistance and support value lines of $150 and $100. The 14-day SMA trend line stands around $113 beneath the 50-day SMA, which showcases a resistance of around $186. The Stochastic Oscillators initially crossed southbound from the overbought region toward a range of about 50 but is now northbound, touching a range at 80. That suggests the crypto is relatively pushing against the US coin.
Will the BCH/USD market surge high out of trading in the range-bound zone soon?
As the BCH/USD market is trading sideways, the crypto trade operations seem not to possess the catalyst to surge higher overtime over the trend line of the 14-day SMA. Bulls needed to sum up energy from below the smaller-SMA trading indicator to breach forcefully past the $113 resistance. A long-term investor may consider buying into the trading pair instrument just as the price is around one of its lowest points presently.
On the downside of the technical analysis, the first level of a barrier-trading spot is around the $113 resistance level. If the price should, in no time or the long, runs in a rallying motion past the value line, there can be the probability of it approaching higher resistances beneath the trend line of the 50-day SMA. That said, short-position takers need to exercise caution at the moment to see what will be the reading outcome of the Stochastic Oscillators in the overbought region in the following few days’ sessions before considering launching a sell order afterward.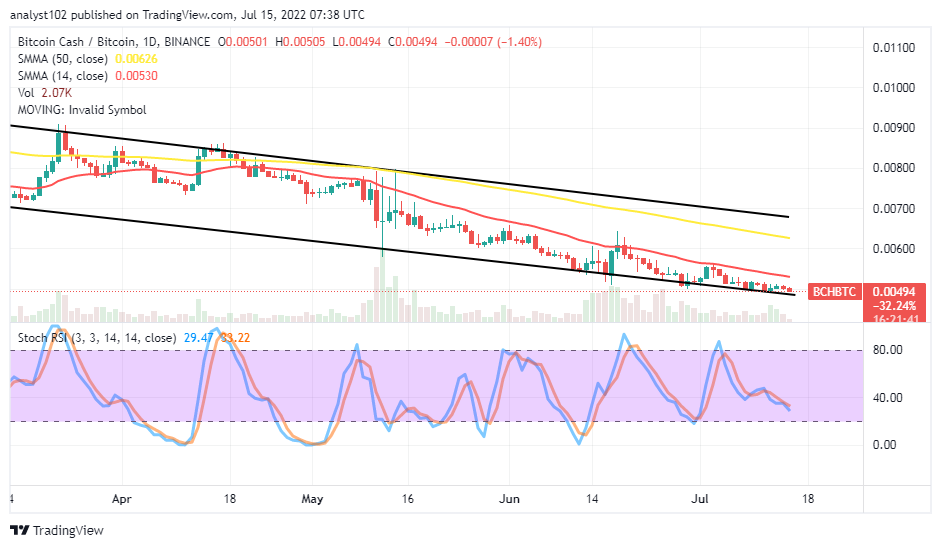
BCH/BTC Price Analysis
Bitcoin Cash has to maintain a depressing-moving format somewhat in a range outlook, pairing with Bitcoin. The cryptocurrency pair market is trading sideways in a slow-and-steady motion to the downside. The 14-day SMA indicator is underneath the 50-day SMA indicator. The Stochastic Oscillators have moved slantingly toward the 20 range, suggesting the base crypto is yet to push out of being debasing against the trending worth of the counter-trading crypto.
Note: Cryptosignals.org is not a financial advisor. Do your research before investing your funds in any financial asset or presented product or event. We are not responsible for your investing results.
“Lucky is up more than 50% today but still more than 430% from All Time Highs!
The opportunity to bank BIG is now!
You can purchase Lucky Block here. Buy LBlock

